Please cite this article as: V. R. Kalatjari, A. Naghizadeh, R. Naderi, M. H. Talebpour, Base Level Evaluation in Buildings with Different Foundation Levels by Soil-foundation-structure Interaction, International Journal of Engineering (IJE), TRANSACTIONS C: Aspects Vol. 30, No. 9, (September 2017) 1288-1297
International Journal of Engineering
J o u r n a l H o m e p a g e : w w w . i j e . i rBase Level Evaluation in Buildings with Different Foundation Levels by
Soil-foundation-structure Interaction
V. R. Kalatjaria, A. Naghizadeha, R. Naderia, M. H. Talebpour*b
a Department of Civil Engineering, Shahrood University of Technology, Shahrood, Iran b School of Engineering, Damghan University, Damghan, Iran
P A P E R I N F O
Paper history: Received 04 March 2017
Received in revised form 06 May 2017 Accepted 07 July 2017
Keywords: Base Level
Soil-foundation-structure Interaction Different Foundation Levels Artificial Accelerogram
A B S T R A C T
The base level is among the effective parameters in determining the seismic force on a structure, if the equivalent-static method is used for analyzing a structure. It is obvious that the base level is located on foundation in buildings in which foundation is built in a single level and there is not any interaction between the structure's walls and the soil; however, in some buildings which have underground part, the foundation is built in two different levels which in turn makes the determination of the location of base level uncertain. Since no relevant recommendation has been provided in the seismic codes, this study tries to remove such uncertainties. For this purpose, the structural models along with foundation and their peripheral soil were modeled by the ABAQUS software and regarding the soil type it was tested by an artificial accelerogram compatible with the spectrum of the code. Two types of soil (stiff and soft) were used in this study. The results indicated that the base level location is considerably influenced by the soil type, the number of entrance columns leading to the underground and the number of stories of the structure.
doi: 10.5829/ije.2017.30.09c.01
1. INTRODUCTION1
As a general definition, base level can be considered the level where seismic motions are transferred to the structure. The base level in structures with flat foundations is located on the foundation. However, this location can vary in proportion to different parameters in case where the foundation is implemented at two different levels. Therefore, in such structures, a thorough investigation should be conducted by taking into account all factors and parameters, including the number of storeys, distribution of columns between the upper and lower parts of the foundation, and the soil type at the construction site [1]. Studies indicate that in addition to the structural stiffness, the stiffness of the surrounding soil can also affect the structural behavior and, subsequently, the location of the base level. Therefore, in the present study, the soil-structure interaction was considered one of the main variables.
*Corresponding Author’s Email: [email protected] (M. H. Talebpour)
1289 V. R. Kalatjari et al. / IJE TRANSACTIONS C: Aspects Vol. 30, No. 9, (September 2017) 1288-1297
base level approaches the foundation surface level. Similarly, as the height of the basement increases, the location of the base level approaches the ground surface [4].
2. BASE LEVEL
A proper form in plan and height is needed for distributing the force between the structural components when one intends to calculate the internal forces imposed by the earthquake using the equivalent-static method. Most codes propose the following linear equation for distributing the base shear force in height [5, 6]:
1
i n
j k i i u
k j j w h V F
w h
(1)Where Fi is the lateral force applied at level, hi is the
height of ith floor from the base level, n is the number of floors starting from the base level, and wi is the
weight of ith floor. As it is seen, the force applied by earthquake on each floor's level depends on both the floor's mass and its height from the base level. Figure 1 shows that the base level for structures (a and b) begins in the foundation; in such structures, for determining the equivalent-static force, H1 and H2, are used. In some
other structures (Figure 1-c), several stories of a building are buried completely in the ground, as the structure is moved, in the buried area, by the soil and structure interaction (semi-buried structures). There are other buildings with underground area whose height varies from H1 in one part to H2 in another (Figures 1-d
and 1-e). For such structures, always this question is asked: which level needs to be considered as the base level for equivalent-static analysis. Seismic codes, have not proposed anything about this issue [5-6]. Hence, further studies on these structures are required to determine the exact location of the base level by considering all involving factors.
Since most studies have been focused on semi-buried structures (e.g. Figure 1-c), in this study, it is tried to focus on structures with two different levels of foundation (Figure 1-d).
Different codes have similar definitions for the base level. As a general definition, the base level can be considered as a level from which the longitudinal motion of earthquake is transferred to the structure. A concentration on the base shear equations shows that the base level, either directly or indirectly, is effective in calculating the force applied on the stories, as the earthquake force cannot be estimated correctly without having an exact value of this parameter in hand. Despite the importance of the base level in calculating the force applied by an earthquake, unfortunately there is not any
equation for finding this level in the semi-buried structures or those which are built in two different levels in the seismic codes. For this purpose, this study has dealt with analyzing the base level in the structures with different foundation levels (unlevel foundation) considering soil-foundation-structure interaction.
2. 1. Calculation of the Base Level in Buildings
with Different Foundation Levels With regard
to the base level definition, it seems that comparing the results of dynamic and equivalent-static analysis will lead us to find location of this level. For this purpose, the amounts of the internal forces of a structure, resulted from an equivalent-static analysis through taking H as the base level, need to be equalized with the results gained from the nonlinear dynamic analysis. The main problem of this process is comparing the results of the equivalent-static analysis (experience-based method) with a solely analytical method. As a solution, the equivalent-static analysis results can be compared with the dimensionless nonlinear dynamic analysis. In other words, if it is supposed that to determine the base level through comparing static and nonlinear dynamic analysis results, then initially we need to calculate the response of the structure with different levels by nonlinear dynamic analysis and then to make it dimensionless. Then, a height is assumed as the base level, and the mentioned structure is analyzed using the equivalent-static analysis and the results will be dimensionless. Now, both dimensionless results can be compared. If the difference between the calculated results is less than an acceptable amount, the resulted level can be introduced as the base level; otherwise, the process needs to be repeated with another height. Now the main point is making the results dimensionless gained from both analyses. To do so, results of a structure with similar stories and without different levels can be used. Suppose that the purpose is measuring the base level of a structure, shown in Figure d; initially the response of structures (Figures. a, 1-d) must be calculated using nonlinear dynamic analysis. The dimensionless response gained from the nonlinear dynamic analysis (D.R = Dynamically Ratio) is defined with the following equation:
D.R =
Result nonlinear dynamic analysis for a structure with different base levels
(2) Result nonlinear dynamic analysis for a structure
without different base levels and similar number of stories
a b c d e
Figure 1. Types of buildings
Then, the height H can be assumed as the base level for the structure with an unlevel foundation in order to find both the earthquake coefficient and structure’s static response. The C.R is defined as follows:
C.R =
Result static analysis for a structure with different base levels by Assumption the base level as H
(3) Result static analysis for a structure without different
base levels and similar number of stories
If the difference between C.R and D.R is acceptable, the assumed height H is considered as the base level; otherwise, the process needs to be repeated with another height.
2. 2. Comparison Criterion Since the first output of the equivalent-static method is the shear force at the stories, thus the most proper response for comparison is the shear force at the stories. Since the output of nonlinear dynamic analysis for shear force of stories is displayed as graph during the earthquake period, in this study, the absolute magnitude of the maximum shear caused by the earthquake in each story |Vmax| was used and compared separately. To do so, after
conducting nonlinear dynamic analysis for both structures, both shear and D.R are determined for the last story. Then by considering a height as the base level, the last story shear for both structures is calculated based on the equivalent-static analysis and the C.R is determined and compared with D.R. If the difference between them is considerable, the supposed base level is displaced until the values of D.R and C.R become similar. Accordingly, the base level is found through comparing the shear of the last story. The process is repeated for all stories above the ground surface and finally the average of values, the gained values, is introduced as the structure’s base level.
3. MODELING
In this section, we will deal with parameters and modeling hypothesis including the design condition and model analysis, soil properties and its failure criterion,
border condition, used accelerographs, meshing, etc. and finally a succinct explanation is provided about how modeling is conducted in ABAQUS software.
3. 1. Structural Models For making decision about base level location in different states, different groups of structures need to be examined. For studying the effect of number of stories of a building on the base level, model of 4, 6, 8, and 16-story buildings with plan area of 256 m2 (4 spans × 4 spans, with each span length 4 m) were used (Figure 2). The height of all stories was considered as the same (3m). In this case, the entrance columns leading to underground area and other variables for all models were considered constant.
Another variable that affects the base level location is the number of entrance columns leading to the underground area. Figure 3 shows analytical groups for analyzing the effect of number of entrance columns.
As it is seen, when the percentage of columns leading to the underground is decreased, the structure will become more irregular. According to the code, we are not allowed to use equivalent-static analysis and we need to use nonlinear dynamic analysis for irregular structures that have more than five stories [5, 6]. As the code suggests you can choose one of response-spectrum analysis and time-history analysis. Results of nonlinear dynamic analysis need to be reformed, when these methods are used and the base shear is required for reforming the results. On the other hand, according to the code, we need earthquake coefficient for choosing the proper design spectrum and/or the proper accelerogram.
Hence, in this study, irregular models were considered and the base level location was calculated in such models. All structures were of intermediate steel moment-resisting frames and foundations were of mat foundation, which were designed using ETABS and SAFE, respectively.
1291 V. R. Kalatjari et al. / IJE TRANSACTIONS C: Aspects Vol. 30, No. 9, (September 2017) 1288-1297
Group 1. 4-story buildings
Group 1. 40% of columns- buried Group 2. 6-story buildings
Group 2. 60% of columns-buried Group 3. 8-story buildings
Group 3. 80% of columns-buried Group 4. 16-story buildings
Figure 2. Collection of 4, 6, 8 and16-story buildings Figure 3. 60, 40 and 80% of columns are laid in the underground area
This model is used for a wide range of geotechnical engineering functions. Cap model is one of the best models to show behavior of soil; because the model is able to consider tension history, tension path and the average effective stress [7-9].
In this model, results of triaxial test are required for determining d and β. The failure models resulted from the test are depicted as points across the p-t plane and then the best line for these points is matched. The gradient of the line, β, and its intersection with t axis indicates parameter d. If C' and φ' (soil resisting parameters in Mohr-Coulomb failure criteria) are available, the following equations can be used.
6 sin
/ 3 s
tan in (4)
18 cos
/ 3 sin
d c (5)
Furthermore, for analyzing the stress-strain curve we need results of consolidation test with several loading-unloading cycles. The stress-strain curve is depicted in the average effective stress coordinate system is pb and
volumetric plastic strain coordinated with pb is (εvol 𝑝
). Volumetric plastic strain coordinated with pb is
measured using Equation (6).
0 0 0 0
ln ln
1 2.3 1
p c s
vol
C C
k p p
e p e p
(6)
where Cc and CS indicate compression and soil swelling,
respectively, e0 is the initial porosity of soil, p' is the
mean effective stress and p'0 is the initial mean effective
stress [10].
In this study, both stiff and soft soils were used. The properties of various types of soil were considered close to types I and IV defined by the code as far as possible [6]. Soil failure criterion was considered based on the reformed Drucker-Prager/cap model. Table 1 indicates properties of stiff soil (type I) and soft soil (type IV) for this study, respectively. The following equation is used for measuring shear modulus and soil elasticity modulus [11, 12].
2
2 1
S V E
g
G
TABLE 1. The propertiesof soil
Properties of soil Stiff soil Soft soil Properties of soil Stiff soil Soft soil
Thickness of layer (m) 30 30 Void ratio 0.42 0.65
Moisture content (%) 6 10 Poisson’s ratio 0.25 03
Dry unit weight (kN/m2) 22 16.5 Unit weight of soil (N/m3) 23320 18150
Shear wave velocity 650 150 Pa - (N/m2) 423954.26 255163.6
Longitudinal wave velocity 1027.74 241.86 Pb - (N/m2) 647647.49 365180
Friction angle (degree) 38 25 Cohesion (C) 40000 10000
Flow stress ratio (K) 1.00 1.00 Cap eccentricity (R) 0.25 0.35
Compression index (Cc) 0.08 0.14 Swelling index (Cs) 0.02 0.03
Transition surface radius (α) 0 0 Cohesion of Drucker–Prager (d) 237956.04 63595.01
At-rest earth pressure coefficient (K0) 0.36 0.55 Friction angle of Drucker–Prager (β) 57.16 44.53
Specific gravity of soil solids (Gs) 3.18 2.78 Initial cap yield surface position 0 0
pl vol
volpl 00
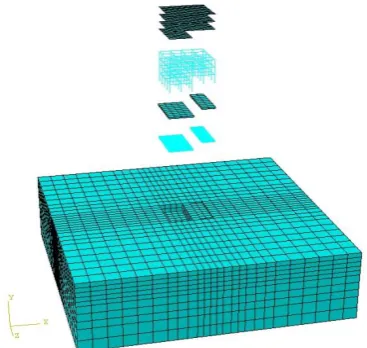
3. 3. Elements and Meshing The direct method was used for analyzing soil-structure interaction in which soil and structure were modeled in the software and analyzed using finite element method. In the finite element method, there is a reverse relationship between dimensions of elements and the precision of analysis. However, downsizing the elements will result in more nodes and more system's degrees of freedom. There is also a relationship between size of soil elements and waves that may affect them as well as their wavelength and frequency [13, 14]. It is obvious that when the distance from the origin is increased soil moves to infinity, not only the stress intensity is decreased, but also the sensitivity to the resulted quantities is decreased. Accordingly, at points near the surface, we see more stress which in turn degrades them quickly; whereas in the depth, the intensity is less and stress changes procedure become slower. Therefore, there is no need to suppose similar dimensions of soil elements in both depth and various distances from the structure. Elements dimensions, in the vertical direction, should not exceed λ/5 for earthquakes whose separation frequency is less than 20 Hz. Likewise, it is better to consider dimensions of elements, equal to the wave propagation direction, maximally λ/2 [15]. λ is the wavelength, which is determined using Equation (8).
00 /
V f
(8)
In Equation (8), f00 is the separation frequency of the
earthquake spectrum in question and V is the speed of shear wave. Accordingly, soil elements must be determined based on the certain designs. However, geometry can be effective, as well [14]. Therefore, it is suggested when stress needs to be considered, the relative dimensions of meshes (the largest dimension to
smallest dimension of each element) are confined to 3 and when strains need to be analyzed their relative dimensions is restricted to 10.
In this study, the soil general dimensions were supposed 100 × 100 × 30 m and the maximum dimensions of soil elements in both horizontal direction and 5 m depth were considered. The elements' dimensions were chosen so that to meet the mentioned restrictions as far as possible. Figure 4 shows that how soil is meshed.
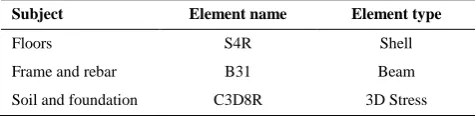
Components of frame and bars were modeled using beam elements. For frame components some elements as long as 1 m and for foundation bars some elements as long as 2 m for matching with the foundation mesh were used. The shell square elements, with the wing length of 1m, were used for modeling the floor.
1293 V. R. Kalatjari et al. / IJE TRANSACTIONS C: Aspects Vol. 30, No. 9, (September 2017) 1288-1297
Table 2 summarized the properties of elements used for the modeling.
3. 4. Soil Boundary Condition For depreciation
of a wave which reaches the bar end and to prevent its reflection, we need a damper at the end of the bar with the following attenuation factor [16]:
. s.
CV A (9)
A is the bar’s cross-section, ρ is its density and Vs is the
propagation speed of the shear wave across the bar. In this case, the spring’s fixed coefficient which has acted in parallel with the mentioned damper and absorbs the reflective waves will be calculated as follows:
/
kGA l (10)
where G is the shear module, A is the cone cross-section at the end and l is the height of cone [17].
In a 2-D case, waves go ahead through both shear and longitudinal motions. In this case, for absorbing waves it is possible to use two perpendicular dampers in boundaries [18].
The attenuation factors of these dampers are Cn in
the vertical direction and Ct in the tangential direction,
which are calculated using the following equations.
. .
n p A
C V (11)
. .
t s A
C V (12)
where Vp is the speed of longitudinal wave velocity and Vs is the shear wave velocity. The longitudinal wave
velocity can be measured with Equation (13).
/
p
V E (13)
In this study, the soil environment was divided into 10 × 10 m grids where in the corners spring and damper were placed perpendicularly. The spring and damper’s quantities are determined using the above-mentioned equations.
3. 5. Properties of the Materials The concrete used in this study was a C25 concrete (characteristic strength: 25 MPa) and the density of 2500 kg/m2, elasticity module of 26875 MPa and Poisson’s ratio of 0.16 were considered.
TABLE 2. Properties of the used elements
Subject Element name Element type
Floors S4R Shell
Frame and rebar B31 Beam
Soil and foundation C3D8R 3D Stress
To depict the stress-strain diagram of the concrete at the compression area we used the modified Hognestad equation and for the tensional area the diagram was considered linear [19, 20]. A36 steel with the density of 8000 kg/m2, elasticity module of 206010 MPa and the Poisson’s ratio of 0.3 was used in this study [21, 22].
3. 6. Accelerogram Properties According to
the seismic codes, in certain cases including irregular plans or non-uniform distribution of mass and rigidity in the building’s height, we need nonlinear dynamic analysis [5, 6]. Since the Iran Strong Motion Network (ISMN) has been established in 1973, today having access to data of earthquakes happened in different parts of the country is very difficult. In cases where there is no access to the accelerograph, the reasonable way is finding a place whose properties are similar to the physical condition of the region in question. In this way, you can take advantage directly of the registered accelerographs in those regions; however, finding such areas is practically difficult. Barring certain areas in the world that have proper registered accelerographs for other parts of the world you can use artificial accelerographs for conducting your analyses. Using artificial accelerographs will be important when you are supposed to use results of nonlinear dynamic analysis for designing a structure or to compare directly the results of dynamic and static analyses; however, since in this study the results of static and dynamic analyses are compared in the dimensionless form, thus both natural and artificial accelerographs can be used; with regard to the goals of the study and applying more precision for conducting the nonlinear dynamic analysis, artificial accelerographs were used. Since locations considered for examining the base level are based on properties of stiff and soft soils, for each region an accelerograph, proper with its properties, was used. SIMQUK software was used for producing accelerographs. Figures 5 and 6 indicate accelerographs compatible with regions of stiff and soft soil.
Figure 5. Accelerograph compatible with stiff soil
Figure 6. Accelerograph compatible with soft soil
The connection between bars and foundation is of embedded type and properties of the spring and dampers were determined according to the previous sections and introduced to the program in this stage.
4. NUMERICAL RESULTS
In this part we deal with the structural models, suggested locations for the base level in the various modes and the effect of various factors on the base level location. Initially models were analyzed on the stiff soil and then on the soft soil and then the results were compared. The current models are 4, 6, 8, and 16-story buildings; in the first phase, all above models, considering a condition in which 40% of columns were led to the underground area, both soils were analyzed and then the results were compared; in the next phases, the same models, considering a condition in which 60 and 80% of columns were led to the underground area, were analyzed.
4. 1. The Results of Constructing a Building on the Stiff Soil Figure 7 indicates that only the soil type can affect considerably the base level location and always when the soil gets stiffer, the base level gets closer to the ground surface. When the structure is located on the stiff soil, the base level location can change considerably under the influence of number of stories or number of entrance columns which are led to the underground area. When the structure is located on the stiff soil, the number of stories is increased (12 stories and more). At this condition, number of the entrance columns to the underground area and also number of stories do not affect the base level location and base level always is located near the ground surface (top level of underground). When a building is constructed on the stiff soil, the results gained from analyzing the models show that always increasing the
number of stories makes the base level closer to the ground surface (Figure 7). When a building has many stories (half tall buildings and tall buildings), the base level locates near the ground surface. For instance, for a 16-story building, in all three above-mentioned forms, the base level is located near the ground surface.
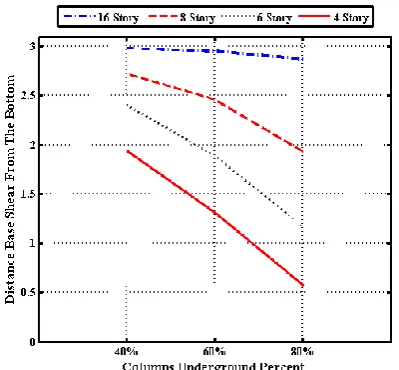
As Figure 7 shows, it can be concluded that with decreasing the percent of columns led to the underground, the effect of number of stories on the base level location is declined. For instance, when 80% of entrance columns of a building are led to the underground area, the base level will raise about 1.36 m
through increasing number of stories from 4 to 8 stories and will raise about 2.3 m through increasing number of stories from 4 to 16 stories; whereas when 40% of entrance columns of a building are led to the underground area, the base level will raise about 0.8 m
through increasing number of stories from 4 to 8 stories and will raise about 1 m through increasing number of stories from 4 to 16 stories. It shows that the less the underground columns, the less will be the base level displaced by the number of stories and vice versa. Therefore, a base level near the ground surface can be defined for the stiff soil, when the percent of columns led to the underground is less than 40%, without considering number of stories of a building.
Figure 8 shows on the stiff soil, for all models, with increasing the percentage of entrance columns led to the underground, always the base level gets closer to the down level of underground.
With increasing the number of stories of a building, the base level location will change less through changing the number of the entrance columns.
1295 V. R. Kalatjari et al. / IJE TRANSACTIONS C: Aspects Vol. 30, No. 9, (September 2017) 1288-1297
Figure 8. The effect of the entrance columns to the underground (stiff soil)
For example, in 4-stoey models, for various modes in which columns are led to the underground, the difference between the highest and lowest level is about 1.37 m; whereas for 8-stody models it will increase to 79 cm. Increasing the number of stories decreases this difference, as for a 16-story building, the difference is decreased to 10 cm. In fact, it can be said that for tall buildings and half tall buildings, which are constructed on the stiff soil, the entrance columns do not affect the base level location and in such buildings, the base level always is close to the ground surface (top level of underground); on the other hand, in conventional buildings, which are more common in our cities, the number of columns is somewhat more important and can displace the base level considerably.
4. 2. The Results of Constructing a Building on the Soft Soil Figure 9 indicates when the soil gets softer, the base level gets closer to the down level of underground. When the structure is located on the soft soil, the effect of soft soil will be so high that if the number of stories or even the number of entrance columns leading to the underground is changed, the base level location is not displaced and always is located near the down level of underground.
When the building is located on the soft soil, although the base level changes very small with the changes in the number of stories, increasing the number of stories makes the base level closer to the ground area. On the soft soil, the base level location displaces very rarely with changing the number of stories and it can be said that the base level location is somewhat independent from the number of the stories in a building (Figure 9). When a building is constructed on the soft soil, the base level location is not affected by the number of columns
Figure 9. The effect of number of stories of a building (soft soil)
Figure 10. The effect of the entrance columns to the underground (soft soil)
lead to the underground area, as when the percent of the columns is changed the base level does not displace considerably (see Figure 10).
5. CONCLUSION
Soil type has the highest effect on the base level location and always when the soil is stiff the base level location gets closer to the ground surface and when the soil is soft the base level is located near the down level of underground.
Hence, in locations with soft soil, it is suggested to measure the base level from the down level of underground.
When building is placed on stiff soil and number of stories is more than 12, the basic level always is located near the ceiling of the underground. Therefore, in the case of buildings with underground and much more stories which are located on stiff soil, it is recommended to calculate the basic level to the underground.
Always the base level location gets closer to the ground surface when the number of stories is increased. The change is completely tangible on the stiff soil; whereas for the soft soil by changing the number of stories, the base level displaces very little and it can be said that the base level is somehow independent from the number of the stories.
Always, on any type of soil, when the number of entrance columns led to the underground area is increased, the basic surface gets closer to the down level of underground. In the conventional buildings, which are more common in our cities, the number of columns is somewhat more important and can displace the base level considerably.
Over the stiff soil, the more the stories of a building, the less is changed the base level location through changing the number of entrance columns and vice versa. If the number of stories of a building is increased (half tall buildings and tall buildings), the base level, in all modes of entrance of columns into the underground, is located near the ground surface. The results show that changing the plan area does
not affect the base level location.
The less the columns of the underground, the less the base level will be displaced by changing the number of stories and vice versa.
The less the number of stories on the soft soil, the more dependent will be the base level location on the percent of columns. In 4-story and shorter buildings, the base level location can be estimated regarding the percent of entrance columns of the underground using the following equation:
HP = 100 - NP (14)
where HP is the distance between the base level and
the down level of underground in terms of a percent of the underground height and NP is the percent of
entrance columns into the underground.
6. REFERENCES
1. Mita, A. and Luco, J.E., "Dynamic response of embedded foundations: A hybrid approach", Computer Methods in Applied Mechanics and Engineering, Vol. 63, No. 3, (1987), 233-259.
2. Dutta, S.C. and Roy, R., "A critical review on idealization and modeling for interaction among soil–foundation–structure system", Computers & Structures, Vol. 80, No. 20, (2002), 1579-1594.
3. Gazetas, G., "Formulas and charts for impedances of surface and embedded foundations", Journal of Geotechnical Engineering, Vol. 117, No. 9, (1991), 1363-1381.
4. Elias, W.J. and Khouri, M.F., "Identifying the fixed base location of building structures under seismic excitation". 5. Code, U.B., "International conference of building officials",
Whittier, CA, (1997).
6. Code, I.S., "Iranian code of practice for seismic resistant design of buildings". (2005), Standard.
7. Tingjun, Y. and Linna, Z., "Finite element model of shape memory alloy incorporating drucker-prager model", Indonesian Journal of Electrical Engineering and Computer Science, Vol. 11, No. 7, (2013), 3915-3924.
8. Dolarevic, S. and Ibrahimbegovic, A., "A modified three-surface elasto-plastic cap model and its numerical implementation", Computers & Structures, Vol. 85, No. 7, (2007), 419-430. 9. Saberi, M., Behnamfar, F. and Vafaeian, M., "A continuum
shell-beam finite element modeling of buried pipes with 90-degree elbow subjected to earthquake excitations", International Journal of Engineering-Transactions C: Aspects, Vol. 28, No. 3, (2014), 338-345.
10. Helwany, S., "Applied soil mechanics with abaqus applications, John Wiley & Sons, (2007).
11. Das, B.M., "Advanced soil mechanics, CRC Press, (2013). 12. Jesmani, M., Oskoorouchi, A. and Papp Jr, W., "Effects of
degree of consolidation and anisotropic consolidation stresses on shear modulus and damping ratio of cohesive soils at low strain", International Journal of Engineering, Vol. 13, No. 1, (2000), 27-36.
13. Ching, J. and Phoon, K.-K., "Effect of element sizes in random field finite element simulations of soil shear strength", Computers & Structures, Vol. 126, (2013), 120-134.
14. Huang, J. and Griffiths, D., "Determining an appropriate finite element size for modelling the strength of undrained random soils", Computers and Geotechnics, Vol. 69, (2015), 506-513. 15. Nelson, R.B. and Muki, Y., "Boundary zone superposition
method for linear and nonlinear dynamic analysis of infinite domain problems", in Dynamic Response of Structures, ASCE., 732-744.
16. Moayyedian, M. and Shooshtari, A., "Proposed dynamic soil pressure diagram on rigid walls", International Journal of Engineering, Vol. 21, (2008).
17. Wolf, J. and Hall, W., "Soil-structure-interaction analysis in time domain, A Division of Simon & Schuster, (1988).
18. Lee, J.H. and Tassoulas, J.L., "Consistent transmitting boundary with continued-fraction absorbing boundary conditions for analysis of soil–structure interaction in a layered half-space", Computer Methods in Applied Mechanics and Engineering, Vol. 200, No. 13, (2011), 1509-1525.
19. Hognestad, E., "Study of combined bending and axial load in reinforced concrete members". (1951), University of Illinois at Urbana Champaign, College of Engineering. Engineering Experiment Station.
20. Nematzadeh, M., Salari, A., Ghadami, J. and Naghipour, M., "Stress-strain behavior of freshly compressed concrete under axial compression with a practical equation", Construction and Building Materials, Vol. 115, (2016), 402-423.
1297 V. R. Kalatjari et al. / IJE TRANSACTIONS C: Aspects Vol. 30, No. 9, (September 2017) 1288-1297
22. Fernandez, I., Bairan, J.M. and Marí, A.R., "3d fem model development from 3d optical measurement technique applied to
corroded steel bars", Construction and Building Materials, Vol. 124, (2016), 519-532.
Base Level Evaluation in Buildings with Different Foundation Levels by
Soil-foundation-structure Interaction
V. R. Kalatjaria, A. Naghizadeha, R. Naderia, M. H. Talebpourb
a Department of Civil Engineering, Shahrood University of Technology, Shahrood, Iran b School of Engineering, Damghan University, Damghan, Iran
P A P E R I N F O
Paper history: Received 04 March 2017
Received in revised form 06 May 2017 Accepted 07 July 2017
Keywords: Base Level
Soil-foundation-structure Interaction Different Foundation Levels Artificial Accelerogram
ديكچ ه
هزرل یورین نییعت رد ،رثؤم یاهرتماراپ هلمج زا هیاپ زارت ،دوش هدافتسا لداعم یکیتاتسا شور زا هزاس کی زیلانآ یارب هچنانچ یا
هزاس رد .دوب دهاوخ هزاس رب دراو یم ارجا حطس کی رد نویسادنوف اهنآ رد هک ییاه
هراوید نیب یشنکردنا هنوگچیه و دوش یاه
،درادن دوجو کاخ و هزاس نامتخاس زا یخرب رد اما ؛تسا نویسادنوف یور هیاپ زارت لحم تسا یهیدب
دوجو لیلد هب اه
یم ارجا توافتم زارت ود رد نویسادنوف ،هزاس زا یتمسق رد نیمزریز هدروآ دوجو هب یتاماهبا هیاپ زارت لحم نییعت یارب هک دوش
نییآ رد هکنآ هب هجوت اب .تسا همان
هزرل یاه د یداهنشیپ یا نیا ات هدش یعس هلاقم نیا رد ،تسا هدشن هئارا صوصخ نیا ر
لدم ،روظنم نیا یارب .دوش عفر تاماهبا هزاس یاه
مرن رد ،نآ فارطا کاخ طیحم و نویسادنوف هارمه هب یا رازفا
ABAQUS
نییآ حرط فیط رب قبطنم یعونصم تشاگن باتش کی تحت ،کاخ عون هب هجوت اب و هدش لدم همان
2800 رد .تسا هتفرگ رارق
کاخ عون ود زا قیقحت نیا
)
عون
I
و
IV
یم ناشن جیاتن .تسا هدش هدافتسا ) کاخ عون ریثأت تحت ًادیدش هیاپ زارت لحم هک دهد
وتس دادعت هب لاح نیع رد و دراد رارق ن
.تسا هتسباو زین هزاس تاقبط دادعت و نیمزریز هب یدورو یاه