A Monthly Double-Blind Peer Reviewed (Refereed/Juried) Open Access International e-Journal - Included in the International Serial Directories
Indexed & Listed at:
Ulrich's Periodicals Directory ©, ProQuest, U.S.A., EBSCO Publishing, U.S.A., Cabell’s Directories of Publishing Opportunities, U.S.A., Google Scholar, Open J-Gage, India [link of the same is duly available at Inflibnet of University Grants Commission (U.G.C.)],
Index Copernicus Publishers Panel, Poland with IC Value of 5.09 & number of libraries all around the world.
VOLUME NO. 6 (2016), ISSUE NO. 10 (OCTOBER) ISSN2231-5756
CONTENTS
Sr.
No.
TITLE & NAME OF THE AUTHOR (S)
Page
No.
1.
A STUDY ON THE JOB SATISFACTION OF THE EMPLOYEES OF BPO SECTOR
V. SAVITHA & DR. E. VIJILA
1
2.
A PRODUCTIVE ANALYSIS OF REGIONAL INEQUALITY IN AGRICULTURAL DEVELOPMENT: STUDY OF
HARYANA INTER-DISTRICT EMPIRIC
DR. INDERJIT
5
3.
THE STUDY OF KEY SUCCESS FACTORS IN NEW PRODUCT DEVELOPMENT PROCESS IN TEXTILE
INDUSTRY WITH SPECIAL REFERENCE TO SURAT REGION
RASHVIN TAILOR & DR. MANISHA PANWALA
9
4.
AN EMPIRICAL STUDY ON MARKETING INFORMATION SYSTEM
DEEPAK S & DR. S. J. MANJUNATH
12
5.
MOMPRENEURSHIP: A NEW TREND OF ENTREPRENEURSHIP
B. N. LALITHCHANDRA & T. LAVANYA KUMARI
16
6.
RELATIONSHIP BETWEEN JOB SATISFACTION AND OTHER PSYCHOSOCIAL VARIABLES: A
COMPARATIVE STUDY OF MALE AND FEMALE EMPLOYEES OF BUSINESS PROCESSING OUTSOURCING
(BPO) SECTOR
PRIYANKAR SINGHA & DR. SOUVIK RAYCHAUDHURI
20
7.
YOGA AND MEDICAL SCIENCE
PRADEEP H. TAWADE
24
8.
A STUDY ON AN ANALYSIS OF SHORT-TERM LIQUIDITY POSITION OF TATA STEEL LIMITED
R. SATHISHKUMAR
26
9.
RULES AND VALUES OF CO-OPERATIVE BANKS
DR. SAKSHI TEWARI
30
10.
CUSTOMERS BUYING BEHAVIOUR IN ASHOK LEYLAND, CHENNAI
DR. R. AMUDHA & K. SRILAKSHMI
34
11.
IMPACT OF ENGLISH INVASION ON INDIAN CULTURE
SANGEETHA. J
39
12.
BEST PRACTICES FOR ENHANCING USE OF LIBRARY COLLECTION AND OTHER LIBRARY SERVICES
AJIT VASANTRAO JANUGADE
41
13.
ENTREPRENEURSHIP DEVELOPMENT EFFORTS AND THE CHALLENGE OF QUALITY EDUCATION AND
HUMAN RESOURCE DEVELOPMENT IN NIGERIA
DR. S.O. ONIMOLE
44
14.
FACTORS INFLUENCING THE DECISION OF ADOPTING COMPUTERIZED ACCOUNTING SYSTEM (CAS)
BY SMALL AND MEDIUM ENTERPRISES (SMEs) IN KURUNEGALA URBAN AREA IN SRI LANKA
PATHMINI MGS & KARUNADASA MKGPSK
49
15.
ASSESSMENT OF CUSTOMERS’ ATTITUDE AND BANKS’ GROWTH TOWARDS E- BANKING IN NIGERIA
FAITH ERINMA ONYEBUENYI
55
16.
IMPLEMENTATION MECHANISM OF MGNREGA IN HIMACHAL PRADESH
KHEM RAJ
60
17.
EFFECTS OF FDI IN RETAIL SECTOR IN INDIA
NAZEEFA BEGUM MAKANDAR
67
18.
AN ANALYSIS OF SERVQUAL AND SERVPERF IN INDIAN BANKING CONTEXT
SUDESHNA DUTTA
72
19.
EFFECT OF MOBILE PHONES ON HUMAN BODY
SUNIL KUMAR TRIVEDI
78
20.
SELF EFFICACY AND OTHER PERSONAL RESOURCES AS ANTECEDENTS OF EMPLOYEE ENGAGEMENT:
A CRITICAL LITERATURE REVIEW
HARSH VARDHAN KOTHARI
82
CHIEF PATRON
PROF. K. K. AGGARWAL
Chairman, Malaviya National Institute of Technology, Jaipur
(An institute of National Importance & fully funded by Ministry of Human Resource Development, Government of India)
Chancellor, K. R. Mangalam University, Gurgaon
Chancellor, Lingaya’s University, Faridabad
Founder Vice-Chancellor (1998-2008), Guru Gobind Singh Indraprastha University, Delhi
Ex. Pro Vice-Chancellor, Guru Jambheshwar University, Hisar
FOUNDER PATRON
LATE SH. RAM BHAJAN AGGARWAL
Former State Minister for Home & Tourism, Government of Haryana
Former Vice-President, Dadri Education Society, Charkhi Dadri
Former President, Chinar Syntex Ltd. (Textile Mills), Bhiwani
FORMER CO-ORDINATOR
DR. S. GARG
Faculty, Shree Ram Institute of Business & Management, Urjani
ADVISORS
PROF. M. S. SENAM RAJU
Director A. C. D., School of Management Studies, I.G.N.O.U., New Delhi
PROF. M. N. SHARMA
Chairman, M.B.A., Haryana College of Technology & Management, Kaithal
PROF. S. L. MAHANDRU
Principal (Retd.), Maharaja Agrasen College, Jagadhri
EDITOR
PROF. R. K. SHARMA
Professor, Bharti Vidyapeeth University Institute of Management & Research, New Delhi
CO-EDITOR
DR. BHAVET
Faculty, Shree Ram Institute of Engineering & Technology, Urjani
EDITORIAL ADVISORY BOARD
DR. RAJESH MODI
Faculty, Yanbu Industrial College, Kingdom of Saudi Arabia
PROF. SANJIV MITTAL
University School of Management Studies, Guru Gobind Singh I. P. University, Delhi
PROF. ANIL K. SAINI
Chairperson (CRC), Guru Gobind Singh I. P. University, Delhi
DR. SAMBHAVNA
VOLUME NO. 6 (2016), ISSUE NO. 10 (OCTOBER) ISSN2231-5756
DR. MOHENDER KUMAR GUPTA
Associate Professor, P. J. L. N. Government College, Faridabad
DR. SHIVAKUMAR DEENE
Asst. Professor, Dept. of Commerce, School of Business Studies, Central University of Karnataka, Gulbarga
ASSOCIATE EDITORS
PROF. NAWAB ALI KHAN
Department of Commerce, Aligarh Muslim University, Aligarh, U.P.
PROF. ABHAY BANSAL
Head, Department of I.T., Amity School of Engineering & Technology, Amity University, Noida
PROF. A. SURYANARAYANA
Department of Business Management, Osmania University, Hyderabad
PROF. V. SELVAM
SSL, VIT University, Vellore
DR. PARDEEP AHLAWAT
Associate Professor, Institute of Management Studies & Research, Maharshi Dayanand University, Rohtak
DR. S. TABASSUM SULTANA
Associate Professor, Department of Business Management, Matrusri Institute of P.G. Studies, Hyderabad
SURJEET SINGH
Asst. Professor, Department of Computer Science, G. M. N. (P.G.) College, Ambala Cantt.
FORMER TECHNICAL ADVISOR
AMITA
Faculty, Government M. S., Mohali
FINANCIAL ADVISORS
DICKIN GOYAL
Advocate & Tax Adviser, Panchkula
NEENA
Investment Consultant, Chambaghat, Solan, Himachal Pradesh
LEGAL ADVISORS
JITENDER S. CHAHAL
Advocate, Punjab & Haryana High Court, Chandigarh U.T.
CHANDER BHUSHAN SHARMA
Advocate & Consultant, District Courts, Yamunanagar at Jagadhri
SUPERINTENDENT
CALL FOR MANUSCRIPTS
We invite unpublished novel, original, empirical and high quality research work pertaining to the recent developments & practices in the areas of Com-puter Science & Applications; Commerce; Business; Finance; Marketing; Human Resource Management; General Management; Banking; Economics; Tourism Administration & Management; Education; Law; Library & Information Science; Defence & Strategic Studies; Electronic Science; Corporate Gov-ernance; Industrial Relations; and emerging paradigms in allied subjects like Accounting; Accounting Information Systems; Accounting Theory & Practice; Auditing; Behavioral Accounting; Behavioral Economics; Corporate Finance; Cost Accounting; Econometrics; Economic Development; Economic History; Financial Institutions & Markets; Financial Services; Fiscal Policy; Government & Non Profit Accounting; Industrial Organization; International Economics & Trade; International Finance; Macro Economics; Micro Economics; Rural Economics; Co-operation; Demography: Development Planning; Development Studies; Applied Economics; Development Economics; Business Economics; Monetary Policy; Public Policy Economics; Real Estate; Regional Economics; Political Science; Continuing Education; Labour Welfare; Philosophy; Psychology; Sociology; Tax Accounting; Advertising & Promotion Management; Management Information Systems (MIS); Business Law; Public Responsibility & Ethics; Communication; Direct Marketing; E-Commerce; Global Business; Health Care Administration; Labour Relations & Human Resource Management; Marketing Research; Marketing Theory & Applications; Non-Profit Or-ganizations; Office Administration/Management; Operations Research/Statistics; Organizational Behavior & Theory; Organizational Development; Pro-duction/Operations; International Relations; Human Rights & Duties; Public Administration; Population Studies; Purchasing/Materials Management; Re-tailing; Sales/Selling; Services; Small Business Entrepreneurship; Strategic Management Policy; Technology/Innovation; Tourism & Hospitality; Transpor-tation Distribution; Algorithms; Artificial Intelligence; Compilers & Translation; Computer Aided Design (CAD); Computer Aided Manufacturing; Computer Graphics; Computer Organization & Architecture; Database Structures & Systems; Discrete Structures; Internet; Management Information Systems; Mod-eling & Simulation; Neural Systems/Neural Networks; Numerical Analysis/Scientific Computing; Object Oriented Programming; Operating Systems; Pro-gramming Languages; Robotics; Symbolic & Formal Logic; Web Design and emerging paradigms in allied subjects.
Anybody can submit the soft copy of unpublished novel; original; empirical and high quality research work/manuscript anytime in M.S. Word format after preparing the same as per our GUIDELINES FOR SUBMISSION; at our email address i.e. [email protected] or online by clicking the link online
submission as given on our website (FOR ONLINE SUBMISSION, CLICK HERE).
GUIDELINES FOR SUBMISSION OF MANUSCRIPT
1. COVERING LETTER FOR SUBMISSION:
DATED: _____________
THE EDITOR
IJRCM
Subject: SUBMISSION OF MANUSCRIPT IN THE AREA OF .
(e.g. Finance/Mkt./HRM/General Mgt./Engineering/Economics/Computer/IT/ Education/Psychology/Law/Math/other, please specify)
DEAR SIR/MADAM
Please find my submission of manuscript titled ‘___________________________________________’ for likely publication in one of your journals.
I hereby affirm that the contents of this manuscript are original. Furthermore, it has neither been published anywhere in any language fully or partly, nor it is under review for publication elsewhere.
I affirm that all the co-authors of this manuscript have seen the submitted version of the manuscript and have agreed to inclusion of their names as co-authors.
Also, if my/our manuscript is accepted, I agree to comply with the formalities as given on the website of the journal. The Journal has discretion to publish our contribution in any of its journals.
NAME OF CORRESPONDING AUTHOR :
Designation/Post* :
Institution/College/University with full address & Pin Code :
Residential address with Pin Code :
Mobile Number (s) with country ISD code :
Is WhatsApp or Viber active on your above noted Mobile Number (Yes/No) :
Landline Number (s) with country ISD code :
E-mail Address :
Alternate E-mail Address :
Nationality :
VOLUME NO. 6 (2016), ISSUE NO. 10 (OCTOBER) ISSN2231-5756
NOTES:
a) The whole manuscript has to be in ONE MS WORD FILE only, which will start from the covering letter, inside the manuscript. pdf.
version is liable to be rejected without any consideration.
b) The sender is required to mention the following in the SUBJECT COLUMN of the mail:
New Manuscript for Review in the area of (e.g. Finance/Marketing/HRM/General Mgt./Engineering/Economics/Computer/IT/
Education/Psychology/Law/Math/other, please specify)
c) There is no need to give any text in the body of the mail, except the cases where the author wishes to give any specific message
w.r.t. to the manuscript.
d) The total size of the file containing the manuscript is expected to be below 1000 KB.
e) Only the Abstract will not be considered for review and the author is required to submit the complete manuscript in the first
instance.
f) The journal gives acknowledgement w.r.t. the receipt of every email within twenty-four hours and in case of non-receipt of
acknowledgment from the journal, w.r.t. the submission of the manuscript, within two days of its submission, the corresponding author is required to demand for the same by sending a separate mail to the journal.
g) The author (s) name or details should not appear anywhere on the body of the manuscript, except on the covering letter and the
cover page of the manuscript, in the manner as mentioned in the guidelines.
2. MANUSCRIPT TITLE: The title of the paper should be typed in bold letters, centered and fully capitalised.
3. AUTHOR NAME (S) & AFFILIATIONS: Author (s) name, designation, affiliation (s), address, mobile/landline number (s), and email/al-ternate email address should be given underneath the title.
4. ACKNOWLEDGMENTS: Acknowledgements can be given to reviewers, guides, funding institutions, etc., if any.
5. ABSTRACT: Abstract should be in fully Italic printing, ranging between 150 to 300 words. The abstract must be informative and
eluci-dating the background, aims, methods, results & conclusion in a SINGLE PARA. Abbreviations must be mentioned in full.
6. KEYWORDS: Abstract must be followed by a list of keywords, subject to the maximum of five. These should be arranged in alphabetic
order separated by commas and full stop at the end. All words of the keywords, including the first one should be in small letters, except special words e.g. name of the Countries, abbreviations etc.
7. JEL CODE: Provide the appropriate Journal of Economic Literature Classification System code (s). JEL codes are available at
www.aea-web.org/econlit/jelCodes.php. However, mentioning of JEL Code is not mandatory.
8. MANUSCRIPT: Manuscript must be in BRITISH ENGLISH prepared on a standard A4 size PORTRAIT SETTING PAPER. It should be free
from any errors i.e. grammatical, spelling or punctuation. It must be thoroughly edited at your end.
9. HEADINGS: All the headings must be bold-faced, aligned left and fully capitalised. Leave a blank line before each heading.
10. SUB-HEADINGS: All the sub-headings must be bold-faced, aligned left and fully capitalised.
11. MAIN TEXT:
THE MAIN TEXT SHOULD FOLLOW THE FOLLOWING SEQUENCE:
INTRODUCTION REVIEW OF LITERATURE
NEED/IMPORTANCE OF THE STUDY STATEMENT OF THE PROBLEM OBJECTIVES
HYPOTHESIS (ES)
RESEARCH METHODOLOGY RESULTS & DISCUSSION FINDINGS
RECOMMENDATIONS/SUGGESTIONS CONCLUSIONS
LIMITATIONS
SCOPE FOR FURTHER RESEARCH REFERENCES
APPENDIX/ANNEXURE
12. FIGURES & TABLES: These should be simple, crystal CLEAR, centered, separately numbered & self-explained, and the titles must be above the table/figure. Sources of data should be mentioned below the table/figure. It should be ensured that the tables/figures are
referred to from the main text.
13. EQUATIONS/FORMULAE: These should be consecutively numbered in parenthesis, left aligned with equation/formulae number placed
at the right. The equation editor provided with standard versions of Microsoft Word may be utilised. If any other equation editor is utilised, author must confirm that these equations may be viewed and edited in versions of Microsoft Office that does not have the editor.
14. ACRONYMS: These should not be used in the abstract. The use of acronyms is elsewhere is acceptable. Acronyms should be defined
on its first use in each section e.g. Reserve Bank of India (RBI). Acronyms should be redefined on first use in subsequent sections.
15. REFERENCES: The list of all references should be alphabetically arranged. The author (s) should mention only the actually utilised
references in the preparation of manuscript and they may follow Harvard Style of Referencing. Also check to ensure that everything
that you are including in the reference section is duly cited in the paper. The author (s) are supposed to follow the references as per
the following:
All works cited in the text (including sources for tables and figures) should be listed alphabetically.
Use (ed.) for one editor, and (ed.s) for multiple editors.
When listing two or more works by one author, use --- (20xx), such as after Kohl (1997), use --- (2001), etc., in chronologically ascending order.
Indicate (opening and closing) page numbers for articles in journals and for chapters in books.
The title of books and journals should be in italic printing. Double quotation marks are used for titles of journal articles, book chapters, dissertations, reports, working papers, unpublished material, etc.
For titles in a language other than English, provide an English translation in parenthesis.
Headers, footers, endnotes and footnotes should not be used in the document. However, you can mention short notes to elucidate
some specific point, which may be placed in number orders before the references.
PLEASE USE THE FOLLOWING FOR STYLE AND PUNCTUATION IN REFERENCES: BOOKS
Bowersox, Donald J., Closs, David J., (1996), "Logistical Management." Tata McGraw, Hill, New Delhi.
Hunker, H.L. and A.J. Wright (1963), "Factors of Industrial Location in Ohio" Ohio State University, Nigeria.
CONTRIBUTIONS TO BOOKS
Sharma T., Kwatra, G. (2008) Effectiveness of Social Advertising: A Study of Selected Campaigns, Corporate Social Responsibility, Edited by David Crowther & Nicholas Capaldi, Ashgate Research Companion to Corporate Social Responsibility, Chapter 15, pp 287-303.
JOURNAL AND OTHER ARTICLES
Schemenner, R.W., Huber, J.C. and Cook, R.L. (1987), "Geographic Differences and the Location of New Manufacturing Facilities," Jour-nal of Urban Economics, Vol. 21, No. 1, pp. 83-104.
CONFERENCE PAPERS
Garg, Sambhav (2011): "Business Ethics" Paper presented at the Annual International Conference for the All India Management Asso-ciation, New Delhi, India, 19–23
UNPUBLISHED DISSERTATIONS
Kumar S. (2011): "Customer Value: A Comparative Study of Rural and Urban Customers," Thesis, Kurukshetra University, Kurukshetra.
ONLINE RESOURCES
Always indicate the date that the source was accessed, as online resources are frequently updated or removed.
WEBSITES
VOLUME NO. 6 (2016), ISSUE NO. 10 (OCTOBER) ISSN2231-5756
A STUDY ON THE JOB SATISFACTION OF THE EMPLOYEES OF BPO SECTOR
V. SAVITHA
HEAD
DEPARTMENT OF BUSINESS ADMINISTRATION
BISHOP APPASAMY COLLEGE OF ARTS & SCIENCE
COIMBATORE
DR. E. VIJILA
DIRECTOR
KCT BUSINESS SCHOOL
KUMARAGURU COLLEGE OF TECHNOLOGY
COIMBATORE
ABSTRACT
Job Satisfaction represents one of the most complex areas facing today’s managers when it comes to managing their employees. The aim of the present study is to identify the Job Satisfaction factors related to employees of BPO sector. The target population for this study consists of non-voice BPO professionals from BPO organizations. The present study used a questionnaire to identify the level of Job Satisfaction among the BPO employees, investigating the relationship between three main categories namely occupation, lifestyle and life events. The first category assesses occupational stress and investigates the level of satisfaction, with diverse aspects of work. The second category concerns stress related to lifestyle and evaluated topics such as satisfaction with social life, family life and living environment. The third category of questions assesses life events. The result of factor analysis on job satisfaction factors related to employees in the BPO sector identified eight factors through the results of extraction of factors. The factors dimensions identified are as facilities at Work Place, Freedom and inter personal relationship, Financial and Non-financial benefits, Work Flexibility and Security, Nature of Job, Workplace Ambience, Professional Development and Work Tools and Promotion. In order to improve the job satisfaction of employees it is important to create a friendly environment in the work place, take initiative to give feedback of work to employees, pay scale and promotion may be revised and changed, according to the years of experience gained and telecommuters can work from home (teleworking), and employees in different locations and on different schedules can work together as ‘virtual teams’.
KEYWORDS
job satisfaction, telecommuters, business process outsourcing, employee satisfaction.
INTRODUCTION
he Policy of economic liberalization in 1991 made urban India a major hub of various foreign industries. Within a short span of time India became a major hub of Information Technology services (IT) and communication technologies under the mushrooming of globalization. Business Process Outsourcing has emerged as India’s new sunshine sector and the country is now one of the prominent electronic housekeepers to the world, taking care of a host of routine activities for multinational firms. The boom in BPO activities has prompted policy planners to view this sector as one of the potential avenues to absorb the growing mass of educated unemployed (Mahapatra and Jena, 2012). Companies that work in knowledge based environment with competitions, customer-gaining, respon-sibilities and varieties should compete on creative and responsible human resource as a competitive tool, because satisfied and full-energy personnel are the most important source of organization (Morad, et al., 2012).
Job Satisfaction represents one of the most complex areas facing today’s managers when it comes to managing their employees. There is a considerable impact of the employee’s perceptions for the nature of his work and the level of overall job satisfaction. Financial compensation has a great impact on the overall job satisfaction of employees (Aziri, 2011). Job Satisfaction is a critical issue for every organization because satisfied employees are reportedly known good perfor-mance and vice versa (Abdul and Khan, 2012). The key to job satisfaction is, in fact, in the fit between the objective conditions of the job and the workers expec-tations. The better the fit between expectations and job reality, the greater the satisfaction and vice versa (Rafael and Enrique, 2005).
REVIEW OF LITERATURE
Employee satisfaction has become an important corporate objective in recent years. The issue of employee satisfaction needs in depth study in service organiza-tions like BPO companies in India wherein not much research work has been done in this regard despite an alarmingly high rate of employee attrition (Dinesh and Prabhash, 2007). Research results by Aamodt (2007), indicates that satisfied employees tend to be committed to an organization and employees who are satisfied and committed are more likely to attend work, stay with an organization, arrive at work on time, perform well and engage in behaviors helpful to the organization. Meyer and Allen (1991), in an exploratory and confirmatory analysis of factors that can significantly predict Job Satisfaction and Organizational Commitment among blue collar workers, reported that Promotion, Satisfaction, Job Characteristics, Extrinsic and Intrinsic exchange, as well as extrinsic and intrinsic rewards, were related to Commitment. Job satisfaction is a very important attribute which is frequently measured by organizations. Salary was found to be the prime factor for motivation and job satisfaction of salaried employees of the automobile industry (Preeti and Kavia, 2012). The results showed that compensation was ranked as the number one element for job satisfaction. It was discovered that management & friendly staff relationships contribute to the level of job satisfaction (Ra-jeswari and Devika, 2015). The present study investigates the reason behind employee satisfaction and the reviews discussed justify the reason of the BPO em-ployee’s satisfaction on the job.
OBJECTIVE OF THE STUDY
To identify Job Satisfaction factors related to employees of BPO sector.
HYPOTHESIS OF THE STUDY
There is significant difference in the job satisfaction factors influencing employees of BPO industry.
POPULATION OF THE STUDY
The target population for this study consist of non-voice BPO professionals from BPO organizations of Coimbatore.
SAMPLING FRAME
In the first-stage, simple random sampling was used to select 17 BPOs out of 53 available BPOs in Coimbatore region. In the second stage, for the sampling purpose, employee list was obtained from the human resource department from each of the 17 BPOs and from the consolidated list list of 7600 employees, 430 employees
are selected through simple random sampling which is about 5% of the total employee strength out of 7600 employees. The sample comprises of both genders with varied background and occupational characteristics.
METHODOLOGY
The instrument used for this study is a questionnaire. Job Satisfaction were measured with 35 variables taken from psychological stress dimensions questionnaire (Lynne, et. al, 1999), grouped under constructs namely Satisfaction with work schedule, Satisfaction in work, Satisfaction with level of responsibility, Satisfaction with level of support, Job context and Physical work environment, with an response on 4 point scale. The present study used this questionnaire to identify the level of Job Satisfaction among the BPO employees, investigating the relationship between three main categories namely occupation, lifestyle and life events. The first category assesses occupational stress and investigates the level of satisfaction, with diverse aspects of work. The second category concerns stress related to lifestyle and evaluated topics such as satisfaction with social life, family life and living environment. The third category of questions assesses life events.
ANALYSIS OF JOB SATISFACTION VARIABLES
To identify the job satisfaction factors influencing employees of BPO Industry, factor analysis was done. The hypothesis developed is that there is significant difference in the job satisfaction factors influencing employees of BPO industry. In order to have a better understanding about job satisfaction, Factor analysis is used to group the different experience of the employees and make it easier to understand. Factor analysis is not only an important tool to identify the important factors, but also to reduce the factors. In this study, Factor analysis is employed using extraction method of principle component analysis under Varimax with Kaiser Normalization method to find the factor loadings and the number of components or groups is identified with Eigen value more than one. Further, based on Eigen the factors are grouped. There are thirty-five statements considered to identify the reflection of job satisfaction among BPO employees. These thirty-five statements are classified into eight components or groups because their Eigen values are more than one (6.70, 3.59, 2.98, 2.58, 2.17, 2.08, 1.95 and 1.53). The table below describes the results of Factor Analysis in terms of Factor loading for the various statements relating to job satisfaction and their groups.
The result of Factor Analysis is discussed below:
TEST OF KMO AND BARTLETT’S TEST OF SPHERICITY
The use of KMO and Bartlett’s test of sphericity is primarily essential to measure sample adequacy for using Factor Analysis.
TABLE 1: KMO AND BARTLETT’S TEST
Kaiser-Meyer-Olkin Measure of sample adequacy 0.86 Bartlett’s test of Sphericity Approx. Chi-square 9777.04
DF 595.00
Sig 0.00
Table 1 provides the details of KMO analysis. The KMO score is greater than 0.6 which suggests that the data is adequate for factor analysis.
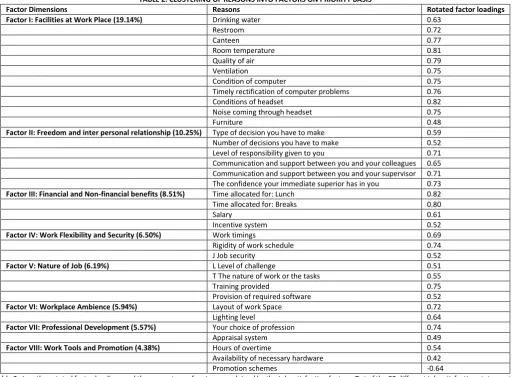
TABLE 2: CLUSTERING OF REASONS INTO FACTORS ON PRIORITY BASIS
Factor Dimensions Reasons Rotated factor loadings Factor I: Facilities at Work Place (19.14%) Drinking water 0.63
Restroom 0.72
Canteen 0.77
Room temperature 0.81
Quality of air 0.79
Ventilation 0.75
Condition of computer 0.75
Timely rectification of computer problems 0.76
Conditions of headset 0.82
Noise coming through headset 0.75
Furniture 0.48
Factor II: Freedom and inter personal relationship (10.25%) Type of decision you have to make 0.59 Number of decisions you have to make 0.52 Level of responsibility given to you 0.71 Communication and support between you and your colleagues 0.65 Communication and support between you and your supervisor 0.71 The confidence your immediate superior has in you 0.73
Factor III: Financial and Non-financial benefits (8.51%) Time allocated for: Lunch 0.82
Time allocated for: Breaks 0.80
Salary 0.61
Incentive system 0.52
Factor IV: Work Flexibility and Security (6.50%) Work timings 0.69
Rigidity of work schedule 0.74
J Job security 0.52
Factor V: Nature of Job (6.19%) L Level of challenge 0.51 T The nature of work or the tasks 0.55
Training provided 0.75
Provision of required software 0.52
Factor VI: Workplace Ambience (5.94%) Layout of work Space 0.72
Lighting level 0.64
Factor VII: Professional Development (5.57%) Your choice of profession 0.74
Appraisal system 0.49
Factor VIII: Work Tools and Promotion (4.38%) Hours of overtime 0.54 Availability of necessary hardware 0.42
Promotion schemes -0.64
VOLUME NO. 6 (2016), ISSUE NO. 10 (OCTOBER) ISSN2231-5756
methods of the initial factor matrix to attain simple structure of the data. The varimax rotation is one such method to obtain better results for interpretation and the results are given in 50.
Using factor analysis, the job satisfaction statements were reduced to 8 factors. The results of extraction of factor are summarized in Tables 4.23. 11 statements were grouped together as factor I and accounts to 19.14% of the total variance. 6 statements constituted factor II and accounts 10.25% of the total variance. 4 statements constituted factor III and accounts 8.51% of the total variance. 3 statements were grouped together as factor IV and accounts 6.50% of the total variance. 5 statements constituted factor V and accounts 6.19 % of the total variance. 2 statements constituted factor VI and accounts 5.94 % of the total variance. 2 statements were grouped together as factor VII and accounts 5.57 % of the total variance. 3 statements constituted factor VIII and accounts 4.38 % of the total variance. Thus the factor analysis condensed and simplified the 35 statements and grouped into 8 factors explaining 67.3 % of the variability of all the 35 statements of job satisfaction.
The factor dimensions identified are as below:
FACTOR I: FACILITIES AT WORK PLACE
The employees are satisfied with the provision of facilities provided in the work place. Factors such as drinking water facilities, restroom, canteen, room temper-ature, quality of air, ventilation, condition of computer, timely rectification of computer problems, condition of headset, noise coming through headset and furni-ture are grouped as Factor I. Employees provided with the above facilities tend to show response in a positive way, indicating good level of motivation.
FACTOR II: FREEDOM AND INTER PERSONAL RELATIONSHIP
Freedom and interpersonal relationship among employees give a sense of satisfaction and relieves from work pressure. Factors that are identified under group II are type of decision an employee need to take, number of decisions taken and level of responsibility given. Employees satisfied with these factors will be committed to work showing reduced effect on turn over intention.
FACTOR III: FINANCIAL AND NON-FINANCIAL BENEFITS
Factor III includes time allotted for lunch and breaks, salary and incentive, related to the personal nature or temperament of the employee. Many a time, employees leave organizations because of certain personal reasons that they don’t divulge. The unfriendly attitude of the organizations in giving extended working hours to the employees for an extremely long period pressurizing the employees to meet targets within stipulated time and low salary package irritates the employees and is responsible for job dissatisfaction. In a study by Hai et al., (2008) to evaluate the influence of pay increase on job satisfaction in the Chinese military, it was found that pay is an important factor affecting overall satisfaction. BPO workers in India also need greater flexibility in their work than they currently have.
FACTOR IV: WORK FLEXIBILITY AND SECURITY
The factors grouped under this category are work timings, rigidity of work schedule and job security. One of the most important factors responsible for job dissatisfaction in BPOs is the obscurity of career path. Poor work timings and job insecurity is an important factor clubbed here.
FACTOR V: NATURE OF JOB
Level of challenge, nature of work or tasks, training provided and provision of required software are clubbed as nature of job factor. The nature of job being challenging makes employees feel free from boredom. The employees trained by organizations will show improvement on job performance. Availability of required software is a must for BPO employees to carry out their task. The employees will feel motivated and will get a sense of belonging to the organization. Hence, all the factors are grouped as one factor.
FACTOR VI: WORKPLACE AMBIENCE
Layout of work space and lighting level are grouped as workplace ambience factor. In the findings of Lumley, et al., (2011), who states that employees value certain conditions of work, and that if these conditions are evident and congruent with the individual’s own needs, employees will be more satisfied and committed and less likely to leave the organization. Hence this study gives importance to workplace ambience to support and believe that the employees work for the betterment of the organization.
FACTOR VII: PROFESSIONAL DEVELOPMENT
Choice of profession and appraisal system is clubbed as professional development factor. An employee’s aspirations and career goals can receive careful attention during performance appraisal meetings. Without inquiring into an employee’s personal life, a supervisor can nevertheless explore ways to enhance the compati-bility between the worker’s commitment of organization and the employee’s other life commitments. Through such means, the organization personalizes its relationship to each employee and provides support, while also expressing appreciation for their contributions. To further engage employees and win their com-mitment through performance management programs, to have overall professional development, considerations must be shown to treat organization’s employ-ees.
FACTOR VIII: WORK TOOLS AND PROMOTION
Hours of overtime, availability of necessary hardware and promotion schemes are considered as work tools and promotion factor. The related attitude of job satisfaction of the employees to show effective response on job performance is the option of promotion at workplace. Employees overburdened and provided with inefficient hardware facilities will show negative response in the workplace indicating job dissatisfaction among them. Organizations concentrating on the above said factors are sure to create an environment friendly situation.
The result of factor analysis on job satisfaction factors related to employees in the BPO sector identified eight factors through the results of extraction of factors. The factors dimensions identified are as facilities at Work Place, Freedom and inter personal relationship, Financial and Non-financial benefits, Work Flexibility and Security, Nature of Job, Workplace Ambience, Professional Development and Work Tools and Promotion. Hence, it can be concluded that there is significant difference in the job satisfaction factors influencing BPO employees.
SUGGESTION
Creating friendly environment in the work place will enable employees to have greater satisfaction. Managers must take initiative to give feedback of work to employees. Breaks and refreshments in between working hours will make the employees to feel refreshed and thereby help to reduce eye strain, neck ache and head ache to avoid stress. Pay scale and promotion may be revised and changed, according to the years of experience gained, to make the employees satisfied on the job. As income has a direct effect on the turnover intention of the employees, organizations must identify the employee needs to make them continue on the job.
Organizations must adhere to facilities like drinking water, restroom, canteen, maintenance of proper room temperature, quality of air, ventilation, conditions of computer, timely rectification of computer problems, condition of headset, proper headsets and furniture. Employees tend to show response in a positive way, indicating good level of motivation to organizations attending to the above requirements. Creating freedom of interpersonal relationship inside the organization will give sense of satisfaction among employees and will relieve them from work pressure. Employees satisfied with these factors will be committed to work, showing reduced effect on turnover intention. Many a time, employees leave organizations because of certain personal reasons that they don’t divulge. This can be curbed by a friendly attitude of the organizations by providing flexibility of working hours, proper breaks within working hours, not pressurizing the employees to meet targets within stipulated time and by providing a good salary package. The low cost and portability of computers, together with the ubiquitous availability of the internet, will enable employees to work away from a designated place. Telecommuters can work from home (teleworking), and employees in different locations and on different schedules can work together as ‘virtual teams’. This will enable organizations to satisfy the employees. Self-managing work teams require a clear and engaging direction, performance goals, demographic and skill diversity, an optimum size, stable membership, group rewards, as well as coaching style of leadership and easy access to informational material and training resources.
CONCLUSION
from boredom by providing training programs to show improvement on job performance. Availability of required software is a must for BPO employees to carry out their task. The employees will feel motivated and will get a sense of belonging to the organization by the provision of such direct requirements on the job.
REFERENCES
1. Aamodt, M.G. (2007). Industrial/Organisational Psychology: An Applied Approach, Wadsworth Cengage Learning, Belmont, California, United States. 2. Abdul Sattar, Allah Nawaz and Shadiullah Khan, (2012). The Contextual Impacts on Job Satisfaction of Employees in the Developing States like Pakistan,
Universal Journal of Education and General Studies, Vol. 1(5), may, pp. 136-145.
3. Aziri, B., (2011). Job Satisfaction: A Literature Review, Management Research and Practice, Vol. 3, Issue. 4, pp. 77-86.
4. Dinesh, G., and Prabhash, T., (2007). India: An Attractive BPO Destination Marred by Alarming Attrition- Insights into the Causes, Impact and Mitigation Actions, Global Service Delivery Advisory Services, 2.
5. Hai, Y., Danmin, M., Xia, Z., Yunfeng, S., Xufeng, Liu., and Shengjun, Wu., (2008). The Influence of a Pay Increase on Job Satisfaction: A Study with the Chinese Army, Social Behavior and Personality, 36(10), Society for Personality Research (Inc.), 1333-1340.
6. Lumley, E.J., Coetzee, M., Tladinyane, R., and Ferreira, N., (2011). Exploring the Job Satisfaction and Organizational Commitment of Employees in the Infor-mation Technology Environment, South African Business Review, Vol. 15, No. 1, p. 114.
7. Mahapatra, S. and Jena, K. (2012). BPO: World: An Analysis of the Emergence of BPO Industry in India, Research Journal of Management Scienc-es, Vol. 1(3), October, P. 25-29.
8. Meyer J.P., and Allen N.J., (1991). A three-component Conceptualization of Organizational Commitment, Human Resource Management Review, 1, 61-89. 9. Morad, R. D., Mehrdad, G. C., and Roghayeh, B., (2012). Relationship between Job Satisfaction and Employee Job Performance in Guilan Public Sector, Journal
of Basic Applied Scientific Research, 2(2), P. 1735-1741.
10. Preeti, R., and Kavia, D., (2012). The Role of Employee’s Satisfaction on the Progress of Service Industries, International Journal of Information Technology and Knowledge Management, July – December, 5(2), 474-476.
11. Rafael, M. de, B. L., and Enrique, F. M., (2005). Job Satisfaction as an Indicator of the Quality of Work, The Journal of Socio-Economics, 34, p. 656-673. 12. Rajeswari, C., and Devika, S., (2015). Employees Job Satisfaction: The Backbone of Every Organization Advances in Economics and Business Man-agement
VOLUME NO. 6 (2016), ISSUE NO. 10 (OCTOBER) ISSN2231-5756
A PRODUCTIVE ANALYSIS OF REGIONAL INEQUALITY IN AGRICULTURAL DEVELOPMENT: STUDY OF
HARYANA INTER-DISTRICT EMPIRIC
DR. INDERJIT
PRINCIPAL
GOVERNMENT COLLEGE OF WOMEN
REWARI
ABSTRACT
Agriculture is the most important sector of Indian economy, the pace of economic growth and wellbeing of general masses are still significantly influenced by the pace of agricultural development. But, like other sectors of Indian economy agricultural development is also marred by huge regional inequalities. Inequality in agriculture is not only present in between states but inequality is also a matter of serious concern with in state. Haryana which is considered as ‘Super-Power’ in terms of agricultural development is also not an exception of above mentioned trends. Present study attempts to reveals the present scenario of agricultural development in Haryana; while attempting to study the trends of regional disparities in one of most agriculturally developed state of India in selected time periods, study also test the applicability of certain developmental hypotheses in the case of agricultural development of Haryana. This paper has been divided into three different but cohesive sections. Section I deals with the issues and literature related to regional inequalities. Section II focuses on core characteristics of study-area and methodology of the present study. And the last section briefly analyse the levels of agricultural development of Haryana over three specific time periods (i.e. 1990-92, 2000-2002 and 2007-09) by employing deprivation index.
KEYWORDS
agricultural development, deprivation index, ranking method, triennial averages, convergence and divergence of development.
INTRODUCTION
evelopment is a process of changing and aiming the socio-economic transformation of a traditional society into a modern society. The concept of devel-opment has been interpreted in many ways by Politicians, economists, planners and researchers depending on their perception and objectives. But all of them agree with the idea that development means improvement in the standard of living of people (World Bank, 1975). World over, different economies drive their economic growth and development through different sectors. Some economies are dependent on agriculture, while some are known as industrial economies and some are knowledge based economies. And all these economies have the supreme goal of economic growth, development and general equity in society. But as many researchers and economists (i.e. Myrdal (1957); Hirschman (1961), have proved many times that development is not a location neutral phenomenon, it tends to differ from one location to other in its intensity and in its characteristics. Owning to some historical, natural, economical, geographical and even because of political factors development tends to ‘Diverge’ at least in the initial stages in all the countries.
Inequalities in development have always remained the core issue in all development related studies. Studies by Myrdal (1957), Hirschman (1961), and many others have proved that development do not take place with the same intensity on all the locations. And in development due to ‘Backwash Effect’ all economic activities tend to concentrate at some points and leading to the formulation of development of ‘Growth Foci’. Although this trend gets reversed once ‘Spread effect’ get starts in long run. In counties like India, where the process of development is relatively new or has just began divergence of inequalities are more evident. This shows that, in the initial stages of development regional inequalities in various sectors of economy will be on the high (Kumar, 2009).
In Indian case, inequalities in the levels of development between different regions have been an integral feature of the history of economic development. Uneven development is quite evident in all the sectors of the economy where co-existence of developed and backward regions has led to dichotomous situation. Questions regarding the regional disparities are not new in development related literature and it has been recognised in policy papers and in implementation. The approach paper of 11th five-year plan adopted in 2006, forcefully articulates the urgency in the ‘Convergence of Development’ as:
“The strategy of inclusive growth proposed in this paper can command broad based support only if growth is seen to demonstrably bridge divides and avoid exclusion or marginalisation of large segments of our population. These divides manifest themselves in various forms between the have and have-nots; between rural and urban areas; between the employed and under-employed; between different states, districts and communities and finally between genders.”1
The discussion related to regional disparities in development came into lime light after the publication of Kuznets (1955) study. This study presented a diagram-matic representation of relationship between development and inequalities by what is known today as ‘Kuznets Curve’ (Figure 1). This curve relates economic development with regional inequalities predicting that during the initial stages of development, inequalities in all the sectors will increase, which is also confirmed by Indian development history. In development related studies this curve is also known as ‘Invert U Curve’ (Dubey, 2009).
When it comes to agricultural sector of Indian economy which provides 17.5 % of GDP and 60-70% direct and indirect employment to Indian masses is also not an exception to regional inequalities. In agriculture sector also disparities in and among states is alarmingly high. Many studies (i.e. Dubey, 2009; Kumar, 2009; Kumar, 2009a) have highlighted that as regional disparities are prevalent in agricultural development also as they are present in other sectors of Indian economy. In case of Haryana, which is agriculturally most developed state of India, is also marred by severe inequalities in development especially in terms of agricultural develop-ment. Present paper is an attempt to assess how agricultural disparities in Haryana have behaved over selected time period (i.e. 1990-92, 2000-2002 and 2007-09). This study is also throws light on how regional disparities have moved with the implementation of new economic reforms and thereafter.
FIGURE 1: KUZNETS CURVE
Source: Dubey (2009)
HYPOTHESES RELATED TO DISPARITIES IN DEVELOPMENT
Given the long history of economic planning, awareness related to regional disparities was very high among researchers. During process of development the forces of convergence and divergence act together and the ultimate result depends on the relative strength of these opposite forces (Swanin et al., 2009). The conver-gence forces are cherished as spread (Myrdal, 1957) and trickling down (Hirschman, 1961) effects of development efforts that help reducing disparities. The divergence factors that widen regional disparity are termed as backwash (Myrdal, 1958) and Polarisation effects (Hirschman, 1961). A close scrutiny of existing literature on regional disparity reveals that there are at least three different hypotheses with differing emphasis given to the relative importance over time of the forces of convergence and of divergence.
Huges (1961) proposed that the forces of divergence dominate over those of convergence and as a result, inter-regional differences in the levels of economic development keep on widening over time. In second view, Hanna (1959) viewed that the rate of economic growth is inversely related to the level of per captia income and hence given identical technologies, preferences and rate of population growth, difference in per captia incomes between any two regions will be short-lived. Third hypothesis, which can be seen as the optimal combination of above two was given by Williamson (1963) pointed out that inter-regional dispari-ties, diverge initially to converge later on and thus, trace out the famous ‘Kuznetsian Invert U Curve’ over time in the process of national economic development (Nair, 2003).
In the light of above hypotheses, the study attempts to analyse the process of regional disparities in the levels of agricultural development in Haryana over a specific time period covering reform and post-liberalisation period. Study attempts to examine whether disparities are converging or diverging under market forces.
REVIEW OF LITERATURE
Since the problem of regional manifestation of development of an economy is not new, interest in the thoughts and patterns of regional disparities are also not new. The general idea about the process of development and its relation with disparities was given by Thunen (1826), Webber (1909) and Losh (1940) through their various location models. But, the real theory formation concerning regional disparities started by the works of Myrdal (1957) and Hirschman (1961) as they gave ‘Spread effect and Backwash effect’ and ‘Trickling down of Polarisation effects’ respectively.
In studies concerning India and Indian states, pioneering work has been done by M.N Pal (1968), Kundu (1980), and many others. Their work has sown and proved that how regional disparities behave under different socio-economic conditions of different states. In terms of disparities in agricultural development of India earliest work is of Sharma (1958) who did pioneering work in identifying levels of agricultural development by using general survey from 1947-1957. Apart from him Mathur (1983); Manjit and Mitra (1996); Dasgupta et al. (1997); Ghose et al. (1998); Mukherjee (2004); Ruksana (2009) have also highlighted the issues related to regional disparities in various sectors of Indian economy.
The review of literature reveals that regional disparities are very important in development studies and can provide deep insight for future course of development. Present study is an attempt to identify regional disparities in agricultural of Haryana over selected time period so that regional harmonious development can be achieved which is also over developmental goal.
CONCEPT OF AGRICULTURAL DEVELOPMENT
In last few decades there have been numerous studies on agricultural development all over the county in various academic disciplines. But most studies skip any pin-pointed definition of agricultural development. Nath (1960), Bhalla and Tyagi (1989) all of them have equated agricultural development with productivity of agriculture. Raza (1978) took most comprehensive view of agricultural development by recognising four dimensions i.e. Productivity, Production conditions, Agrar-ian relations and Agricultural change. Many others (i.e. Krishan, 1980) believe that agricultural development may be envisaged as the agricultural performance of an area in terms of economic gains of yield, social justice it delivers. For a common frame of references in present study agricultural development connotes ‘qualitative and quantitative’ upward shift in the performance of agriculture and leading to general well-being among farming community. For analysing these qualitative and quantitative changes over time, 10 Indicators of agricultural development have been selected for analysis.
OBJECTIVES OF THE STUDY
Main objectives of present study are:
1. To test various development hypotheses in case of agricultural development in Haryana. 2. To measure the extent of regional disparities in agricultural development of Haryana. 3. To explain how agricultural disparities have behaved over time.
4. To explain that how regional disparities have behaved under market force after liberalisation of Indian economy.
DATABASE AND METHODOLOGY
STUDY AREA
Haryana with its favourable climatic and topographical characteristics is agriculturally most developed state of India. Haryana lies between 27° 39̕ and 30° 55̕ North latitude and 74° 27̕ and 77° 36̕ East longitude, with a geographical area of 44212 Sq Km. Given the rich fertile soil, proper irrigation facilities and location near a huge market are primary factors that have led to well-developed agriculture in Haryana. Agriculture plays an important role in socio-economic development of the state. Statistics reveals that around 80% of states geographical area is under cultivation Haryana occupies prominent place among the top producers of wheat, rice and other agricultural products. Soon after the formation of Haryana in 1966, government of Haryana gave emphasis on the development of agriculture and as a result Haryana has achieved pioneering position in India especially in terms of agricultural development. But, as most hypotheses accept this development was not equal for all the districts with in Haryana. There is marked difference between the districts of northern Haryana and southern districts of Haryana. Apart from marked difference in physical climate north and southern districts of Haryana also differs in terms of agricultural development. Districts of north Haryana are technologically highly developed and are more market oriented. Whereas southern districts are still poorly equipped with technology and are still backward in compression of other districts of Haryana (Kumar, 2009). Moreover, after adaptation of New Economic Policies of liberalisation in 1991, Haryana’s economy is exposed to new and diverse challenges from market forces. Therefore, in present study regional disparities in agriculture are studied to bring out regional mani-festation of development under market forces.
METHOD
Present study is based on secondary data collected from varied data sources. Statistical Abstract of Haryana for various years, issued by Department of Economics and Statistical Analysis, Government of Haryana has served as chief data source. As development is not a single entity, it is a multi-dimensional phenomenon which is combined effect of many things. In present study agricultural development is assessed by taking into account of 10 development indicators which are directly related to input or output part of agriculture. The levels of agricultural development have been derived by composite Development Index2 of all variables and
mathematically Development index can be written as:
(Actual Xij Value) – (Minimum Xij value) Zij =
(Maximum Xij value) – (Minimum Xij value)
Here,
VOLUME NO. 6 (2016), ISSUE NO. 10 (OCTOBER) ISSN2231-5756
The value of the index ranges from 0 to 1. Best performing district would get ‘1’ and worse would get the index value of ‘0’. Moreover, for measuring the magnitude of regional imbalances in the case of agricultural development across the districts has been calculated by using Coefficient of Variation. To depict district wise agricultural development composite agricultural development has been constructed by using following ten indicators.
X1 Percentage of area under HYV seeds to gross cropped area;
X2 Consumption of fertilizers (Kgs/Hectares);
X3 Consumption of Pesticides (kgs/Hectare);
X4 Percentage of gross irrigated area under gross cropped area;
X5 Number of tractors to per hectare of gross cropped area;
X6 Average size of land holding;
X7 Percentage of Gross Cropped Area Under Commercial crops to total cropped area;
X8 Per hectare gross value of agricultural output in rupees (base year price);
X 9 Percentage of area sown more than once to net area sown;
X10 Intensity of Cropping;
Agriculture is a highly dynamic phenomenon; it tends to vary year after year based on climate and many other factors. And in order to tap changing nature of agriculture, three years’ triennial average has been taken for analysis. Furthermore, for presenting data tables and diagrams have been used and for showing spatial pattern of agricultural development is shown through various choropleth maps.
This paper has been divided into three different but cohesive sections. Section I deals with the issues and literature related to regional disparities. Section II focuses on core characteristics of study-area and methodology of the present study. And the last section briefly analyse the levels of agricultural development of Haryana over three specific time periods (i.e. 1990-92, 2000-2002 and 2007-09)
RESULTS AND DISCUSSIONS
After employing deprivation index on selected indicators to obtained composite agricultural development index for all the districts; it is evident (table 1) that there exists huge inter-regional as well as inter-district disparities in agricultural development of Haryana. The calculated value of composite indices reveals significant inter-district variations in the levels of development for 1990-92 the value of Coefficient of variation (in %) which was 66.66 % but after the implementation of new economic policies the regional disparities in agricultural development have narrowed down significantly (Coefficient of variation 45.45%). Interestingly con-trary to developmental hypotheses disparities started diverging again here for 2007-09, Coefficient of variation stands at 63.82%.
In 1990-92, only 2 districts were under highly developed category those were Karnal and Kurukshetra; medium developed category constitutes 7 districts (around 43.75%) and most of districts of this category are from northern Haryana. But, under low and very low developed categories, interestingly districts of southern and central Haryana falls. This north-south division is a by product of green revolution which started in northern Haryana, and failed to percolate in southern parts (Bishnoi et al., 2008)
For 2000-02, picture was still almost the same here also districts of northern Haryana constitutes high and medium developed category, whereas southern and central districts occupy low and very low category (Map. 2). But in the index for 2007-09, agricultural development has shown a relatively different picture. In 2007-09, index developed category is still occupied by northern districts of Kaithal, Karnal, Panipat and Kurukshetra; but under medium category some new districts have occupied new places which were earlier by Jind and Faridabad; moreover, in this index surprisingly Ambala has slipped to very low category (Map. 3). Index for 2007-09, shows that now with the passage of time agricultural development is trickling down to backward districts of southern Haryana but with snail pace. After through study of spatial spread of regional disparities in agricultural development, this can be easily concluded that core area for the agricultural development lies in northern districts, whereas southern districts are still lagging behind. Study of related literature shows that this north-south divide of Haryana is partly because of two prime causes. One is the green revolution and other is irrigation facilities. It is well known fact that northern districts of Haryana have served as the focal point for the green revolution and primarily because the initial push from green revolution districts like Karnal, Panipat, Kurukshetra, Kaithal has higher awareness about modern technology and as a result agricultural development is relatively higher here. Secondly the intensity of irrigation facility in north is high. And in states like Haryana with semi-arid climate irrigation facilities holds the key for prosperity. And at the same time spread of technological know-how in technological poor districts of southern Haryana is key to alter the developmental focus from north to southern districts of Haryana
KEY FINDINGS
On the bases of above analyse following key findings can be concluded:
1. The notion that regional disparities decrease with the development is wrong, in the case of agricultural development of Haryana. It seems, as if regional disparities converge or diverge owning to many other factors, other than SIMPLY time taken in development.
2. In terms of agricultural development there is a clear north south division exists. Where northern districts are way ahead as compare to their southern counterparts.
3. It seems as, Green revolution and irrigation facilities are to chief responsive factors in inequalities in agricultural development.
CONCLUSION
TABLE 1: HARYANA: AGRICULTURAL DEVELOPMENT INDEX (ADI)
Districts 1990-92 2000-02 2007-09 Ambala 0.56 0.36 0.24 Bhiwani 0.20 0.00 0.14 Faridabad 0.48 0.48 0.58 Fatehabad ** 0.62 0.53 Gurgaon 0.30 0.39 0.25
Hisar 0.48 0.55 0.34
Jhajjar ** 0.40 0.00
Jind 0.50 0.50 0.57
Kaithal 0.55 0.58 0.79 Karnal 1.00 1.00 1.00 Kurukshetra 0.82 0.70 0.97 Mahendergarh 0.34 0.31 0.23 Panchkula ** 0.45 0.41 Panipat 0.60 0.68 0.94 Rewari 0.32 0.31 0.26 Rohtak 0.00 0.35 0.19
Sirsa 0.56 0.51 0.49
Sonipat 0.52 0.60 0.68 Yamunanagar 0.60 0.58 0.74
Mean 0.48 0.44 0.49
S.D. 0.32 0.20 0.30
C.V. (In %) 66.66 45.45 60.96
Source: Data is calculated by researcher from Statistical Abstract of Haryana for various years, issued by Department of Economics and Statistical Analysis, Gov-ernment of Haryana.
Note: **Districts were not in existence.
NOTE
1. Towards Faster and more Inclusive growth: An approach to the Eleventh Five-year plan, Planning Commission, Government of India, 2006, Chapter 5. 2. There are numerous methods for calculating a composite index i.e. summation of ranks, division of mean and so on. The method for calculating the composite
index for development by summing the ranks of various indicators has been quite popular among research scholars. The ranking method has two major drawbacks. Firstly, it does not consider the magnitude of difference in values of indicators. Secondly, in this method all the indicators are given equal weights. Analysis based on such considerations may be limited use. Therefore, in present study Development Index is used. (Which is widely used in Human Development Index (HDI).
REFERENCES
1. Bishnoi, N. K, and Aneja, R. (2008): “Regional Variations of Socio-Economic Development in Haryana: A District Level Analysis”, Indian Journal of Regional Science, Vol. XXXX, No. 2, PP. 26-40.
2. Chakraborty, A. (2009): “Some Normative Relevant Aspects of Inter-State and Intra-State Disparities”, Economic and Political Weekly, Vol. XLIV, Nos. 26 & 27, PP. 179-184.
3. Dubey, A. (2009): “Intra-State Disparities in Gujarat, Haryana, Kerala, Orissa and Punjab”, Economic and Political Weekly, Vol. XLIV, Nos. 26 & 27, PP. 224-230.
4. Hanna, F.A. (1959): State Income Differentials, 1919-1954, Durham: Duke University Press. 5. Hirschman, A.O. (1961): The Strategy of Economic Development, New Haven, Yale University Press.
6. Hughes, R. B. (1961): “Inter-regional Income Differences self-Perpetuation”, Southern Economic Journal, Vol. 28, No. 1, PP. 41-45.
7. Kumar, S. (2009a): “Inter-Regional and Inter-District Disparities in Agricultural Development: A Study of Uttar Pradesh”, Indian Journal of Regional Science, Vol. XXXXI, No. 1, PP. 22-36.
8. Kumar, Vinod (2009): “Levels of Agricultural Development in Haryana: A Geographical Perspectives”, Unpublished Dissertation, Submitted to Maharshi Dayanand University.
9. Kumari, P. (2008): “Dilemmas of Development in Haryana”, IASSI Quarterly, Vol. 27, Nos. 1 & 2, PP. 49-74.
10. Mathur, A (1983): “Regional Development and Income disparities in India: A sectoral Analysis”, Economic Development and Cultural Change, Vol. 31, No. 2, PP. 475-505.
11. Nair, K.R.G. (2004): Economic Reforms and Regional Disparities in Economic and Social Development in India, Report of Research Project, SER division of Planning Commission.
12. Nayak, L.T. and Narayankar, D.S. (2009): “Identification of Regional Disparities in Levels of Development in Bellary District- Karnataka”, Indian Journal of Regional Science, Vol. XXXXI, No. 1, PP. 37-47.
13. Rukhsana (2009): “Regional Imbalances in the Dimensions of Rural Development”, Indian Journal of Regional Science, Vol. XXXXI, No. 2, PP. 135-148. 14. Sharma, A. (1958): “Regional Disparities in Agricultural Development in Madhya Pradesh”, Indian Journal of Regional Sciences, Vol. 15, No 2, pp. 55-60. 15. Swain, M., Mrutyunjay Swain, and D. K. Das (2009): “Regional Disparity in Agricultural Development in Orissa in the pre and post-reform period”, Social
Change, Vol. 39, No. 2, PP.193-215.
VOLUME NO. 6 (2016), ISSUE NO. 10 (OCTOBER) ISSN2231-5756
THE STUDY OF KEY SUCCESS FACTORS IN NEW PRODUCT DEVELOPMENT PROCESS IN TEXTILE INDUSTRY
WITH SPECIAL REFERENCE TO SURAT REGION
RASHVIN TAILOR
ASST. PROFESSOR
DEPARTMENT OF MANAGEMENT
UKA TARSAIDA UNIVERSITY
BARDOLI
DR. MANISHA PANWALA
PROFESSOR
DEPARTMENT OF BUSINESS & INDUSTRY MANAGEMENT
VEER NARMAD SOUTH GUJARAT UNIVERSITY
SURAT
ABSTRACT
The idea of key success factors in new product development is dynamic to many organizations’ persistence of business and growth is widely recognized. New products provide many business opportunities for organizations. The importance of key success factors in new product development is key, as corporate purpose and scope sets the guidelines for new product planning. This paper explores the importance of keys success factor of new product development process in the textile organization of Surat. The research findings highlighted the importance of key success factors during Idea generation and concept development stage of new product development phase.
KEYWORDS
new product development, textile industry, key success factors.
INTRODUCTION
he importance of the new products remain to be of key to all organizations. Tough global competition, short product and technology lifecycles, spontaneous consumer buying patterns and possible market immobility makes new product development an important activity in most businesses. New products pro-vide organizations with growth prospects that permit them to highlight their market position. Strategic planning identifies opportunities for new product development and sets new product planning guidelines. Creating the right organizational culture that can encourage innovation is one of the primary tasks for management. Developing successful new products requires systematic planning and integration of various organizational cross-functional activities. Without a clear roadmap from management it is challenging to select the right innovation strategy. Management’s involvement in the new product development process is directly or indirectly responsible for a new product’s success rate in the market.
LITERATURE REVIEW
The literature recommends that the success rate of new products depends on numerous factors, including the technological factors, marketing factors, commercial factors, and managerial factors. The successful new product development requires an involvement from marketing, sales, design, research and development, finance, manufacturing, technical and legal functions. To ensure the continuing interaction among all these functions, it is critical to maintain a continuous flow of communication through one central information point in the organization.
Jifeng Mu et.al. study is to fill the gap by examining the key success factors of NPD in Chinese SMEs. Diverse from the old approach regarding the success factors
in each stage of NPD as standardized, the key success factors in each stage of the NPD process are examined from a managerial perspective. This paper finds Chinese SMEs do not regard financial return as the primary criterion in the idea-generation stage. Although the key success factors are relatively quite different in various stages, technological, marketing, commercial, and managerial factors are important across all stages.
Isidre March-Chorda`et.al, Rapid product development has been treated as a competitive strategy in a global market environment. It is essential to improve the
product development process with the objective of reducing product development cycle time and hence to reach the market as quickly as possible. The main objective of this research is to identify the major determinants that confront the product development. The cost of product development projects that discourages commitment to new product development and the uncertainty of the market acceptance were found to be the major factors. According to the study reported in this paper, the fulfillment of the key success factors as suggested by the literature is, in general, low.
Xueli Huang et.al. This article examines the new product development process (NPDP) in Australian small and medium-sized enterprises (SMEs). Findings from a
sample of 276 innovative Australian SMEs suggest that marketing-related activities were undertaken less frequently and were less well executed than technical activities in developing new products.
Holger Ernst continuous development and market introduction of new products can be an important determinant of sustained company performance. B.C. Ghosh et.al. The research tries to determine the strategy dynamics and key success factors (KSFs) for excellence in performance of the so-called “tiger” SMEs
in Singapore. In 1995 and 1996, 50 top privately owned and successful enterprises in Singapore were identified. They have shown that they can excel, even in the current highly competitive and high operation cost environment. Their performance can be attributed to their dynamism and a few KSFs that are apparently universal to these successful companies.
Karl T. Ulrich et.al. This paper is a review of research in product development, which defines as the transformation of a market opportunity into a product available
for sale. Review is broad, encompassing work in the academic fields of marketing, operations management, and engineering design. The value of this breadth is in conveying the shape of the entire research landscape. We focus on product development projects within a single firm. Research devotes our attention to the development of physical goods, although much of the work we describe applies to products of all kinds.
Wonseok Choi et.al. Review the nature of new product development and explore diverse NPD processes. Also discussed Introduction of NPD process models and
strategies of companies and products in the textile apparel industry.
Jerry Soldatos, Jurate Hardy studied the new product development process in Australian Grocery organizations and their research highlighted the importance of
top managements support during new product development phases
RESEARCH METHODOLOGY
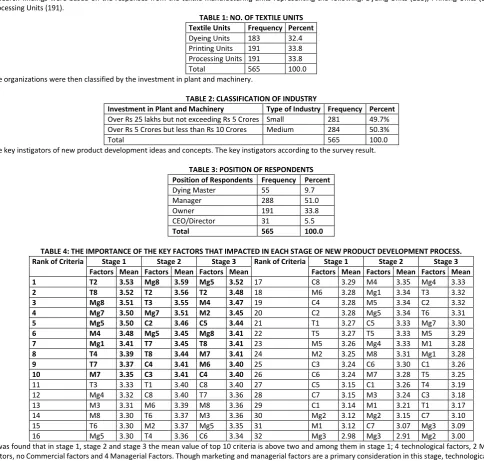
The research study involved complete survey of 600 Textiles units who are engaged in dyeing, processing and printing. The list of these organizations was obtained from the South Gujarat Processors Association, Surat and the Federation of Surat Textile Traders Association Surat. The questionnaire was distributed to these
organizations and 565 responses were received. The questionnaire consisted of four 4 success factors and 8 criteria in each that covered a wide range of issues in the new product development field.
OBJECTIVES OF THE STUDY
1. To examine new product development process in Textile Manufacturing Unit in Surat Region.
2. To examines importance of key success factors in each stage of new product development process from managerial perspective.
DATA ANALYSIS AND DISCUSSION
Research findings were based on the responses from the textile manufacturing units representing the following: Dyeing Units (