ADSORPTION OF p-NITROPHENOL IN THREE
DIFFERENT ACTIVATED CARBONS AT
DIFFERENT pH
S. Nouri
*Chemistry Department, College of Science, Urmia University, Urmia 57135-165, Islamic Republic of Iran
Abstract
Adsorption of p-Nitrophenol by three different activated carbons (F100, S.E.I.
and B.D.H.) was carried out at 301 K and at controlled pH conditions. Two
different adsorption models (Langmuir model and Freundlich model) were studied
and compared. The adsorption capacity of the carbons depends on the Point of
Zero Charge (PZC) and surface area of the carbons. Adsorption of the solute at
higher pH was found to be dependent on the concentration of anionic form of the
solutes. The isotherm data were fitted to the Langmuir and Freundlich isotherm
equations to obtain the relative parameters.
Keywords: Effects of pH; Adsorption capacity; Activated carbon; p-Nitrophenol;
Spectrophotometer
* E-mail: [email protected] 1. Introduction
Increasing environmental awareness in the recent times has led to more stringent limits on the quality of water and wastewater. Organic compounds constitute a very large group of pollutants. Many of them are recognized carcinogens and are known to be toxic to the environment. Among the available methods for removing these pollutants, adsorption is still one of the most preferred methods. Activated carbons are carbonaceous materials of highly developed porous structure and high specific surface area. Properties of activated carbon such as their surface area, microporous structure and surface chemistry can be tailored, making them versatile materials for a range of separation
applications [1,2]. These applications include the removal of contaminants from water and gas streams, and as catalyst supports [1].
In liquid phase adsorption, it is established that the adsorption capacity of an activated carbon depends on the following factors. Firstly, it is the nature of the adsorbent such as its pore structure, ash content and functional groups. Secondly, the nature of the adsorbate (e.g., its pKa, functional group present, polarity,
In this work the adsorption behaviour of p-Nitrophenol on the three different activated carbons and in their molecular and ionic form was investigated. All experimental data were then fitted into the Freundlich and Langmuir isotherm Equations to obtain the corresponding parameters. The variation of adsorption capacity and the adsorption affinity of the carbons with pH are observed.
Using the Freundlich [q = K.(Ce)1/n] and Langmuir Homogenous Equations: eq l eq eq C Q Q K q C ⎟⎟ ⎠ ⎞ ⎜⎜ ⎝ ⎛ + ⎟⎟ ⎠ ⎞ ⎜⎜ ⎝ ⎛ = max max 1 1
we obtained the relative parameters for each carbon and observed its variation in different pH.
2. Experimental
The granular activated carbons (GAC) used in this work are S.E.I. and F100 from Calgon and B.D.H. Prior to the experiments, the samples were ground and sieved. The fraction between 400-800 µm, of each sample was used. Chemicals used were as follows: p-Nitrophenol (PNP) (99.9% purity) from Merck Chemicals, HCl and NaOH (A. R. Grade)-Ajax Chemicals.
The adsorption experiments were carried out by placing 45 mg of the activated carbon with 50 ml of the solution containing different concentrations of the adsorbates (10, 20,…60, and 80, 100, 120,…250 ppm). Solution pH was adjusted by using dilute solution of NaOH or HCl (0.1 mol/l). All solutions were then left in a temperature controlled shaking bath for 4 days at 301 K to reach equilibrium (this time is found after doing a series of experiments in different days to obtain stable isotherm). After reaching equilibrium conditions, the residue concentrations of the solutes, after filtration, were measured spectrophotometrically (between 260 & 275 nm), using Jasco-V550 spectrophotometer.
The pH(PZC) of the carbons was determined as
described in our previous works. Figure 1 shows the variation of pH by amount of activated carbon to find the PZC. It shows that the adsorption affinity of carbon for H+ ions is in order of: BDH > SEI > F100, it means
that the electron density of the basal layer of the carbon is in order of: BDH > SEI > F100.
The water adsorption isotherms of three activated carbons (in vapor phase) are shown in Figure 2. The surface area of the carbons was measured by adsorption of CO2 and N2 to give micro- and macro-pores in
NOVA instruments (Table 1).
Figure 1. P.Z.C. of the Carbons.
Figure 2. Water adsorption isotherms.
Table 1. Properties of the carbons
Carbon PZC Surface area (m2/gr)
F100 7.8 749 S.E.I. 9.2 851
3. Results and Discussion
Difference of Adsorption between the Activated Carbons
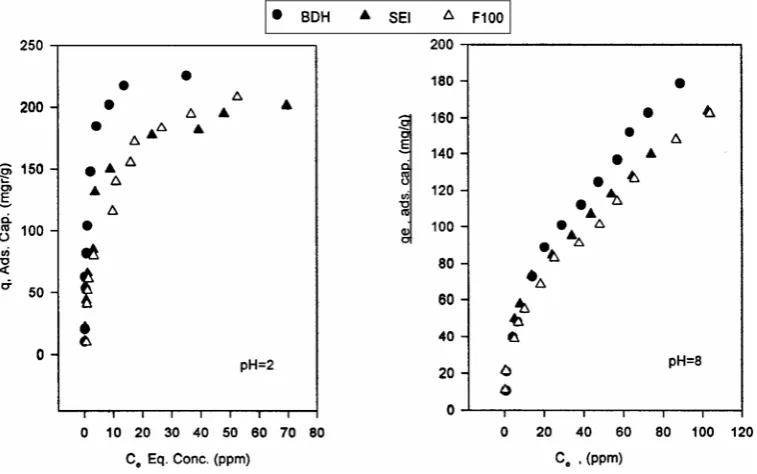
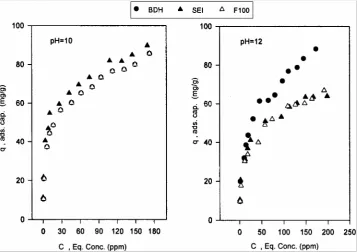
The isotherms of p-Nitrophenol at different pH are shown in Figure 3 and Figure 4. The isotherms are plotted using a mass based solid concentration, qe (in
mg of the solute adsorbed per gram of the carbon)
versus the liquid concentration, Ce (in ppm) at
equilibrium conditions. Considering the surface area values of the carbons, the adsorption capacity of BDH is higher than SEI and F100 in each pH. The adsorption capacity for SEI and F100 is the same. As the solution’s pH is increased, the concentration of the anionic form is increased too. It results in a greater degree of electrostatic repulsive forces and the adsorption capacity of the carbon is expected to be lower.
The effect of pH on the carbon surface and on the solute molecules must be considered. The effects of the pH on the carbon surface are well documented in various reviews, such as the recently published one by Radovic [6]. The adsorption capacity of the carbon for the solutes in their molecular form depends on the electron density of the solutes. This is due to the dispersive interaction between the aromatic ring of the solutes and those of the carbon surface which are the main forces involved in the adsorption process. However, when the solutes are ionized, a different situation arises, as discussed below.
In pH higher than pH(pzc) of the carbons, the carbon
surface is negatively charged. This pH is also well above the pKa of the PNP (Table 2), which means that
this solute is mainly in its ionic form. In other words, because of the high electrostatic repulsive forces in adsorbent-adsorbate and adsorbate-adsorbate, the observed adsorption isotherm is mainly due to the molecular forms of the solutes.
Table 3 shows the initial and equilibrium pH values (pHeq). It shows that the initial and equilibrium pH
values in two extremes of the pH range did not change significantly. However the solution pH values after equilibrium increased significantly, when pHini=7.8 and
10. The increase in pHeq is explained by Snoeyink et al.
[7] in terms of the change in the structure of the double layer. They explain that the adsorption of the anions by the carbon surface leads to an increase in the surface negative charge. There must then be an increase in the positive charge in the diffuse double layer to neutralise this negative charge. This is achieved by removing hydrogen ions from the bulk solution, which in turn would lead to an increase in the solution pH.
Another plausible explanation is that as more molecules are adsorbed, the equilibrium shown in Equation: HA + OH−↔ H
2O + A−, would tend to be
directed more to the left, converting more ions into the
molecular form, producing more OH− ions in the
process. During our pH measurement for the isotherms, it was observed that the higher was the qe, the higher the
measured pH value.
Figure 4. PNP in different carbon at pH = 10 and pH = 12.
Table 2. Properties of the solute
Solute Molecular Weight pKa Solubility (g/l) p-Nitrophenol 139.11 7.2 16
Table 3. Equilibrium pH of the adsorption experiments
Initial pH Equilibrium pH
2±0.1 2±0.1 8±0.1 8.4-9.4 10±0.1 9.8-10.4 12±0.1 12±0.2
Difference Between Langmuir and Freundlich Equations
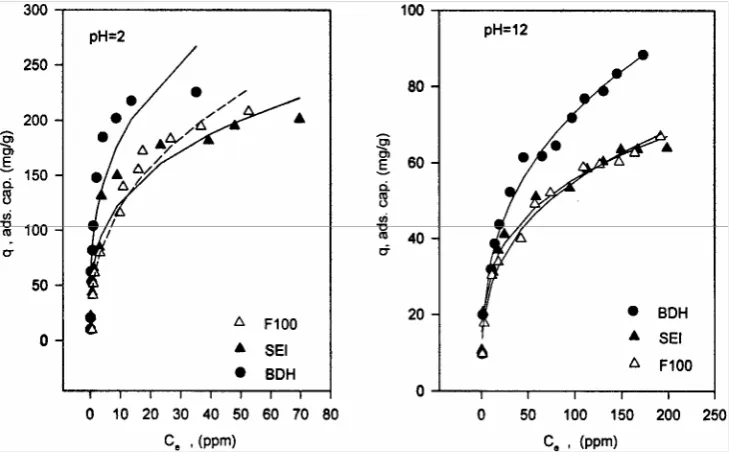
All isotherms were then fitted into the Freundlich isotherm Equation (2) and Langmuir Homogenous Equ-ation (4). Figure 5 shows fitted isotherms in pH=2 and pH=12 for Langmuir equation and Figure 6 shows fitted isotherms for Freundlich equation in pH=2 and pH=12.
In comparison of Figure 5 to Figure 6, it is observed that in low pH, experimental data fit better in Langmuir equation than Freundlich and in high pH it fit better in Frendlich equation.
Variation of maximum adsorption capacity (Qm) with
pH for Langmuir Homogenous is shown in Figure 7 and the fitted affinity coefficients of Langmuir homogenous equation (k1) for three carbons versus the pH are shown
in Figure 8. These plots show both factors follow a similar trend in three carbons. When the solution pH is low, adsorption affinity of three types of carbon and Qm
are high. This is due to the existence of PNP in its mole-cular form. Decrease in the value of Qmax and solute
adsorptivity with pH is expected. Because as the soluti-on’s pH increased, the concentration of the anionic form of solute and negative charge of the carbon increased, and higher anion concentration would result in a greater degree of electrostatic repulsive forces between the solute molecules and between the solute and carbon sur-face. The adsorption capacity of the carbon for PNP in solutions with higher pH values is expected to be lower.
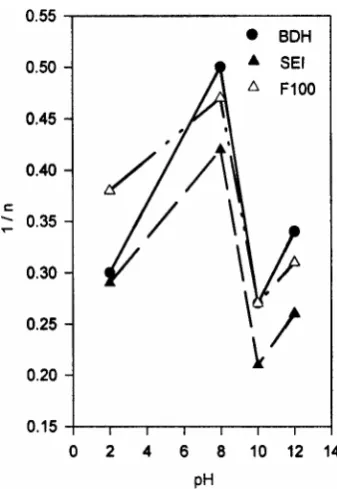
Variation of adsorption affinity (k) for each carbon with pH for Freundlich equation is shown in Figure 9. Adsorption affinity (k) for Freundlich equation follows a similar trend that Langmuir equation. The reason is the same that explained above. Different fitted parameters for each carbon are shown in Table 4.
Figure 5. p-Nitrophenol Langmuir fit.
Figure 6. p-Nitrophenol Freundlich fit.
4. Conclusion
The adsorption capacity of three commercially available activated carbons for an aromatic compound solution, in different pH conditions, is investigated. It was found that the uptake of the molecular forms of the
Figure 7. Variation of Qm with pH (Langmuir).
Figure 9. Variation of K with pH (Freund).
and carbon surface will be higher.
The fitted parameters showed that the affinity and the heterogeneity of the adsorption systems could be expla-ined by the extent of dissociation of the compound.
Figure 8. Variation of K1 with pH (Langmuir).
Figure 10. Variation of 1/n with pH (Freund).
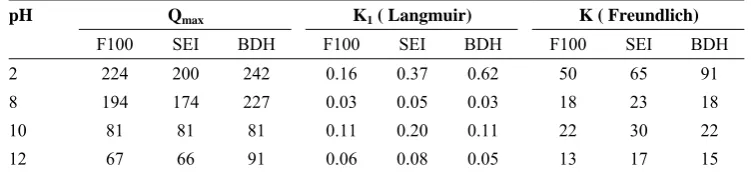
Table 4. Fitted parameters for different carbons
pH Qmax K1 ( Langmuir) K ( Freundlich)
F100 SEI BDH F100 SEI BDH F100 SEI BDH
2 224 200 242 0.16 0.37 0.62 50 65 91
8 194 174 227 0.03 0.05 0.03 18 23 18
10 81 81 81 0.11 0.20 0.11 22 30 22
12 67 66 91 0.06 0.08 0.05 13 17 15
References
1. Banasal R.C., Donnet J.B. and Stoeckli H.F. Active
Carbon. Marcel Dekker, New York, 27 (1988).
2. Jankowska H., Swiatowski A. and Choma J. Active
Carbon. Ellis Horwood, London, 175 (1991).
3. Nouri S., Haghseresht F. and Lu M. Inter. Journal of
Engineering Science, 12(3): 67 (2001).
4. Nouri S., Haghseresht F. and Lu M. Journal of Amir
Kabir, 13(49): 26 (2002).
5. Nouri S., Haghseresht F. and Lu G.O. Adsorption Science
& Technology, (accepted for 20(1) 2002).
6. Radovic L.R., Schwarz J.A. and Contescu C.I. (Eds.),
Marcel Dekker, New York (1999).
7. Snoeyink V.L., Weber W.J. and Mark H.B.