Quantity of hydrophobic functional CH-groups – decisive for soil water repellency
caused by digestate amendment
Amrei Voelkner1*, Dörthe Holthusen1, Ruth H. Ellerbrock2, and Rainer Horn1 1Institute of Plant Nutrition and Soil Science, University of Kiel, Hermann-Rodewald 2, 24118 Kiel, Germany
2Institute of Soil Landscape Research, Leibnitz Centre for Agricultural Landscape Research, Eberswalder 84, 15374 Müncheberg, Germany
Received November 6, 2014; accepted February 26, 2015
*Corresponding author e-mail: [email protected] **This work was funding by the Fachagentur für nachwachsende Rohstoffe (FKZ 22401312), 2012-2015.
A b s t r a c t. Anaerobic digestates are used as organic fertili- zers; however, they are suspected to interfere negatively with soils. To investigate the relevance of the anaerobic digestates compo-sition on potential wettability and contact angle of the soil, we mixed in a laboratory experiment 30 m³ ha-1 of anaerobic digesta- tes derived from mechanically pre-treated substrates from maize and sugar beet with a homogenized Cambic Luvisol. Fourier trans-
form infrared-spectra and diffuse reflectance infrared Fourier transform-spectra of particle intact and finely ground
soil-anaerobic digestates-mixtures were analyzed to determine the quantities of hydrophobic functional groups in the soil-anaero-bic digestates-mixtures that are used here as an indicator for the potential hydrophobicity. The anaerobic digestates application increased the amount of hydrophobic functional groups of the mix-tures and reduced the wettability of the soil. However, for intact particle samples an up to threefold higher amount of hydrophobic
groups was found as compared to the finely ground ones,
indi-cating a dilution effect of mechanical grinding on the effecti- vity of the organic matter that is presumably located as a coat-ing on mineral soil particles. For the particle intact samples, the intensity of hydrophobic functional groups bands denoting hydro-phobic brickstones in organic matter is indicative for the actual wettability of the soil-anaerobic digestates-mixtures.
K e y w o r d s: anaerobic digestates, organic matter
composi-tion, Fourier transform infrared spectroscopy, diffuse reflectance
infrared Fourier transform spectroscopy
INTRODUCTION
Responding to the financial compensation for generat
-ing renewable energy, the installation of biogas plants on arable land increased in recent years. Anaerobic digestates (AD) are a by-product of biogas generation by anaerobic fermentation. Application of AD on agricultural soils will
influence the intrinsic soil organic matter pools, due to their
organic carbon contents (Boyd et al., 1980). Additionally, it will enhance the fertility of soils (Réveillé et al., 2003) due to their vast amounts of plant nutrients (Alburquerque et al., 2012) like plant available ammonium, potassium, and phosphorus (Sørensen and Møller, 2009). Besides these po- sitive properties, digestates are suspected to have negative impacts on soils since they transfer recalcitrant amphiphi-lic substances (eg humic, fulvic, and fatty acids) into the soil matrix. Such amphiphilic substances cover soil particle
surfaces, resulting in modification of the physicochemical
properties of soils (Hurraß and Schaumann, 2006). The term amphiphilic substances describes molecules formed by both, hydrophobic and hydrophilic functional groups (Morrison and Boyd, 1983), which altogether may affect the actual wettability of soils (Franco et al., 2000). Soil organic matter (OM) consists of amphiphilic components; therefore, Negre et al. (2002) linked the ability of water to spread on a soil surface to the macromolecular compo-sition of OM. In consequence, the wetting behaviour of soils may change with the content and composition of OM coatings on mineral particle surfaces (Leue et al., 2010) as well as the spatial arrangement of OM compounds at the molecular scale (Morrison and Boyd, 1983). Spectroscopic techniques like Fourier transmission infrared (FTIR) and
diffuse reflection infrared Fourier transform (DRIFT)
spectroscopy have been widely used to characterize the composition of functional groups in soil organic matter (SOM) (Capriel et al., 1995; Gerzabek et al., 1997; Tatzber
et al., 2007) and at intact aggregate surfaces (Leue et al., 2010) in order to determine the potential wettability of OM.
The hydrophobic functional groups of OM are represented by methylene and methyl groups (CH), whereas carbo-
xyl- and hydroxyl (C=O) groups reflect the hydrophilic
ones. Characteristic absorption bands in FTIR and DRIFT spectra allow analysis of the contents of hydrophobic CH- (Capriel, 1992) and hydrophilic C=O-groups (Celi et al., 1997). Thus, such spectroscopy techniques (FTIR Demyan
et al., 2012; DRIFT eg Reeves et al., 2001) have been
widely applied to characterize the OM composition. Celi
et al. (1997) stated the CH/C=O ratio should be appropriate
to deduce the potential hydrophobic properties of the OM (Morrison and Boyd, 1983), while Ellerbrock et al. (2005) could not detect reduced wettability with an increasing A/B
ratio. They justified these findings with the low effective
-ness of the hydrophobic CH-bands to cause wettability. These results however also prove that the effectiveness of the quantity of CH-bands within OM originating from AD on the hydrophobicity in soils is still unknown. Since soil hydrophobicity results in severe ecological problems such as soil erosion, especially in sloped areas, it would be nec-essary to investigate the causes of this process.
Therefore, the aim of the study was to evaluate the consequences of the application of AD different in OM composition on the wettability of soil mineral surfaces. We assume that even a small amount of wetting-restraining
CH-groups will be sufficient to reduce the sample wet
-tability and that, in this case, the effect of the CH-groups dominates the effect of the hydrophilic C=O-groups. We hypothesize that the ratio between hydrophobic and hydro-philic groups is less effective in estimation of the impact of the AD application on the wetting behaviour of soils as compared to the intensity of CH absorption bands.
MATERIALS AND METHODS
For the laboratory measurements, disturbed soil
mate-rial was sampled in June 2013 from the first 10 cm of the
A-horizon of an arable Cambic Luvisol (derived from Weichselian glacial till, FAO, 1998) at the research farm Hohenschulen of the University of Kiel, Germany. The chemical parameters of the soil was analyzed using stand-ard procedures according to Schlichting et al. (1995).
The soil sample (n=1) from Hohenschulen contained 166, 272, 1.2, and 7 g kg-1 clay, silt, organic carbon, and
nitrogen, respectively was classified as a sandy loam (FAO,
1998). The soil pH of 6.6 exhibited slightly acidic
condi-tions and was classified as Cambic Luvisol (KA5, 2006).
Liquid digestates were produced at the Institute for Agricultural Engineering (University of Kiel) in batch- fermentation processes. Input substrates (IS) from maize
(Zea mays L.) and sugar beet (Beta vulgaris L.) were
mechanically pre-treated by grinding (gr) or chopping (ch) and digested in monofermentation (one IS) and cofermen-tation (two IS in different ratios) (Table 1).
The disturbed soil material from the top layer of the
ploughed soil surface was air-dried and sieved to ≤ 2 mm.
Assuming an average soil depth of 30 cm in accordance withthe common agricultural practice, 480 g of the air-dried soil were mixed with 30 ml of anaerobic digestates (AD) (equivalent to 30 m³ ha-1) by stirring. Additionally, a control treatment (C) was prepared using the same amount of demineralized water instead of the digestates. Two mix-tures (repetitions) of each treatment were prepared. The soil remained in contact with the AD for 10 days at 10°C until a biological equilibrium was reached. Then, the mixtures were again air-dried and homogenized. From each mix-ture, six subsamples were taken for determining the contact angle (CA), two for transmission FTIR and four for DRIFT measurements.
To determine the wetting behaviour, the CA of the
air-dried soil samples (≤ 2 mm) was measured using the
Wilhelmy-Plate-method (WPM) with a microtensiometer (Krüss, Hamburg, Germany) (Hartmann, 2008). The advan- cing and receding CA between 0 and 180° was measured by immersing a glass plate covered with a one-grain layer of soil particles into distilled water with known surface ten-sion. The CA (cos) was calculated from the force F (N)
acting on the plate using Eq. (1):
,) ( /
cosθ=F ρσ LV (1)
where: LV (mN m-1) denotes the surface tension of the liquid and r indicates the liquid density (g cm-3). A CA between 0° and 90° characterises hydrophilic conditions,
whereas values ≥ 90° describe hydrophobic conditions
(Bachmann et al., 2003). The measurement of the CA was conducted in six replicates per sample.
T a b l e 1. Summary of the mechanical pre-treatment
(ch-chopped, gr-ground) and the ratio of the used input substrate (IS)
Amendment
Pre-treatment Input substrate Ratio (%)
gr-M100 ground maize 100
ch-M100 chopped 100
gr-SB100 ground sugar beet 100
ch-SB100 chopped 100
gr-SB80M20 ground sugar beet/
maize 80 / 20
ch-SB80M20 chopped 80 / 20
gr-M80SB20 ground maize/
sugar beet 80 / 20 ch-M80SB20 chopped maize/
The composition of the OM was characterized using transmission FTIR and DRIFT technique (Tremblay and
Gagné, 2002). The functional groups of finely ground sam
-ples can be analyzed with both Fourier Transform Infrared spectroscopy (FTIR) (Haberhauer and Gerzabek, 1999) and the DRIFT technique. The DRIFT method has also been applied to detect the OM functional groups at the surface of intact soil particles (Leue et al., 2010):
• FTIR spectroscopy of ground samples (G) mixed with potassium bromide (KBr),
• DRIFT spectroscopy of ground samples (G),
• DRIFT spectroscopy of particle intact samples (PI). For the FTIR measurements, air-dried samples from the
soil-AD-mixtures (≤ 2 mm) and freeze-dried AD samples
were finely ground in an agate mortar. For spectral analy
-sis in the transmission technique FTIR, the KBr technique was used according to Capriel et al. (1992): one milli-gram of the ground samples was mixed with 80 mg KBr. The mixture was dried over silica gel in an exsiccator for 12 h to standardize the water content of the samples, ground again in an agate mortar, and formed into a pellet using a hydraulic press (9 t). The pellet was positioned into a sam- ple holder.
For DRIFT measurements, the samples were either
finely ground in an agate mortar (G) or left particle intact
(PI) (particles of ≤ 2 mm diameter) to analyze the effect of
particle size distribution on the DRIFT signal intensities (Ellerbrock et al., 2009). One mg of the finely ground soil-digestate-mixture was filled into cylindrical cups of 8 mm
diameter and a height of 2 mm. The PI samples from the
soil-AD-mixtures were filled into a tinfoil box with 5 cm
length and 1 cm width. The cups and box were placed on an aluminium plate, which was positioned on an XY-positioning table of the spectrometer (Leue et al., 2010). 32 internal scans with four replicates of the subsamples were recorded with a DRIFT device of the BioRad FTS 135 (BioRad Corp, Hercules, CA) in a range of wavenumber from 4 000 to 400 cm-1 each spectra and corrected against ambient air as background (McDowell et al., 2012). The DRIFT spectra were recorded with a resolution of 4 cm-1 and 16 scans (16 repetitions of single spectra) (Ellerbrock and Kaiser, 2005). The spectra were smoothed with a box-car function, which is unity within the interval and zero outside it and baseline-corrected using the software Win-IR
Pro 3.4 (Digilab, Holliston, MA). Finally, the reflectance
data were converted to Kubelka-Munk units using the standard KM transformation in the software to compare the adsorption intensity. The Kubelka-Munk equation relates
the intensity of the reflected radiation to the concentration
that can be used for quantitative evaluation. The Kubelka-Munk function produces a transmission spectrum, which demonstrates a linear relationship between band intensity and the sample preparation. The Kubelka-Munk units are dimensionless.
The spectral interpretation focusses on absorption bands at 2 920 cm-1 (asymmetric stretch) and 2 860 cm-1 (symmet-ric stretch) caused by CH-stretching vibrations of methyl and methylene groups (absorption band A) (Capriel et al., 1995). These groups represent the hydrophobic functional OM groups. The absorption bands characteristic for hydro-philic carboxylic C=O-groups (ie brickstones of ketones, carboxylic acids, or amides) occurred at 1 701 to 1 698 cm-1 (Günzler and Böck, 1990) (absorption band B). The cumula- tive heights of hydrophobic CH-absorption bands were related to that of the hydrophilic C=O-bands (A/B ratio)
in order to reflect the hydrophobic character of the OM
(Ellerbrock et al., 2005) and to determine the potential wet-tability of the soil-AD-mixtures.
Statistical significance of the data was analyzed using
the statistical software R (version 2.15.3). Based on the graphical residual analysis, the values were assumed to be normally distributed and heteroscedastic. Analysis of variance (ANOVA) was used to assess the statistical
sig-nificance between the amendments and the control.
RESULTS
Both types of AD (mono and co-fermentation) as well as the AD obtained from monofermentation of ground input substrates (gr-M100 and gr-SB100) showed a pH >8 (Table 2). For the gr-M100 digestate, the highest ammonium content was found, while the digestates from monofermen-tation (ch-M100 and ch-SB100) and from cofermenmonofermen-tation (gr-SB80M20 and gr-M80SB20) contained the highest amount of sodium ions compared to the other digestates.
The FTIR spectra indicated higher contents of hydro-phobic CH-groups for the AD derived from ground IS as compared to those of the chopped IS, but the A/B ratio did
not reflect such differences (Table 3). The DRIFT spec
-tra of the AD samples showed strong signals due to light
scattering caused by fibre particles contained in the AD.
The signals resulting from direct scattering impeded the interpretation of the absorption bands of the CH- and C=O- groups in OM.
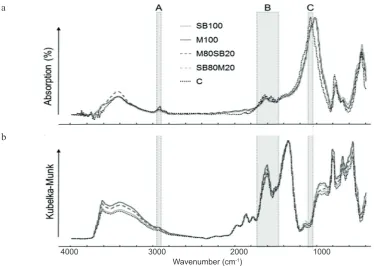
The transmission FTIR and the DRIFT (Fig. 1a, b) spectra of the soil-AD-mixtures showed a similar peak pattern for AD from ground and chopped (graphic not shown) IS. The FTIR spectrum of the soil (control, C) sample indicated a maximum at 1 100 cm-1 for the absorption band C, while the soil-AD-mixtures exhibited a maximum at 1 050 cm-1, indicating a change in the composition of polysaccharides that caused this absorption band. Such differentiation was not found in the DRIFT spectra of the corresponding sam-ples. After application of digestates derived from ground IS,
the amount of functional groups was significantly (p<0.05)
higher compared to the control.
to C=O vibrations of carboxylic groups (band B). However, the FTIR and DRIFT spectra differed in the intensity of the absorption bands A and B (Fig. 1). The intensity of the
CH- and C=O-bands was significantly (p<0.05) higher in
the DRIFT spectra than in the transmission FTIR spectra. In comparison to the transmission FTIR spectra, the DRIFT spectra did not show the Si-O-Si band at a wavenumber of around 1 000 cm-1 (band C).
The DRIFT spectra of the soil-AD-mixtures showed
significantly higher absorption intensities of the CH-band
(band A) as compared to the one of the unamended control C. This was not found for the FTIR spectra. The compari-son between the spectra showed higher absorption intensity at B and A bands as well as an increasing CH/C=O-ratio (A/B) of the soil-AD-mixtures from ground as compared to that from chopped IS.
The DRIFT spectra of the particle intact (PI) soil-diges-tate-mixture samples are similar to those from ground and chopped IS (graphic not shown). The intensity of the CH- absorption band (B) was higher for the soil-AD-mixtures compared to the one of the unamended control soil C.
The intensity of the A and B bands of the DRIFT (G)
spectra was statistically higher (p<0.05) compared to the
absorption intensity of the CH- and C=O-bands of the FTIR
(G) spectra (Table 4). In contrast to these former findings
offered the absorption intensity of the A- and B-bands of the PI intact samples up to threefold higher absorption intensities of A- and B-bands compared to the spectra of the (G) samples, which was not least represented by the A/B ratio of the samples. However, in the FTIR (G) spectra, the gr-M80SB20 sample exhibited the highest intensity of the CH-band while in the DRIFT (G and PI) spectra gr-M100 showed the highest intensity of the CH-band (Table 4).
The control soil possessed a CA < 90° and hence it could be classified as hydrophilic (Table 4). The
soil-AD-mixtures showed higher CA values whereby the CA values were slightly higher for the mixtures with AD from ground (88.9 to 91.5) as compared to those from chopped IS (81.1 to 91.0) (Table 4), except for gr-SB100, which exhibited similar CA values for the mixtures from AD with chopped and ground IS.
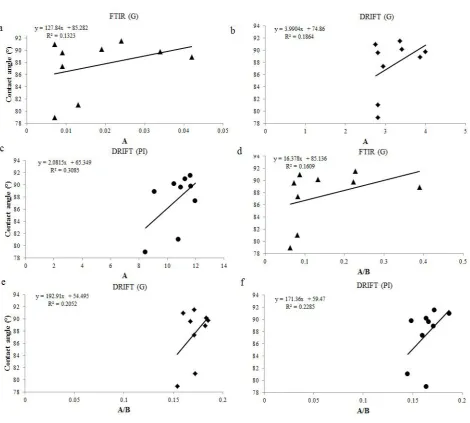
The CA values were positively correlated (but not
sig-nificantly) with the intensity of the absorption band A and
with the A/B ratio of the ground and particle intact samples, respectively (Fig. 2). The A/B ratio determined from the FTIR and DRIFT spectra of the ground mixtures showed a better correlation with the CA compared to the A-band (Fig. 2a, b, d, e). The correlation between both, the A-band and the A/B ratio was higher in the DRIFT spectra of the
T a b l e 2. Properties of the digestates obtained for ground (gr) and chopped (ch) input substrates (n=1). Data expressed in % of the
original substance (OS)
Amendment (µS cmEC -1) pH Acetic acid(g kg-1 OS) Dry
solids NH4-N Total N P K Mg Ca
Na (mg kg-1 OS) (% OS)
gr-M100 81 8.25 <0.05 2.8 0.21 0.24 0.23 0.03 0.02 0.02 139
ch-M100 83 7.93 <0.05 3.0 0.14 0.24 0.27 0.04 0.03 0.03 179
gr-SB100 84 8.21 <0.05 2.6 0.15 0.26 0.22 0.03 0.02 0.02 138
ch-SB100 82 7.85 <0.05 2.8 0.13 0.23 0.25 0.03 0.03 0.02 167
gr-SB80M20 91 7.74 0.083 2.8 0.14 0.17 0.28 0.05 0.04 0.02 159
ch-SB80M20 85 7.82 <0.05 2.9 0.14 0.26 0.23 0.03 0.02 0.02 140
gr-M80SB20 90 7.75 <0.05 2.8 0.14 0.18 0.29 0.04 0.04 0.02 159
ch-M80SB20 87 7.85 <0.05 3.2 0.15 0.25 0.24 0.04 0.02 0.02 145
< Below the detection limit.
T a b l e 3. Intensity of CH (band A) and C=O (band B) in FTIR
spectra (n=4) of freeze-dried digestates derived from ground (gr) and chopped (ch) input substrate (IS)
Amendment A B A/B
gr-M100 0.108 0.505 0.215
gr-SB100 0.097 0.426 0.227
gr-SB80M20 0.091 0.426 0.214
gr-M80SB20 0.093 0.426 0.219
ch-M100 0.076 0.350 0.216
ch-SB100 0.098 0.482 0.204
ground samples compared to the transmission FTIR spec-tra. The correlation of the intensity of the A-band as well as the A/B ratio was best using intact particle samples (Fig. 2c and f). The spectra of the PI exhibited a higher correlation between CA and the intensity of the A-band compared to the A/B-ratio.
DISCUSSION
Soil organic matter is characterized by the amount of particulate organic matter, organo-mineral complexes (Leue
et al., 2013), humic acids, the content of functional groups
(CH and C=O) and their spatial conformation of organic molecules on the microscale (Morrison and Boyd, 1983).
Fig. 1. FTIR (a) and DRIFT (b) spectra (ground samples) of digestate-soil mixtures (SB100: 100% of sugar beet; M100: 100% of
maize; SB80M20: 80% of sugar beet and 20% of maize; M80SB20: 80% of maize and 20% of sugar beet) derived from ground input substrates.
T a b l e 4. Intensity of CH and C=O band in FTIR and DRIFT spectra of ground (G) and particle intact (PI) samples (n=4) as well as
the contact angle (CA) [°] of soil-AD-mixtures (n=6) and untreated soil (C)
Amendment
FTIR (G) DRIFT (G) DRIFT (PI)
CA
CH C=O C=OCH/ CH C=O C=OCH/ CH C=O C=OCH/
gr-M100 0.034b 0.152b 0.223b 4.003b 21.589a 0.185a 11.647a 78.255b 0.149a 89.8a
gr-SB100 0.024b 0.107b 0.228b 3.362b 19.612a 0.171a 11.621a 67.596a 0.172a 91.5a
gr-SB80M20 0.019a 0.146b 0.133b 3.409b 18.670a 0.183a 10.474a 64.005a 0.164a 90.2a
gr-M80SB20 0.042b 0.107b 0.390b 3.862b 21.221a 0.182a 9.087a 53.034a 0.171a 88.9a
ch-M100 0.013a 0.164b 0.081a 2.807a 16.360a 0.172a 10.792a 74.370b 0.145a 81.1a
ch-SB100 0.007a 0.082a 0.087a 2.755a 17.207a 0.160a 11.242a 59.999a 0.187a 91.0a
ch-SB80M20 0.009a 0.115b 0.082a 2.942a 17.202a 0.171a 11.977a 74.723b 0.160a 87.4a ch-M80SB20 0.009a 0.118b 0.073a 2.811a 16.813a 0.167a 10.957a 66.127a 0.166a 89.6a
C 0.007a 0.063a 0.063a 2.808a 18.194a 0.154a 8.460a 51.548a 0.164a 79.0a
Different letters (ab) indicate statistically significant differences (p<0.05) of the functional groups of digestates in comparison to the
control.
Wavenumber (cm-1) a
b
The organic material of anaerobic digestates contains great amounts of amphiphilic components like long-chained fatty acids, which are transferred to the soil matrix after applica-tion (Täumer et al., 2005); it can flow into pore spaces or
may surround mineral particles. The effect of this coating on the soil is mainly determined by the ratio of hydropho-bic CH-bands to hydrophilic C=O-bands, which in term has major implications for the wetting behaviour of min-eral particles (Ellerbrock and Gerke, 2004). The FTIR and DRIFT spectra of the soil-AD-mixtures indicate a change in the composition of SOM after digestate amendment: the amount of hydrophobic CH-groups is higher as compared
to the unamended soil reflected by a more pronounced
peak at a wavenumber of 2 920 and 2 860 cm-1. This may
be explained by a supply of hydrophobic functional groups contained in the ADs. This is in accordance with Capriel et al. (1997), who assessed a close relationship between CH content and soil hydrophobicity. With an increasing amount of CH-groups determined by FTIR and DRIFT the wetta-bility of the soil-AD-mixtures decreases.
The CH/C=O ratio, which is also assumed to reflect
the potential wettability of soil samples (Ellerbrock et al., 2005), can just be partly related to the wettability of soil-AD-mixtures investigated here. Ellerbrock et al. (2009) used FTIR spectroscopy to investigate the ratio of hydro-phobic CH-bands (A) to hydrophilic C=O-bands (B) in the SOM and found that the lower values of the A/B ratio indicate more hydrophilic conditions of the OM, while the
Fig. 2. CA (°) vs. intensity of absorption band A determined from: a – FTIR, b – DRIFT of ground (G) and c – DRIFT spectra of particle
hydrophobicity increases. They concluded that the hydro-phobic functional CH-groups seemed to be less effective
in reducing soil wettability. These findings are consistent for the soil-AD-mixtures from the finely ground samples
investigated with FTIR and DRIFT spectroscopy. The high-est wettability of the soil-AD-mixture ch-M100 from the ground samples does not show the lowest A/B ratio and, at the same time, the lowest wettability of the ground sam-ples from the soil-AD-mixtures (gr-SB100 and ch-SB100) does not exhibit the highest proportion from hydrophobic CH-bands to hydrophilic C=O-bands. However, the PI samples show compliance of the wettability and the A/B ratio of the soil-AD-mixtures. Based on these results, the composition of the functional groups of the organic matter cannot be considered as the only factor to derive the actual hydrophobicity of the soil after AD amendment.
Besides the qualitative composition of the OM, another explanation for variances in soil wettability may be the quantity of organic compounds and their spatial arrange-ment in the pore space, which cannot be detected with the FTIR or DRIFT spectra. Depending on the soil water con-tent, the organic compounds – consisting of a hydrophobic carbon backbone and a hydrophilic functional group – may change their orientation in the pore space when the water content falls below critical water content (Gonzáles-Peñaloza et al., 2013). In a dry surrounding, the hydrophilic groups are attracted and the hydrophobic backbones are arranged around the hydrophilic centre, which results in more hydrophobic conditions. However, although the soil-AD-mixture samples are air-dried, such reorientation of the
organic molecules is not reflected in a noticeably increasing
contact angle. The extent of the hydrophobic effect is further dependent on the soil texture since the loamy sand contains great amounts of clay particles, which exhibit a con-
siderable greater specific surface area with reactive bind
-ing places (Caravaca et al., 2001). The additional supply
of functional groups with the ADs seems to be sufficient
to cover the multitude of binding places on the clay parti-cle surfaces, as a result the impact of the functional groups on hydrophobization is less intensive. Gerin et al. (2003)
found that for fine-textured soils, a dilution effect of the
SOM might occur due to the relatively large surface areas of the soil particles, which results in a thin and less effec-tive coating of organic compounds on the particle surface. The FTIR and DRIFT spectra can be only detected from air-dried soil-AD-mixtures and freeze-dried ADs. As a re-
sult, the findings from this study can be transferred to field
conditions in the case of a dry period but are not transferable to moist soil conditions after rainfall. For the used me- thods (spectroscopic technique as well as the measurement of the contact angle), homogenized soil was required. Thus,
after occurrence of wetting and drying cycles in the field
and subsequent soil structure formation, the results may not
be transferable to field conditions any more.
Thus, we can conclude that the situation observed in
the laboratory cannot be projected to field conditions one to one. Nevertheless, the measurements are a first attempt
to estimate the impact of ADs on soil wetting properties on the microscale.
The analysis of the organic functional groups using FTIR and DRIFT spectroscopy shows only very small differenc-es, but the pre-treatment of the samples seems to be the decisive factor. The PI samples exhibit the best correlation between the A/B ratio as well as the height of the A-band
compared to the finely ground samples. Nevertheless, the content of hydrophobic CH bands of the PI samples reflects
better the actual hydrophobicity of the soil compared to the A/B ratio. Reeves et al. (2005) assumed that grinding of
the particles might influence the spectra of the intensity of
the adsorption bands. Amelung et al. (2002) suggested that grinding of the particles destroyed the mineral particles as well as the organic coating. These offers further mineral surfaces without any organic compounds. Consequently, the organic compounds are diluted due to the crushing pro-cess and the spectra represent more the mineral nuclei than
the organic compounds of the coating. This is confirmed
by the missing Si-O-Si-band (band C) in the DRIFT spec-tra of the PI samples compared to the FTIR specspec-tra. Since the ground soil-AD-mixtures exhibit low values for the A- and B-bands, the absorption intensity of the CH- and C=O bands of the PI samples are substantially higher. This indicates that mainly the organic coating of the PI particles was recorded, while the proportion of the silicate particle exceeds the quantity of the organic compounds. The ground
samples from FTIR reflect both the surface consisting of
organic compounds and the quartz core (Leue et al., 2010), while the PI samples from DRIFT represent proportionately the coating surrounding the mineral core. Previous studies
from Ellerbrock and Gerke (2004) confirmed already that
the KBr-technique of FTIR spectroscopy was not suitable to determine primarily the outer surface of soil particles.
CONCLUSIONS
1. The determination of hydrophobic and hydrophilic functional groups of organic matter contained in the anaero-bic digestates using Fourier transform infrared and diffuse
reflectance infrared Fourier transform is suitable to obtain
information about the potential wettability of the organic compounds but is not transferable to actual wettability of soil in any case.
2. The applicability of Fourier transform infrared and
diffuse reflectance infrared Fourier transform spectros
3. For the particle intact samples, the ratio of potentially hydrophobic groups and potentially hydrophilic and the quantity of potentially hydrophobic CH-bands are found to correlate best with the actual wettability of the soil, where-as the utility of the A-bands is more suitable to evaluate the anaerobic digestates induced reduced soil wettability.
4. The ground samples do not reflect the actual wettabil
-ity in all cases due to a high dilution effect of the organic functional groups with the silicate core.
5. It can be summarized that the composition of anaer-obic digestates organic matter will be best achieved by
evaluating particle intact samples using the diffuse reflec
-tance infrared Fourier transform technique. However, the microtopography of the particle intact samples remains
unconsidered applying diffuse reflectance infrared Fourier
transform spectroscopy and has to be taken into account in further investigations. At present, it is not possible to deter-mine only the hydrophilic functional groups by considering the hydrophilic bands, but also further organic components which cannot be separated from the hydrophilic bands. This could therefore be a solution to evaluate the potential wettability of the organic matter based on the ratio of the hydrophobic bands and the silicium band according to the approach of Bernier et al. (2013).
REFERENCES
Alburquerque J.A., de la Fuente C., Campoy M., Carrasco L., Najera I., Baixauli C., Caravaca F., Roldan A., Cegarra J.,
and Bernal M.P., 2012. Agricultural use of digestate for
horticultural crop production and improvement of soil properties. European J. Agronomy, 43, 119-128.
Amelung W., Kaiser K., Kammerer G., and Sauer G., 2002. Organic carbon at soil particle surfaces – Evidence from X-ray photoelectron spectroscopy and surface abrasion. Soil Sci. Soc. Am. J., 66, 1526-1530.
Bachmann J., Woche S.K., Goebel M.-O., Kirkham M.B., and
Horton R., 2003. Extended methodology for determining
wetting properties of porous media. Water Res., 39, 1353-1359.
Bernier M.-H., Levy G.J., Fine P., and Borisover M., 2013. Organic matter composition in soils irrigated with treated wastewater: FT-IR spectroscopic analysis of bulk soil sam-ples. Geoderma, 209-210, 233-240.
Boyd S.A., Sommers L.E., and Nelson D.W., 1980. Changes in
the Humic-acid fraction of soil resulting from sludge appli-cation. Soil Sci. Soc. Am. J., 44, 1179-1186.
Capriel P., Beck T., Borchert H., Gronholz J., and Zachmann
G., 1995. Hydrophobicity of the organic-matter in arable
soils. Soil Biology and Biochemistry, 27, 1453-1458.
Capriel P., Harter P., and Stephenson D., 1992. Influence of
management on the organic-matter of a mineral soil. Soil Sci., 153,122-128.
Caravaca F., Lax A., and Albaladejo J., 2001. Soil aggregate
stability and organic matter in clay and fine silt fractions in
urban refuse-amended semiarid soils. Soil Sci. Soc. Am. J., 1235-1238.
Celi L., Schnitzer M., and Negre M., 1997. Analysis of carboxyl
groups in soil humic acids by a wet chemical method, Fourier- transform infrared spectrophotometry, and solution-state carbon-13 nuclear magnetic resonance. A comparative study. Soil Sci., 162, 189-197.
Demyan M.S., Rasche F., Schulz E., Breulmann M., Muller T.,
and Cadisch G., 2012. Use of specific peaks obtained by
diffuse reflectance Fourier transform mid-infrared spectros -copy to study the composition of organic matter in a Haplic Chernozem. European J. Soil Sci., 63,189-199.
Ellerbrock R.H. and Gerke H.H., 2004. Characterizing organic
matter of soil aggregate coatings and biopores by Fourier transform infrared spectroscopy. European J. Soil Sci., 55, 219-228.
Ellerbrock R.H., Gerke H.H., Bachmann J., and Goebel M.O.,
2005. Composition of organic matter fractions for
explain-ing wettability of three forest soils. Soil Sci. Soc. Am. J., 69, 57-66.
Ellerbrock R.H. and Kaiser M., 2005. Stability and composition
of different soluble soil organic matter fractions – evidence from delta C-13 and FTIR signatures. Geoderma, 128, 28-37.
Ellerbrock R.H., Gerke H.H., and Böhm C., 2009. In situ
DRIFT characterization of organic matter compositions on soil structural surfaces. Soil Sci. Soc. Am. J., 73, 531-540. Franco C.M.M., Clarke P.J., Tate M.E., and Oades J.M., 2000.
Hydrophobic properties and chemical characterisation of natural water repellent materials in Australian sands. J. Hydrol., 231, 47-58.
Gerin P.A., Genet M.J., Herbillon A.J., and Delvaux B., 2003. Surface analysis of soilmaterial by X-ray photoelectron spectroscopy. European J. Soil Sci., 54, 589-603.
Gerzabek M.H., Pichlmayer F., Kirchmann H., and Haber-
hauer G., 1997. The response of soil organic matter to
manure amendments in a long-term experiment at Ultuna, Sweden. European J. Soil Sci., 48, 273-282.
Gonzáles-Peñaloza F.A., Zavala L.M., Jordán A., Bellinfante N., Bárcenas-Moreno G., Mataix-Solera J., Granged A.J.P.,
Granja-Martins F.M., and Neto-Paixão H.M., 2013. Water
repellency as conditioned by particle size and drying in hydrophobized sand. Geoderma, 209-210, 31-40.
Günzler H., and Böck H., 1990. IR-Spektroskopie. Verlag
Chemie, Weinheim, Germany.
Haberhauer G. and Gerzabek M.H., 1999. Drift and
transmis-sion FT-IR spectroscopy of forest soils: an approach to deter- mine decomposition processes of forest litter. Vibrational Spectroscopy, 19, 413-417.
Hartmann P.M., 2008. Bodenphysikalische Eigenschaften,
Benetzbarkeiten und Wasserhaushalt von Waldböden unter
Flugascheeinfluss. Dissertation, University of Kiel, Kiel,
Germany.
Hurraß J. and Schaumann G.E., 2006. Properties of soil
organ-ic matter and aqueous extracts of actually water repellent and wettable soil samples. Geoderma, 132, 222-239.
Leue M., Ellerbrock R.H., and Gerke H.H., 2010. DRIFT
Schlichting E., Blume H.-P., and Stahr K., 1995. Bodenkundliches Praktikum: Eine Einführung in pedologisches Arbeiten für Ökologen, insbesondere Land- und Forstwirte und für Geowissenschaftler. 2nd, revised edition, Vol. 81. Berlin, Wien: Blackwell-Wissenschafts-Verlag.
Sørensen P. and Møller H.B., 2009. Fate of nitrogen in pig and
cattle slurries applied to the soil-crop system. In: Anaerobic digestion: Opportunities for agriculture and environment (Eds F. Adani et al.). DiProVe University of Milan, Milan, Italy.
Tatzber M., Stemmer M., Spiegel H., Katzlberger C.,
Haberhauer G., and Gerzabek M.H., 2007. An
alterna-tive method to measure carbonate in soils by FT-IR spectroscopy. Environmental Chemistry Letters, 5, 9-12.
Täumer K., Stoffregen H., and Wessolek G., 2005. Determi-
nation of repellency distribution using soil organic matter and water content. Geoderma, 125, 107-115.
Tremblay L. and Gagné J.P., 2002. Fast quantification of humic
substances and organic matter by direct analysis of sedi-ments using DRIFT spectroscopy. Analytical Chemistry, 74, 2985-2993.
Leue M., Gerke H.H., and Ellerbrock R.H., 2013.
Millimetre-scale distribution of organic matter composition at intact bio- pore and crack surfaces. European J. Soil Sci., 64, 757-769. McDowell M.L., Bruland G.L., Deenik J.L., Grunwald S., and
Knox N.M., 2012. Soil total carbon analysis in Hawaiian
soils with visible, near-infrared and mid-infrared diffuse
reflectance spectroscopy. Geoderma, 189, 312-320.
Morrison R.T. and Boyd R.N., 1983. Lehrbuch der organischen
Chemie. Verlag Chemie, Weinheim, Germany.
Negre M., Vindrola D., Spera S., Ferraris L., and Gennari M.,
2002. Effect of the chemical composition of soil humic
acids on their viscosity, surface pressure, and morphology. Soil Sci., 167, 636-651.
Reeves J.B., Francis B.A., and Hamilton S.K., 2005. Specular
reflection and diffuse reflectance spectroscopy of soils.
Applied Spectroscopy, 59, 39-46.
Reeves J.B., McCarty G.W., and Reeves V.B., 2001.
Mid-infrared diffuse reflectance spectroscopy for the quantitative
analysis of agricultural soils. J. Agric. Food Chemistry, 49, 766-772.