Structural and dielectric properties of
crystalline and amorphous ZrO
2David Vanderbilt,
∗
Xinyuan Zhao, and Davide Ceresoli
Department of Physics and Astronomy, Rutgers, the State University of New Jersey, 136 Frelinghuysen Road, Piscataway, NJ 08854-8019
Abstract
We first review earlier work in which we computed the first-principles structural, vibrational, and lattice dielectric properties of the cubic, tetragonal, and monoclinic
phases of ZrO2 and HfO2. We then discuss two approaches to the construction of
realistic models of amorphous ZrO2: a “melt-and-quench” ab-initio molecular
dy-namics approach, and an “activation-relaxation technique.” The structural, vibra-tional, and dielectric properties of the resulting models are then analyzed in detail. The overall average dielectric constant is computed and found to be comparable to that of the monoclinic phase. These techniques show promise for future modeling of high-K dielectric ultrathin films and interfaces.
Key words: Amorphous materials, ZrO2, Dielectric properties, Lattice dynamics.
1 Introduction
The International Technology Road Map for Semiconductors calls for an effec-tive gate-dielectric thickness of approximaeffec-tively 1 nm for 0.1µm CMOS tech-nology by the year 2006 [1]. In this regime, conventional thermally-grown SiO2
is expected to fail because of issues of tunneling leakage current and reliabil-ity. Thus, there are strong incentives to identify so-called “high-K” materials (that is, materials with dielectric constant K, or , much larger than that of SiO2 at=3.9) which could be grown as thicker films while still providing the
needed capacitance. A variety of high-K oxides have been proposed, including HfO2, ZrO2, and their mixtures with SiO2.
∗ Corresponding author: David Vanderbilt; Email: [email protected];
In this paper, we concentrate on ZrO2 and HfO2. The latter, in particular, is
considered to be one of the most promising candidates for replacing SiO2 in
CMOS technology. One of great advantages of SiO2 has been the fact it forms
an amorphous oxide (a-SiO2), thus allowing it to conform to the substrate
with enough freedom to eliminate most electrical defects at the interface. ZrO2
and HfO2 can be grown as a metastable amorphous phase on Si using
low-temperature deposition techniques. Unfortunately recrystallization tends to occur during subsequent annealing steps that are typically required in current industrial fabrication processes, but it is possible that admixing (alloying) with Si, Al, N, or other chemical constituents may help stabilize the amorphous phase and thereby mitigate this problem [2].
With these motivations, we have embarked on a theoretical study of the struc-tural and dielectric and properties of polymorphic ZrO2 and HfO2 crystalline
structures, and of amorphous ZrO2 (a-ZrO2). Our calculations on crystalline
structures indicate that the behavior of ZrO2 and HfO2 is generally very
sim-ilar, so we expect that our work on a-ZrO2 will be representative of a-HfO2 as
well.
2 Computational technique
The calculations where carried out within state-of-the-art density functional theory (DFT) methods [3] in the local-density approximation (LDA) [4]. Molec-ular dynamics simulation were carried out with the ab-initio VASP code [5] based on the plane wave formalism with ultrasoft pseudopotentials [6]. The ART [7] technique has been implemented in the pseudopotential localized-basis SIESTA code [8], which gives results of similar quality to plane waves at a much smaller computational cost. Technical details can be found in a series of earlier papers [9].
3 Crystalline ZrO2 and HfO2
We investigated three crystalline phases of ZrO2 and HfO2: the high
temper-ature stable cubic structure (of CaF2 type), the tetragonal phase, and the
room-temperature stable monoclinic phase. Good agreement was found with experimental structures and zone center lattice vibrational frequencies [9]. The computed Born effective charges and the mode eigenvectors were used to de-compose the lattice dielectric susceptibility tensor into contributions arising from individual infrared-active phonon modes.
de-Phase ZrO2 (expt.) HfO2 (expt.)
cubic 37 (35-50) [11] 29
tetragonal 47 (35-50) [11] 70
monoclinic 20 16 (16-45) [12]
Table 1
Average dielectric constant for three crystalline phases of ZrO2 and HfO2.
pendent on crystal phase. It is also highly anisotropic for low-symmetry phases, with an especially large dielectric response in the basal plane of the tetragonal structure, as analyzed in our previous publications [9]. The large dielectric constants arise from (i) the presence of relatively low-frequency polar phonon modes, and (ii) “anomalous” (i.e., supernominal) Born effective charges that result from hybridization [10] between O p and cation d states. Our results are consistent with the range of values reported experimentally [11,12].
4 Amorphous ZrO2
In order to obtain a realistic model of amorphous ZrO2, we carried outab-initio
molecular dynamics (MD) simulations of a 96-atom supercell in a melt-and-quench fashion via a series of constant-temperature simulations in which T is sequentially stepped up to about 4000K, allowing the sample to melt, and then sequentially reduced to room temperature. For each MD simulation, the system is given enough time to thermalize and to eliminate its correlation to the previous structure. We carried out the melt-and-quench procedure in 22 ps of simulation time, 11 ps upon heating and 11 ps upon cooling. The cooling rate (3.4×10¹⁴K/s) is far beyond the fastest cooling rate that can be obtained experimentally by laser techniques, as it is limited by the short time interval accessible to simulations. Nevertheless this is technique is well accepted and widely used for the generation of amorphous samples (e.g., for a-Si [13] and a-SiO2 [14]).
An important issue is the density of the amorphous phase, which, to our knowledge, is not accurately known experimentally. Thus, we performed a se-ries of independent melt-and-quench simulations, each with a different density fixed in the range from 4.34 g/cm3
to 5.96 g/cm3
. We found that for densi-ties greater than 5.3 g/cm3
the system recrystallizes upon cooling, supporting the experimental observation of the metastability of a-ZrO2 at low
temper-atures. Conversely, we found that for a density as low as 4.34 g/cm3
, the system formed a sort of disordered structures with voids and cavities. Among the initial guesses, we found that a density of 4.86 g/cm3
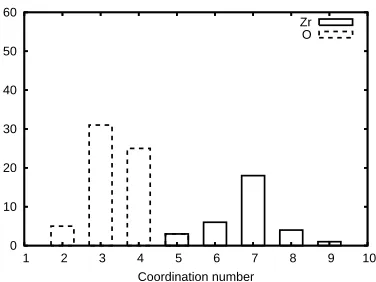
0 10 20 30 40 50 60
1 2 3 4 5 6 7 8 9 10 Coordination number
Zr O
Fig. 1. Distribution of coordination numbers at the end of the “melt-and-quench” MD simulation; Zr and O atoms are indicated by solid and dashed bars, respectively.
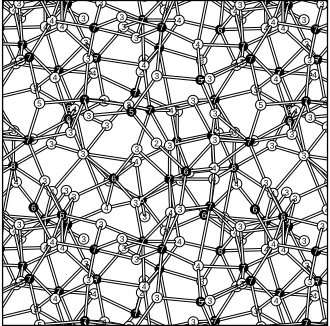
temperature, we analyzed the electronic, structural and dielectric properties of this structure.
The distribution of coordination numbers is shown in Fig. 1, and a snapshot of the system is shown in Fig. 2. A bond cutoff of 3 ˚A has been chosen for the determination of the coordination number. The average coordination number shows a prevalence of 7- and 6-coordinated Zr over 8-coordinated Zr and of 3-coordinated O over 4-coordinated ones.
Our theoretical amorphous model remains a good insulator with an electronic gap of order ∼3.4 eV; based on the well-known tendency of DFT-LDA to underestimate gaps, we may expect that the true gap is larger. In any case, the electronic density of states (not shown) indicates that the gap is clean of defect states, despite the amorphous nature of the material and the fairly broad distribution of coordination numbers of the atoms. The electronic contribution to the dielectric constant (∞) is similar to that of the crystalline phases,
while the Born effective charges (Z∗
) are smaller. On average Z∗
(Zr)=+5.0 and 6 7 7 7 5 8 8 7 3 3 3 4 3 3 3 4 3 3 3 3 3 7 5 6 6 7 7 7 5 8 7 7 8 8 7 3 3 3 3 3 4 4 3 3 3 4 5 4 3 3 4 3 4 3 2 4 3 3 3 4 2 3 3 3 7 5 6 8 7 7 3 3 3 4 4 3 3 5 4 4 3 2 4 3 3 4 2 7 7 7 6 6 7 7 7 6 7 6 7 7 5 8 8 7 3 3 4 4 3 3 3 4 4 4 4 3 3 3 4 3 4 3 3 4 4 3 3 3 3 3 3 3 4 3 3 4 3 7 6 7 6 7 7 7 7 7 6 6 7 6 7 7 7 6 7 5 6 6 7 6 7 7 5 8 7 7 8 8 7 3 3 3 3 3 3 3 4 4 4 4 3 4 3 3 3 4 3 3 4 3 4 4 4 4 4 3 3 3 3 3 3 3 4 3 5 4 3 3 4 3 4 3 4 4 3 2 4 3 3 3 3 3 4 3 3 2 3 3 4 3 3 4 3 7 6 7 6 7 7 7 6 7 7 7 6 7 5 6 8 7 7 3 3 3 3 3 4 4 4 3 4 3 3 4 3 4 4 3 3 3 3 3 3 5 4 3 4 3 4 2 4 3 3 4 3 2 7 7 7 6 6 7 7 7 6 8 3 4 4 3 3 4 4 4 4 3 3 4 4 4 3 3 3 3 4 3 4 6 7 6 7 7 7 7 7 6 6 7 6 7 7 7 6 7 6 8 3 3 3 3 3 4 4 4 4 3 4 3 3 4 3 4 4 4 4 4 3 3 3 3 4 3 3 4 4 3 3 3 3 3 4 3 4 6 7 6 7 7 7 6 7 7 7 6 7 3 3 3 3 4 4 4 3 4 3 4 4 3 3 3 3 3 3
0.00 0.03 0.06 0.09 0.12
0 150 300 450 600 750 900
g(
ω
)* (Z
*/ω
)
2
ω (cm-1)
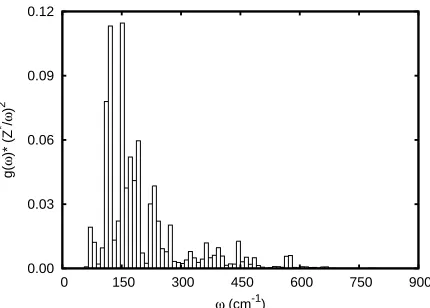
Fig. 3. Infrared activity (i.e., DOS g(ω) weighted by Ze∗2
/ω2
) of phonon modes in model resulting from “melt-and-quench” MD simulation.
Z∗
(O)=−2.5, compared to average values of Z∗(Zr)=+5.4 and Z∗(O)=−2.7 in the crystalline phases. The dependence of the atomic Born charges on the local environment will be presented elsewhere [15].
We then computed the optical phonon frequencies and eigenvectors, and com-bined this with the atomic Z∗
information to get mode Z∗
s and dielectric (infrared) activities. The smaller Born effective charges yield somewhat lower dielectric activities for the phonon modes than in the crystalline phases, and we obtain an overall (orientation-averaged) lattice dielectric constant oflatt =
17.6. Combining this with our computed orientation-averaged value of the elec-tronic contribution (∞= 4.6), we arrive at a value of0 = 22.2 for the average
dielectric constant of a-ZrO2.
We also performed a spectral decomposition of the lattice dielectric constant and found that the strongest contributions come from low-frequency phonon modes between about 50 and 200 cm−1
, as shown in Fig. 3.
5 Activation-relaxation simulations
and this event-based technique therefore allows a much faster simulation.
We implemented the ART method in the ab-initio code SIESTA [8]. This code utilizes a localized-orbital basis, allowing the retention of good accuracy in DFT calculations at a strongly reduced computational cost. A single-ζ basis set was optimized [16] in order to reproduce the correct energy order of the cubic, orthorhombic and monoclinic phases of ZrO2. A cutoff of 150 Ry was
used for the expansion of the charge density.
The flowchart of the ART method, as implemented by us, is as follows.
(1) Start from a local minimum structure.
(2) (Activation:) Choose one atom at random and displace it in a random direction by a maximum amount of 0.3 ˚A.
(a) Perform a conjugate-gradient structural minimization with modified forces
gi =fi−(1 +α)(fi·∆ˆri)∆ˆri, (1)
where the index i runs over all the atoms, α= 0.15, and
∆ri =ri(actual)−ri(previous local minumum). (2)
(b) Stop when (fi·∆ˆri) changes sign. (c) Cross the barrier: ri =ri+ 0.05∆ri.
(3) (Relaxation:) Perform a conjugate-gradient structural minimization with unmodified forces and converge to a new local minimum.
(4) Compute the energy difference between the new local minimum and the previous one.
(5) Accept or reject the new configuration according to the Metropolis Monte-Carlo criterion with a fictitious temperature factor β.
(6) Go back to step 2.
The activation step is based on the physical observation that when the system is deep in the basin of attraction of a local minimum, the restoring force is nearly parallel to the multidimensional vector connecting the actual config-uration to the local minimum, Eq. (2). In order to escape from the basin of attraction, the restoring force has to be projected out from the force acting on the system, Eq. (1). This simple procedure causes the system to move towards a saddle point and to sample neighboring local minima efficiently. Step (2c) prevents falling back into the previous basin of attraction.
0 10 20 30 40 50 60
1 2 3 4 5 6 7 8 9 10 Coordination number
Zr O
Fig. 4. Distribution of coordination numbers at the end of the activation-relaxation (ART) simulation; Zr and O atoms are indicated by solid and dashed bars, respec-tively.
trials, the acceptance ratio was higher (∼0.4) and dropped down in the sub-sequent trials. We did not attempt to perform longer simulations at a lower MC temperature in order to “anneal” the system further.
The ART simulation was performed at constant volume corresponding to a density of 4.86 g/cm3
. A snapshot of the system is essentially indistinguishable, at the visual level, from that of the melt-and-quench MD-generated system of Fig. 2. The corresponding distribution of coordination numbers is shown in Fig. 4. The average coordination number still shows a prevalence of 7- and 6-coordinated Zr over 8-6-coordinated Zr, but the number of 3- and 4-6-coordinated oxygens is now nearly the same, as in the monoclinic structure. Furthermore, the calculated phonon spectrum extends over approximatively the same range of frequencies (50-800 cm−1
) and shows features similar to those of the sample obtained by melt-and-quench MD simulation. The computed Born effective charges are slightly larger on average, Z∗
(Zr)=+5.08 and Z∗
(O)=−2.54, but the lattice dielectric constant is 16.5, compared to the value of 17.6 of the MD-generated model, due to the fact that the vibrational spectrum is shifted to slightly higher wavenumbers. Assuming a similar value for the high-frequency dielectric constant (∞), the static dielectric constant yields a value of∼21, in
good agreement with experimental values and with the previous calculation.
6 Conclusion
also be used for studying diffusion processes in solids, and for the generation of amorphous slabs interfaced with crystalline materials.
Acknowledgments
This work was supported by NSF Grant DMR-0233925.
References
[1] International Technology Road-map for Semiconductors, 2001 Ed.
http://public.itrs.net/.
[2] J. Zhu and Z. G. Liu, Appl. Phys. A-Materials Science and Processing 78 (2004) 741.
[3] P. Hohenberg and W. Kohn, Phys. Rev. 136 (1964) 864; W. Kohn and J. L. Sham, Phys. Rev. 140 (1965) 1133.
[4] D. M. Ceperley and B. J. Alder, Phys. Rev. Lett. 45 (1980) 566.
[5] G. Kresse and J. Hafner, Phys. Rev. B 47 (1993) 558; G. Kresse and J.
Furthm¨uller, Phys. Rev. B 54 (1996) 11169.
[6] D. Vanderbilt, Phys. Rev. B 41 (1990) 7892.
[7] G. T. Barkema and N. Mousseau, Phys. Rev. Lett. 77 (1996) 4358; N. Mousseau and G. T. Barkema, Phys. Rev. B 61 (2000) 1898.
[8] J.M. Soler, E. Artacho, J.D. Gale, A. Garc´ıa, J. Junquera, P. Ordej´on, and D. S´anchez-Portal, J. Phys. Cond. Matter 14 (2002) 2745.
[9] X. Zhao and D. Vanderbilt, Phys. Rev. B. 65 (2002) 075105; X. Zhao and D. Vanderbilt, Phys. Rev. B. 65 (2002) 233106.
[10] G.Lucovsky and R.M. White, Phys. Rev. B. 8 (1973) 660.
[11] A. Feinberg and C. H. Perry, J. Chem. Phys. Solids 42 (1981) 513.
[12] E. P. Gusiev, E. Cartier, D. A. Buchanan, M. Gribelyuk, M. Copel, H. Okorn-Schmidt and C. D’Emic, Microelectron. Eng. 59 (2001) 341; K. Kukli, J. Ihanus, M. Ritala and M. Leskela, Appl. Phys. Lett. 68 (1996) 3737.
[13] F. H. Stillinger and T. A. Weber, Phys. Rev. B 31 (1985) 5262.
[14] J. Sarnthein A. Pasquarello and R. Car, Phys. Rev. Lett. 74 (1995) 4682.
[15] X. Zhao, D. Ceresoli, and D. Vanderbilt, Phys. Rev. B (in press).