Powertrain parameter matching and optimal design of dual-motor driven
electric tractor
Yanni Chen
,
Bin Xie
*,
Yuefeng Du
,
Enrong Mao
(College of Engineering, China Agricultural University, Beijing 100083, China)
Abstract: The rationality of powertrain parameter design has a significant influence on the traction performance and economic performance of electric tractor. At present, researches on powertrain parameter design mainly focus on electric vehicles, and electric agricultural machinery draw much less attention. Therefore, a method of powertrain parameter matching and optimization design for electric tractor was proposed in this paper, which was based on dual-motor coupling drive mode. The particle swarm optimization (PSO) algorithm based on mixed penalty function was used for parameter optimization. Parameter optimization design was programmed using MATLAB. A simulation dynamic model with optimization design variables of electric tractor powertrain was established based on MATLAB/Simulink. Compared with the simulation results before optimization, the objective functions were optimized and the traction performance of electric tractor was improved, which indicated the effectiveness of the proposed method.
Keywords: electric tractor, parameter matching design, parameter optimization design, powertrain, traction performance DOI: 10.25165/j.ijabe.20191201.3720
Citation: Chen Y N, Xie B, Du Y F, Mao E R. Powertrain parameter matching and optimal design of dual-motor driven electric tractor. Int J Agric & Biol Eng, 2019; 12(1): 33–41.
1 Introduction
With the deterioration of environments and increase of energy depletion, developing agriculture with environmental friendliness, resource conservation and high efficiency is prospective and necessary. Some special agricultural environments such as greenhouse and courtyard agriculture, have more and more urgent needs for agricultural machineries with zero emission, no pollution and low noise.
As one kind of green agricultural machineries, electric tractor has attracted more and more attention. At present, electric tractor on research can be mainly classified as hybrid electric tractor and pure electric tractor, distinguished on the power source and drive machine. This research studied pure electric tractor to realize zero emission. Powertrain is the core system of electric tractor. The drive mode and powertrain parameters have significant influence on traction performance and economic performance. Limited by battery capacity, pure electric tractor has the disadvantage of short working duration time. Therefore, the rationality of powertrain parameter design is critical to improve tractor efficiency and enhance working duration time. Arjharn et al.[1] fabricated a pure electric tractor by converting a 20 kW diesel tractor, and tested its energy consumption and drawbar pull characteristics. Bodria et al.[2] respectively designed an AC motor driven prototype and a DC motor driven one of walking tractor, and conducted hoeing,
Received date: 2017-08-14 Accepted date: 2018-09-24
Biographies: Yanni Chen, PhD, research interest: agricultural machinery design and control theory, Email: [email protected]; Yuefeng Du, Associate Professor, research interest: agricultural machinery digital design, Email: [email protected]; Enrong Mao, Professor, research interest: vehicle intelligent control, Email: gxy15@ cau.edu.cn.
*Corresponding author: Bin Xie, Associate Professor, research interest: intelligent control, digital design and electro-hydraulic control in agricultural machinery. College of Engineering, China Agricultural University, P.O. Box 47, 17 Qinghua East Road, Haidian District, Beijing 100083, China. Tel: +86-10-62736730 ext.315, Email: [email protected].
transporting and mowing test. Gao et al.[3] proposed a method of powertrain matching design based on one-motor driven mode. Xu et al.[4] proposed a method of series hybrid electric powertrain design under ploughing condition, and conducted bench test to verify the traction performance.
At present, there are few researches on powertrain optimization design of electric tractor. Relevant researches mainly focus on electric vehicles. Zhang et al.[5] proposed an optimization approach based on minimizing the energy loss of two motors, gear system and wet clutch, and applied dynamic programming algorithm to locate the optimal control strategy. Mozaffari et al.[6] established objective functions based on total energy cost of gasoline and electricity together with the trip cost, and respectively implemented synchronous self-learning Pareto strategy and elitism non-dominated sorting genetic algorithm to optimize component size. Wu et al.[7] established an optimal problem aiming at reducing the fuel consumption, exhaust emissions and manufacturing cost of hybrid electric vehicle. However, the working conditions are quite different between agricultural machineries and vehicles. The optimization objectives of electric tractor relatively differ from that of electric vehicle. It’s necessary and meaningful to study the method of powertrain parameter design for electric tractor.
In this research, the drive mode of electric tractor was designed as dual-motor coupling drive. This drive mode has advantages over single motor drive mode. When electric tractor is driven by single motor, it prefers selecting a motor with larger power, due to the heavy load requirement. This will result in low efficiency under low load working conditions. For the same power requirement, dual-motor coupling drive mode can relatively reduce the capacity of each motor, which is conducive to increase motor load rate and efficiency, and improve traction and economic performance of electric tractor under different working conditions.
reference values to the design of electric agricultural machinery.
2 Dual-motor coupling drive
The drive structure should be designed to meet the needs of working conditions. Working conditions of small electric tractor can be classified as low speed work, basis working and transport work[8]. Low speed operation mainly includes rotary tillage, planting, ditching, bulldozing and shovel. The running speed ranges from 0.5 km/h to 4 km/h. Basis operation mainly includes ploughing, harrowing, sowing, cultivation and harvest. The running speed ranges from 5 km/h to 9 km/h. Transport operation mainly tows trailer. The running speed ranges from 15 km/h to 20 km/h on the field, and from 20 km/h to 30 km/h on the road.
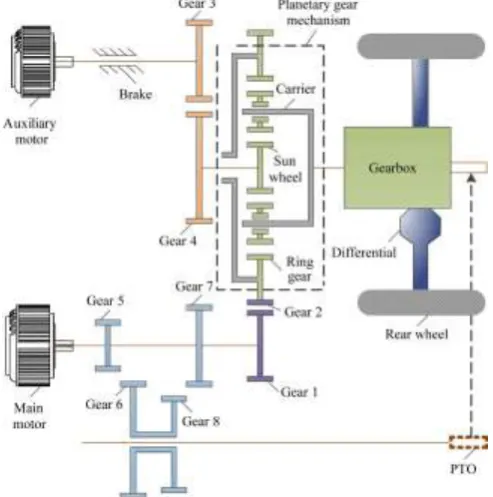
According to the working conditions, the output power of electric tractor is mainly transmitted to two directions, the first is drive wheels, and the second is power take-off (PTO). So the dual-motor drive structure is designed as speed coupling with planetary gear mechanism[9]. The drive machines are composed of main motor and auxiliary motor. The scheme diagram of drive structure is shown in Figure 1. This drive structure has two drive modes: dual-motor speed coupling drive mode (when the brake is disengaged) and main motor drive mode (when the brake is engaged).
Figure 1 Scheme diagram of dual-motor coupling drive structure
The coupling mechanism is composed of one planetary gear mechanism and four sets of fixed axis gears 1 to 8. Main motor is connected with ring gear by fixed axis gears 1-2. Auxiliary motor is connected with sun wheel by fixed axis gears 3-4. The planetary carrier outputs coupling power. The coupling power is transmitted to rear drive wheels after the deceleration of gearbox and differential[10]. Simultaneously, the main motor is connected with PTO by fixed axis gears 5-6 or 7-8 to drive rotary implements. The brake can lock the sun wheel to transform planetary gear mechanism into a fixed axis gear train. Thus, the main motor can drive electric tractor on its own. The advantage of this drive structure is that, when PTO needs to work, main motor can output constant speed to satisfy the national standard speed of PTO, meanwhile the running speed of electric tractor can be changed by regulating auxiliary motor speed. Simultaneously, when the drive
power is all transmitted to the drive wheels, auxiliary motor can regulate its speed to keep main motor in high efficiency range. This not only improves motor efficiency, but also makes running speed meet different operation requirements.
3 Powertrain parameter matching design of electric
tractor
Powertrain parameter matching design aims at meeting the power requirement of electric tractor primarily, and improving economic performance, by limiting the amount of battery supply and powertrain losses. The critical parameters can be calculated by analyzing the performance of key components, so that each component could achieve the best matching.
3.1 Traction performance of electric tractor
Traction performance reflects the drive ability of tractor, and it’s mainly evaluated by rated traction force and traction power. Rated traction force is determined by traction resistance during work. Traction resistance shouldn’t exceed the rated traction force, otherwise the running speed will be too low to reduce the productivity, and the slip ratio will be too high to reduce the traction efficiency and damage the soil aggregate structure.
The traction equilibrium equation of electric tractor during operation is:
FD=FT+Ff (1)
where, FDis the drive force, N; FTis the traction resistance, N; Ffis
the rolling resistance of wheels, N.
As plowing is the most common and heaviest load work, the rated traction force should take the plowing power needs as priority[11]. The equation of traction resistance for plowing is:
FT=z·b0·h0·k0 (2) where, z is the number of plows; b0 is the width of each plows, cm; h0 is tilling depth, cm; k0 is the soil specific resistance, N/cm2.
Considering the load fluctuation during work, the rated traction force should generally be 10%-20% higher than traction resistance, so the rated traction force FTn (N) can be expressed as:
(1.1 ~ 1.2)
Tn T
F F (3)
Rated traction power PTn (kW) is defined as:
( )
3600
Tn f T
Tn
F F v
P
(4)
where, vT is the running speed of electric tractor, km/h.
Traction efficiency ηT is defined as the ratio of traction power
to corresponding motor power:
T T
m
P P
(5)
where, PTis traction power, kW; Pm is corresponding motor power,
kW.
The factors affecting the traction efficiency mainly include mechanical loss of transmission mechanism ηmech, slip loss of drive
wheels ηδand rolling resistance loss ηf[12]. The traction efficiency
can be expressed as:
ηT=ηmechηδηf (6)
3.2 Rated power of main motor and auxiliary motor
The rated power of main motor should meet PTO power requirement. Small electric tractor used in facility gardening was taken as this study’s research object, so rotary tillage was a common PTO work[13]. Therefore, the rated power of main motor was designed for power consumption of rotary tillage. The average power consumption of rotary tillage is calculated by the equation of soil specific resistance[14]:
where, PXis the power consumption of rotary tillage, kW; Kλis the
specific resistance of rotary tillage, N/cm2; vw is electric tractor
running speed, km/h; B is working width, m.
Considering that the main motor power flows into two directions and the load keeps fluctuating during work, the rated power of main motor should be increased by 20%-30%:
1_ (1.2 ~ 1.3)
m n X
P P (8)
where, Pm1_nis the rated power of main motor, kW.
Then the rated power of auxiliary motor can be calculated:
2 _ 1_
Tn
m n m n
T
P
P P
(9)
where, Pm2_nis the rated power of auxiliary motor, kW.
Brushless DC (BLDC) motor was selected as the motor type. BLDC motor has the advantages of high starting torque, strong overload capability, high efficiency and large power density[15], which are suitable for electric tractor’s working environment[16]
. BLDC motor shows constant torque characteristics below the rated speed, and shows constant power characteristics above the rated speed. As electric tractor’s working characteristics are generally low speed and heavy load, it is ideal for motors to work in constant torque area.
3.3 Battery capacity
When both motors output the rated power, the corresponding battery rated power is:
1_ 2 _
1_ 2 _
+
m n m n
bn
m ave m ave
P P
P
(10)
where, Pbnis the battery rated power, kW; ηm1_aveand ηm2_aveare the
average output efficiency of main motor and auxiliary motor respectively.
Battery energy is defined as:
0 1000 bn b
P t
W
(11)
where, Wbis the battery energy, Wh; t0 is the ideal continuous working time when electric tractor outputs rated power, h; ζ is the depth of discharge.
So the battery capacity can be expressed as:
b b
W C
U
(12)
where, Cbis the battery capacity, A·h; U is the voltage of battery.
3.4 Gear number of the gearbox
For small electric tractor, large gear number will lead to complex structure, increased weight and cost. Besides, compared with fuel engine, motor has superior speed regulating characteristics, so the gear number need not too much.
Therefore, the gearbox is designed with four gears, including low speed working gear, basis working gear and low load working gear. Among which, the low speed working gear is set as the first gear, it mainly runs under low speed working conditions. The basis working gears are composed of two gears that set as the second gear and the third gear, which mainly work under basis working conditions. Low load working gear is set as the fourth gear, which mainly runs under transport working conditions and low load working conditions.
4 Transmission relationships of powertrain
The gear ratios of coupling mechanism and gearbox affect the rationality of torque and speed coverage for electric tractor, influence the working efficiency of motors, and determine the quality of field work. This section is divided into three parts to
analyze the transmission relationship of the powertrain. 4.1 Transmission relationships of coupling mechanism
According to the kinematic characteristics of planetary gear mechanism, the torque and speed relationship among sun wheel, ring gear and planetary carrier can be expressed as:
1
(1 )
s r c
k
T k T T
k
(13)
1 1
s r
c
n kn
n
k k
(14)
where, Tsis the input torque of sun wheel, Nm; Tr is the input
torque of ring gear, Nm; Tcis the output torque of planetary carrier,
Nm; k is the characteristic parameter of planetary gear mechanism;
nsis the input speed of sun wheel, r/min; nr is the input speed of
ring gear, r/min; ncis the output speed of planetary carrier, r/min.
It can be seen from Equation (13) that the input torques Tsand
Trare proportional. The relationship of the gear ratios between
input and output of coupling mechanism can be expressed as:
1 1 2 2
1
(1 )= c
m m m m
coup
k T
T i T i k
k
(15)
1 2 1 2 1 1 1+ m m c m m
n k n
n
i ki k (16)
where, Tm1 is the torque of main motor, Nm; Tm2 is the torque of auxiliary motor, Nm; im1 is the gear ratio of fixed axis gears 1-2; im2 is the gear ratio of fixed axis gears 3-4; ηcoupis the transmission
efficiency of coupling mechanism; nm1 is the speed of main motor, r/min; nm2 is the speed of auxiliary motor, r/min.
4.2 Transmission relationships between motors and drive wheels
Parameter design should ensure the motors to work in constant torque area, and keep motors working in high efficiency range. When electric tractor is on dual-motor speed coupling drive mode, according to Equations (13) and (14), the relationship of torque and speed between motors and drive wheels can be expressed as:
1 1 2 2
0
( )
1
(1 ) T f w
m m m m
g mech
F F r
k
T i T i k
k i i
(17)
0
1 2
1 2
1
1 1+ 2 0.06 (1 )
w g
m m
m m w
v i i
n k n
i k i k r
(18)
where, ig is the gear ratio of gearbox; i0 is the gear ratio of final drive; rw is the dynamic radius of drive wheels, m; δ is the slip rate
of drive wheels.
When electric tractor is on main motor drive mode, the relationship of torque and speed between motors and drive wheels can be expressed as:
1 1
0
( )
1 T f w
m m
g mech
F F r
k
T i
k i i
(19)
0 1
1 (1 ) 2 0.06 (1 )
w g
m
m w
v i i
n k
i k r
(20)
4.3 Transmission relationships between coupling mechanism and gearbox
Describe according to the gear of gearbox respectively. (1) Low speed working gear
relationship can be obtained according to Equation (18):
1_ 2 _ 1
1 2 1 0
1
(1 ) 2 0.06 (1 )
m n m n wn
m m w
n k n v
i i i i k r
(21)
where, nm1_nis the rated speed of main motor, r/min; nm2_nis the
rated speed of auxiliary motor, r/min; i1 is the gear ratio of the first gear.
(2) Basis working gear
In basis working gear, the ideal situation is that each motor’s torque is equal to or less than the rated torque under different kinds of basis working conditions. This situation can be realized by continuously variable transmission. For the design of two gears in this paper, optimization design should ensure that each motor’s torque varies between the rated torque and minimum ideal torque in each gear so that the driving force of electric tractor in each gear can be connected rationally[17]. The gear ratios are decided by geometric progression, which means that the minimum load coefficient in each gear is equal to each other for guaranteeing the same range of motor output torque:
min min
c
cn
T k
T
(22)
where, kmin is the minimum load coefficient; Tcmin is the output torque of planetary carrier when both motors output their minimum ideal torque; Tcn is the output torque of planetary carrier when both
motors output their rated torque.
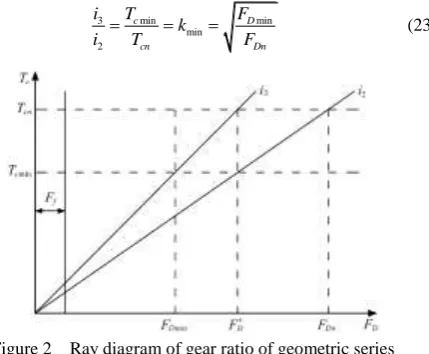
The ray diagram of geometric progression ratios is shown in Figure 2. When driving force varies between the intermediate value F′D and rated value FDn, electric tractor should work in second
gear. When driving force varies between the minimum value
FDmin and intermediate value F′D, electric tractor should work in
third gear. In second gear, the output torque of planetary carrier decreases from Tcn to Tcmin with the decrease of FD, then the
gearbox should change to the third gear, and output torque of planetary carrier increases to Tcn again[8]. The relationship of gear
ratios can be expressed as:
3 min min
min 2
c D
cn Dn
i T F
k
i T F (23)
Figure 2 Ray diagram of gear ratio of geometric series
To guarantee that electric tractor can always provide sufficient driving power, the coupling torque should be not less than the rated driving force when motors output their rated torque in second gear. According to Equation (17), the relationship can be expressed as:
1_ 1 2 0
1 Dn w
m n m
mech
k F r
T i i i
k
(24)
As it has been known that the torque of auxiliary motor is proportional to the one of main motor, so here it will not be reiterated.
(3) Low load working gear
In low load working gear, the gear ratios of powertrain are
restrained by maximum speed requirement on dual-motor drive mode. According to Equation (18), the relationship can be expressed as:
1_ max 2 _ max max
1 2 4 0
1
(1 ) 2 0.06 (1 )
m m w
m m w
n k n v
i i i i k r
(25)
where, nm1_max is the maximum speed of main motor, km/h; nm2_max is the maximum speed of auxiliary motor, km/h; vwmax is the maximum speed of electric tractor, km/h.
Through the analysis above, the gear ratios k, im1 and im2 of coupling mechanism, and gear ratios i1, i2, i3 and i4 of gearbox, interact with each other, and they can not be calculated directly by the formulas above. Therefore, optimization design is needed to assign these parameters. This will be studied in Section 5.
5 Powertrain parameter optimization design of
electric tractor
5.1 Optimization design variables
As analyzed above, optimization design variables include fixed axis gears 1-2 ratio im1, fixed axis gears 3-4 ratio im2, planetary gear characteristic parameter k, and gearbox ratios i1, i2, i3 and i4.
5.2 Optimization objective functions
Powertrain parameter optimization design aims to develop the optimal drive capability and improve the traction performance of electric tractor, simultaneously increase the output efficiency of powertrain and improve the economic performance of electric tractor. According to previous analysis, the traction performance under basis working conditions is a priority and motor power should be fully utilized. Under low speed working and transport working conditions, the optimal economic benefit should be obtained on the premise of satisfying the running speed. Besides, the efficiency of planetary gear mechanism which has influence on the economic performance, is related to the gear ratios of powertrain. Therefore, the drive power utilization ratio[18] is taken as optimization objective aiming to optimize the traction characteristics; The continuous working time[19] and the efficiency of planetary gear mechanism are taken as optimization objectives aiming to optimize economic characteristics.
5.2.1 Drive power utilization ratio
The drive power utilization ratio indicates the utilization efficiency of motor drive power when electric tractor works on field[20,21]. It reflects the proximity between the actual traction characteristics and the ideal power characteristics of powertrain[18].
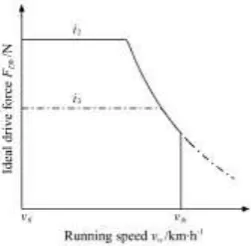
The powertrain with ideal power characteristics can make motors output the maximum power in the external characteristics condition at any running speed, and the changing trends of two motors with running speed are corresponding, as shown in Figure 3. So the ideal drive force is:
1max 2 max
0
3600( m m ) T
D
w
P P
F
v
(26)
where, FD0 is the ideal drive force of electric tractor, N; Pm1max is the maximum value of power in the external characteristics condition of main motor, kW; Pm2max is the maximum value of power in the external characteristics condition of auxiliary motor, kW; ηTis the traction efficiency of electric tractor.
The area S0i enclosed by the ideal driving force curve and
running speed in second gear or third gear can be expressed as:
1max 2 max
0 0
( )
3600
ih ih
il il
v v
m m T
i v D i w v w
w
P P
S F dv dv
v
(27)
gear, N; vih is the high limit of running speed in ith gear, km/h; vil is
the low limit of running speed in ith gear, km/h.
Figure 3 Curve of ideal drive force with running speed
The actual traction characteristics of electric tractor will be in the best driving state when both motors output the maximum torque in the external characteristics condition. The area SDi
enclosed by the torque of motor and running speed in second gear or third gear can be expressed as:
1max 1 0
1 1
ih
il v
Di v m m g mech w
w
k
S T i i i dv
k r
(28)
where, Tm1max is the maximum value of torque in the external characteristics condition of main motor, Nm.
Therefore, the drive power utilization ratio in ith gear can be formulated as:
1max 1 0
1max 2 max
0 1 1 ( ) 3600 ih il ih il v
m m g mech w
v
Di w
Di v
m m T
i
w v
w
k
T i i i dv
S k r
P P S dv v
(29)5.2.2 Continuous working time
Electric tractor generally works at fixed running speed, and the demand for speed changing is relatively low. Therefore, continuous working time at a constant running speed is taken as the optimization objective[22]. Motor efficiency is the main factor that affects continuous working time. Keeping motor speed and torque in high efficiency range is an effective way to increase continuous working time and improve the economic performance of electric tractor.
Under low speed working conditions, motor rated speeds nm1_n
and nm2_nare taken as the calculating values of continuous working
time. According to Equation (17), continuous working time t1 can be expressed as:
0 1
1 1_ 2 2 _
1 2
1 1
1000
9549 9549
m m n m m n
m m
W t
T n T n
(30)
where, W0 is the rated output power of battery, W·h; ηm1 is the output efficiency of main motor; ηm2 is the output efficiency of auxiliary motor; and they are assigned according to the motor efficiency MAP, that is, ηm1=ηm1(Tm1, nm1) and ηm2=ηm2(Tm2, nm2). Motor torques Tm1 and Tm2 are calculated by the values of optimization design variables assigned in each optimization cycle.
Under transport working conditions, continuous working time is respectively considered on main motor drive mode and dual-motor coupling drive mode. Define the rated running speed
vnw4=15 km/h on main motor drive mode. According to Equations (19) and (20), continuous working time t4 can be expressed as:
0 4 1 1 1 1 1000 9549 m m m W t T n (31)
Define the rated running speed v′nw4=20 km/h on dual-motor coupling drive mode, and main motor outputs the rated speed. Then the auxiliary motor speed can be obtained from Equation (18). According to Equations (17) and (18), continuous working time t′4 can be expressed as:
0 4
1 1_ 2 2
1 2
1 1
1000
9549 9549
m m n m m
m m
W t
T n T n
(32)
Since the order of magnitude of t1, t4 and t′4 are not the same with other sub objective functions. So divide the three by target values t1tar, t4tar and t′4tar to unify every sub objective function’s
unit[23]. The three target values are defined as the corresponding continuous working time when motor efficiencies equal to 100%. 5.2.3 Efficiency of planetary gear mechanism
The efficiency of planetary gear mechanism affects the rationality of parameter design and the economic performance of powertrain[5]. The rated speed nm1_n and nm2_n are taken as the
calculating values for efficiency, and it can be expressed as[24]:
1 2 _ 2 1_
_
1 2 _ 2 1_
( )
1 (1 )
(1 )( )
m m n m m n c
sr c sr
m m n m m n
k i n i n
k i n ki n
(33)
where, ηsr_cis the efficiency when the power inputs from sun wheel
and ring gear, and outputs from planetary carrier; ηcsr is the
efficiency when the power inputs from sun wheel and outputs from ring gear, with the planetary carrier fixed.
5.2.4 Transformation of optimization objective function
Mathematical model of optimization design can be expressed as:
min ( )
. . ( ) 0, 1, 2,
( ) 0, 1, 2,
n
i
j
F x x R
s t h x i s
g x j t
(34)
where, F(x) is the unified objective function; x is a set of design variables; Rn is the n-dimensional solution of variable space; hi(x) is
the equality constraint; gj(x) is the inequality constraint; s is the
number of equality constraints; t is the number of inequality constraints.
As the parameter optimization design is a multi-objective optimization problem, the weighted combination method is used to transfer multi-objective functions into a single objective function[25]. The expression is:
1 1 2 2 3 3
4 4 5 5 6 6
( ) ( ) ( ) ( )
( ) ( ) ( )
F x w f x w f x w f x
w f x w f x w f x
(35)
where, wi(i=1,2,6) is the weighting factor, wi∈[0,1] and
6 1 1 i i w
. Their values are determined by the importance of sub objective functions.5.3 Optimization constraints
5.3.1 Allowable adhesion force constraint
The driving force of electric tractor is limited by the allowable adhesion force[26]. When the total driving resistance exceeds the allowable adhesion force, electric tractor can not generate sufficient driving force to overcome the driving resistance, even if the motor torque is adequate enough[8]. As the maximum driving force is generally generated under the plowing work, so the driving force in second gear is limited by the following constraint when both motors output the rated torque:
1_ 1 2 0
1
m n m mech N w
k
T i i i F r
k
where, FφN is the allowable adhesion force.
5.3.2 Torque constraint between main motor and auxiliary motor According to Equation (15), the relationship between the main motor torque and the auxiliary motor torque is proportional. Therefore, in order to ensure the rated torques of two motors still follow this relationship, the constraint can be expressed as:
1
1_ 2 _ 2 0
m
m n m n m
i
T T i
k
(37)
5.3.3 Powertrain ratio relationship constraints
According to Section 4.3, the powertrain ratio relationship constraints include Equations (21), (23), (24) and (25).
On the basis of above analysis, the optimization constraints include both equality constraints and inequality constraints. Among which, Equations (21), (23) and (37) are equality constraints, and Equations (24), (25) and (36) are inequality constraints.
6 Optimization algorithm
Particle swarm optimization (PSO) algorithm based on mixed penalty function is used as the optimization algorithm.
6.1 PSO algorithm
PSO algorithm is a kind of intelligent global optimization algorithm based on population iteration. It was first introduced by Kennedy and Eberhart[27] in 1995. In PSO, a population of particles flies in feasible solution space to arrive at a position that can get an optimal solution. Each particle’s velocity is dynamically adjusted based on its personal best position and the population’s group best position[28]
. When all particles’ positions are updated, they move into the next iteration. Gradually, the whole population flies to the direction with better fitness just like the foraging behavior of birds.
Define that the population size is N, and search space is D. Each particle i is associated with a position vector xi=(xi1, xi2, …xiD)
and a speed vector vi=(vi1, vi2, …viD). All particles update
themselves as following equations:
1 1
2 2
( 1) ( ) ( ( ) ( ))
( ( ) ( ))
id id i id
i id
v k wv k c r pBest k x k
c r gBest k x k
(38)
( 1) ( ) ( 1)
id id id
x k x k v k (39)
where, k is the iteration number; pBesti(k) is the personal best
position of particle i till iteration k; gBesti(k) is the group best
position of the whole population till iteration k; c1 and c2 are learning factors; r1 and r2 are random parameters which are chosen uniformly within the interval [0,1]; vid is generally within the range
of [–vmax, +vmax]; w is inertia weight to determine the effect of particle’s velocity on the direction of motion. This paper adopted LDIW strategy[29] to assign w. This strategy linearly decreases w
during iteration.
6.2 Mixed penalty function
In this paper, powertrain parameter optimization design is a constrained nonlinear optimization problem. So mixed penalty function is adopted to transform the constrained problem into unconstrained problem. The optimal solution of unconstrained problem can be obtained to approach the solution of original problem. Mixed penalty function combines the external penalty function with internal penalty function method. For the optimization problem of Equation (34), the augmented objective function with mixed penalty function is:
21 1
1 1
( , ) ( ) ( )
( )
m n
k k
i k
i j j
P x r F x h x r
g x
r
(40)
where, rk is penalty factor on the kth iteration, rk>0, and rk+1=crk,
c is reduction factor, and 0<c<1. Equation (40) is the fitness equation of PSO.
7 Results and discussion
7.1 Main parameters
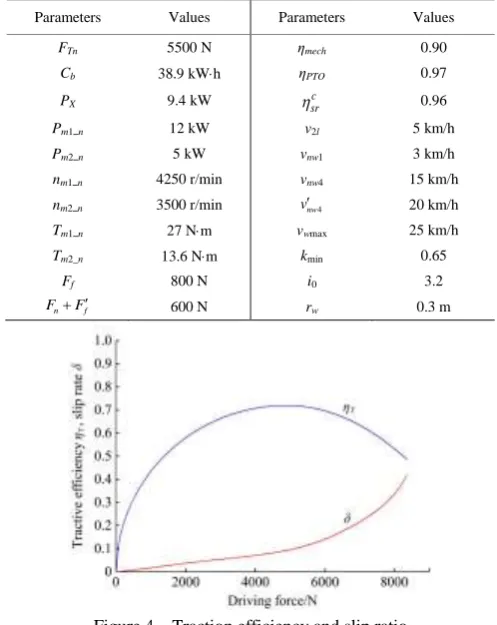
The main parameters of electric tractor powertrain are as shown in Table 2. The curves of traction efficiency ηT and slip
ratio δ with driving force are shown in Figure 4.
Table 2 Main parameters of electric tractor powertrain
Parameters Values Parameters Values
FTn 5500 N ηmech 0.90
Cb 38.9 kWh ηPTO 0.97
PX 9.4 kW src 0.96
Pm1_n 12 kW v2l 5 km/h
Pm2_n 5 kW vnw1 3 km/h
nm1_n 4250 r/min vnw4 15 km/h
nm2_n 3500 r/min vnw4 20 km/h
Tm1_n 27 Nm vwmax 25 km/h
Tm2_n 13.6 Nm kmin 0.65
Ff 800 N i0 3.2
n f
F F 600 N rw 0.3 m
Figure 4 Traction efficiency and slip ratio
7.2 Optimization results
The parameter optimization design is programmed using MATLAB. The population size is set as 40. Iteration number is 500, c1 and c2 both equal to 2. Initial inertia weight is 0.9. The inertial weight that evolves to the maximum number of iterations is 0.4. vmax is set to 20% of each design variable’s range. In order to make design variables comply with existing technical requirements and meeting actual production needs, the range of variable values need to be bounded. During iteration process, the convergence of fitness is shown in Figure 5. Optimization results are shown in Table 3 together with design variable ranges and original design parameters of the electric tractor.
Table 3 Ranges and results of optimization design variables Optimization design
variables Ranges
Optimization results
Original design parameters im1 2<im1<3.5 3.05 2.96 im2 2<im2<3.5 2.39 1.7
k 1.5<k<3 2.54 2.55
i1 12<i1<20 14.79 5.11
i2 6<i2<14 5.68 3.49
i3 4<i3<11 3.69 2.33
i4 1<i4<3 2.37 —
7.3 Comparison and analysis 7.3.1 Values of objective functions
Values of objective functions before and after optimization are shown in Table 4. Among which, the value ηP2 before optimization corresponds to the drive power utilization ratio in first gear, and ηP3 before optimization corresponds to the one in second gear. And the value t1 before optimization corresponds to the continuous working time in first gear, and t4 corresponds to the one in third gear. As can be seen from Table 4, after optimization the drive power utilization ratios ηP2 and ηP3 are respectively increased by 14.8% and 9.1%. This indicates that when main motor and auxiliary motor output torque and speed in high efficiency range, the power transmitted to drive wheels is more adequate, which improves the traction characteristics of electric tractor. This also indicates that, when the working load is in the rated load range, both motors can be guaranteed to output power in the rated value range with higher efficiency, which improves the economic performance of electric tractor. After optimization, continuous working time t1 is increased by 25.5%, which indicates that both motors’ efficiencies are higher than those before optimization when low speed working load is in the rated load range. Continuous working time t4 and t′4 after optimization do not have marked improvement compared with those before optimization. The rated running speed on main motor drive mode remains 15 km/h. The rated running speed on dual-motor coupling drive mode decreases from 23 km/h to 20 km/h. Planetary gear mechanism efficiency
ηsr_c is increased by 2% after optimization, which indicates that the
speed relationship among sun wheel, ring gear and planetary carrier is more rational.
Table 4 Objective function values before and after optimization
Objective functions Values before optimization Values after optimization
ηP2/% 86.73 99.55
ηP3/% 91.17 99.51
t1/h 2.51 3.15
t4/h 7.09 7.07
t′4/h 4.18 4.15
ηsr_c/% 99.76 99.96
7.3.2 Traction performance of electric tractor
A dynamic simulation model of electric tractor powertrain is established based on MATLAB/Simulink. The design parameters before and after optimization were input into this model. The traction power of electric tractor, total output power of two motors, main motor output power and auxiliary motor output power with the driving force can be simulated, as shown in Figure 6. The traction power performance in first gear will not be considered, because most power consumption under low speed working conditions is for PTO driving, and the traction resistance from
drive wheels is much less. By comparison of Figures 6a and 6b, it can be seen that, after optimization the traction power in each gear can be continuously connected to keep the power from being interrupted. And the coverage area of traction power is larger which improves the traction capacity under heavy load. Simultaneously, after optimization the constant torque area and constant power area of two motors are more corresponding in each gear, thus each motor’s driving power can be utilized more fully and rationally. Compared with traditional fuel tractor, the traction power of electric tractor in each gear forms a smooth envelope curve, which enlarges the coverage area of traction power and makes motor working in ideal characteristics under any driving force.
a. Before optimization
b. After optimization
Figure 6 Curves of electric tractor traction power and output power of two motors with driving force
In second gear, the top traction power of electric tractor is 11.5 kW, and the corresponding driving force is rated driving force, which equals to 6300 N. In third gear, the top traction power is 12.3 kW, which is the maximum traction power of electric tractor, and the corresponding driving force is 4800 N. The traction power reaches maximum in the middle load range, because the slip loss under middle load is smaller. The slip loss under heavy load is larger, and the rolling loss under low load is larger[4].
simulated, as shown in Figure 7. By comparison of Figures 7a and 7b, it can be seen that, after optimization the running speed in second, third and fourth gear can be continuously connected to realize stepless speed change[4]. After optimization the gearbox adds a low speed working gear. To a certain extent, this increases the complexity of gearbox structure. But it ensures that two motors can output speed in the rated speed range under low speed conditions, which improves each motor’s efficiency.
In the first gear, the top running speed of electric tractor is 3.4 km/h. In the second gear, the top running speed is 8.8 km/h, and the running speed corresponding to the maximum driving force is 7.3 km/h. In the third gear, the top running speed is 13.5 km/h, and the running speed corresponding to the maximum driving force is 12.4 km/h. In the fourth gear, the top running speed is 21 km/h, and the running speed corresponding to the maximum driving force is 19.9 km/h.
a. Before optimization
b. After optimization
Figure 7 Curves of electric tractor running speed with driving force
8 Conclusions
This study proposes a method of electric tractor powertrain parameter design based on dual-motor coupling drive. Parameter matching design calculates the motor power, battery capacity, gear number of gearbox and other parameters based on traction performance of electric tractor. Parameter optimization design takes gear ratios as the design variables. Drive power utilization ratio, continuous working time and efficiency of planetary gear mechanism are taken as objective functions. PSO algorithm based on mixed penalty function is used as the optimization algorithm. Parameters before and after optimization are input to the dynamics model of electric tractor powertrain. The comparison indicates that:
(1) After optimization, the drive power utilization ratios ηP2 and ηP3 are respectively increased by 14.8% and 9.1%. Continuous working time t1 is increased by 25.5%. Continuous working time t4 and t′4 do not have marked improvement. Efficiency of planetary gear mechanism ηsr_c is increased by 2%.
Based on above, the power transmitted to the drive wheels after optimization is more adequate when two motors output the rated power. Simultaneously, each motor’s efficiency is higher when the working load is in the rated load range.
(2) After optimization, the traction power of electric tractor in each gear can be continuously connected to keep the power from being interrupted. The coverage area of traction power is larger to improve the traction capacity under heavy load. Simultaneously, the constant torque area and constant power area of two motors are more corresponding in each gear, thus each motor’s driving power can be utilized more fully and rationally. Compared with traditional fuel tractor, the traction power of electric tractor in each gear forms a smooth envelope curve, which makes motors working in ideal characteristics under any driving force.
(3) After optimization, the running speed in second, third and fourth gear can be continuously connected to realize stepless speed change. The gearbox adds a low speed working gear, which increases the complexity of gearbox structure to a certain extent. However, this ensures that motors can output speed in rated speed range under low speed working conditions, which improves each motor’s efficiency.
Acknowledgments
We acknowledge that this working was financially supported by the Thirteenth Five-Year National Key R&D Plan (2016YFD0701001).
[References]
[1] Arjharn W, Koike M, Takigawa T, Yoda A, Hasegawa H, Bahalayodhin B. Preliminary study on the applicability of an electric tractor (Part 1): Energy consumption and drawbar pull performance. J. JSAM, 2001; 63(3): 130–137.
[2] Bodria L, Fiala M. Design and testing of an electric-powered walking tractor. J. Agri. Eng. Res., 1995; 60(1): 57–62.
[3] Gao H S, Zhu S H. Study on design theory and method for driving line of electric tractor. J. Nanjing Agri. Univ., 2009; 32(1): 140–145. (in Chinese)
[4] Xu L Y, Liu M N, Zhou Z L. Design of drive system for series hybrid electric tractor. Trans. of the CSAE, 2014; 30(9): 11–18.
[5] Zhang S, Xiong R, Zhang C N, Sun F C. An optimal structure selection and parameter design approach for a dual-motor-driven system used in an electric bus. Energy, 2016; 96: 437–448.
[6] Mozaffari A, Vajedi M, Chehresaz M, Azard N L. Multi-objective component sizing of a power-split plug-in hybrid electric vehicle powertrain using Pareto-based natural optimization machines. Engineering Optimization, 2016; 48(3): 361–379.
[7] Wu J, Zhang C H, Cui N X. PSO algorithm-based parameter optimization for HEV powertrain and its control strategy. Int. J. Automotive Technol., 2008; 9(1): 53–59.
[8] Zhou Y M. Theory of automobile and tractor. Beijing: China Agricultural University Press, 2000. (in Chinese)
[9] Gao Y M, Ehsani M. A torque and speed coupling hybrid drivetrain-architecture, control, and simulation. IEEE Trans. Power Electron, 2006; 21(3): 741–748.
[10] David D W, Lumkes J H. Manufacturing agricultural utility vehicles in sub-Saharan Africa. Agric. Eng. Int.: CIGR Journal. 2015; Special Issue 2015: 18th World Congress of CIGR.pp.148–159.
[11] Xie B, Li H, Song Z H, Mao E R. Powertrain system design of medium-sized hybrid electric tractor. Inf. Technol. J., 2013; 12(23): 7228–7233.
Zhangjiakou Agric. College, 1995; 11(2): 19–21. (in Chinese)
[13] Mollazade K, Ahmadi H, Alimardani R. Optimal design of rotary tiller's rotor and width proportionate to tractor power using energy method. Int. J. Agric.& Biol. Eng., 2009; 2(2): 1–7.
[14] Hu L. Based on finite element technology of rotary cultivator design and working parts simulation research. Master dissertation. Kunming: Kunming Univ. Sci. Technol., 2014. (in Chinese)
[15] Miller T. Brushless permanent-magnet motor drives. Power Eng. J., 1988; 2(1): 55–60.
[16] Chen Y N, Xie B, Mao E R. Electric tractor motor drive control based on FPGA. IFAC-PapersOnLine, 2016; 49(16): 271–276.
[17] Li Q, Shi S B, Liu H L. The study on tractor automatic shift schedule. J. Agri. Mechanization Res., 2012; 5: 221–223. (in Chinese)
[18] He R, Liu X R, He Z M. Research and development of optimal matching of automobile powertrain. J. Jiangsu Univ. Sci. Technol., 1997; 18(1): 37–41. (in Chinese)
[19] Hegazy R A, Molari G, El-Sheikha A M. Prototype of harvesting system for some aromatic and medical plants. Int. J. Agric. Res., 2011; 6(5): 420–428.
[20] Han L J, Liu H, Wang W D, et al. A study on the parameter matching and optimization of a power split HEV. Automotive Engng., 2014; 36(8): 904–910. (in Chinese)
[21] Yue L L. Matching research of vehicle engine and transmission system
based on Matlab and VC++ mixed programming. Master dissertation. Wuhan: Wuhan Univ. Technol., 2010. (in Chinese)
[22] Gao H S. Researches on drive system of electric tractor. PhD dissertation. Nanjing: Nanjing Agric. Univ., 2008. (in Chinese) [23] Rao Z G. The design and research of close planetary transmission of
power diffluence. Drive System Techn., 1996; 96(3): 30–33. (in Chinese) [24] Desai C, Williamson S S. Optimal design of a parallel hybrid electric
vehicle using multi-objective genetic algorithms. 2009 IEEE Vehicle Power and Propulsion Conf., Dearborn:USA, 2009; pp.871–876. [25] Madanipour V, Montazeri-Gh M, Mahmoodi-K M. Multi-objective
component sizing of plug-in hybrid electric vehicle for optimal energy management. Clean Techn. Environ. Policy, 2016; 18(4): 1–14. [26] Liu M N, Zhou Z L, Xu L Y, Zhao J H, Yan X H. Multi-objective
optimization and design of tractor trailer systems. Trans. of the CSAE, 2017; 33(8): 62–68. (in Chinese)
[27] Kennedy J, Eberhart R. Particle swarm optimization. IEEE Int. Conf. on Neural Networks, Perth:Australia, 1995; 4(8): 1942–1948.
[28] Hegazy O, Mierlo J V, Lataire P. Design optimization and optimal power control of fuel cell hybrid electric vehicles based on Swarm Intelligence. Int. Review of Electrical Eng., 2011; 6(4): 1727–1738.