UNIVERSITY
OF TRENTO - ITALY
Doctoral School in
Environmental engineering
Spatial assessment of multiple ecosystem services
in an Alpine region
Doctoral thesis in Environmental Engineering - Environmental Planning, Landscape Architecture and Sustainable Building - Planning and Design for Sustainable Development
Department of Civil, environmental and mechanical engineering
Academic year: 2012/2013
PhD Candidate: Eng. Marika Ferrari (University of Trento - Doctoral school in Environmental Engineering)
Supervisor: Dr. Davide Geneletti (University of Trento - Department of Civil, environmental and mechanical engineering)
Contents
Figures vii
Tables Xii
Summary xv
1 Scope and outline of the thesis
1.1 Introduction
1.2 Evolution of the ecosystem service concept 1.3 Objectives of the study
1.4 Case study
1.5 Outline of the thesis
1 1 1 4 6 9
2 Ecosystem services in the Trentino region 11
2.1 Definition, classification and characterization of ecosystem services 2.2 Selection and classification
2.3 Provisioning services 2.4 Regulating services 2.5 Cultural services
11 13 15 18 20
2.6 Conclusion 21
3 Mapping ecosystem service indicators 23
3.1 Key issue on ecosystem service mapping
3.2 Selection of indicators of multiple ecosystem services 3.3 Indicators for provisioning services
3.3.1 Agriculture production 3.3.2 Hunting production
3.3.4 Mushroom production 3.3.5 Honey production
3.3.6 Inorganic matter extraction 3.3.7 Timber production
3.3.8 Fuel Wood production
3.3.9 Water supply from surface water network 3.3.10 Water supply from groundwater
3.4 Indicators for regulating services 3.4.1 Water flow regulation 3.4.2 Water quality regulation 3.4.3 Air quality regulation 3.4.4 Micro-climate regulation 3.4.5 Macro-climate regulation 3.4.6 Flood prevention capacity 3.4.7 Hazards protection capacity 3.5 Indicators for cultural services
3.5.1 Cultural heritage 3.5.2 Scenic beauty 3.5.3 Hunting 3.5.4 Fishing
3.5.5 Mushroom collection 3.5.6 Honey collection 3.5.7 Outdoor recreation 3.5.8 Leisure
3.6 Conclusion
31 32 32 33 33 34 34 35 35 36 37 37 38 38 39 39 39 40 40 41 41 42 42 43 43
4 Identifying key indicators and ecosystem services synergies and tradeoffs
4.1 Introduction 4.2 Methods 4.3 Results
4.3.1 Selecting key indicators of ecosystem services
4.3.2 Identifying positive and negative interactions among different ESs 4.4 Discussion
55
5 Analyzing bundles and drivers of change of ecosystem services
5.1 Introduction 5.2 Methods
5.2.1 Identification of principal components and clusters of ecosystem services 5.2.2 Characterization of clusters and definition of bundles
5.2.3 Characterization of principal components and explanation of drivers of change
5.3 Results
5.3.1 Identification of principal components and clusters of ecosystem services 5.3.2 Characterization of clusters
5.3.3 Definition of bundles
5.3.4 Characterization of principal components 5.3.5 Explanation of drivers of change
5.4 Discussion
59 59 60 61 62 64 65 54 67 73 75 77 78
6 Conclusions
6.1 Mapping multiple ecosystem services in an Alpine region 6.1.1 Main findings
6.1.2 Strengths and weaknesses 6.1.3 Proposals for future research 6.2 Identifying key ecosystem service indicators
6.2.1 Main findings
6.2.2 Strengths and weaknesses 6.2.3 Proposals for future research 6.3 Defining bundles of ecosystem services
6.3.1 Main findings
6.3.2 Strengths and weaknesses 6.3.3 Proposals for future research
6.4.1 Main findings
6.4.2 Strengths and weaknesses 6.4.3 Proposals for future research
87 88 90
References 91
Annexes
Annex I Annex II Annex III
Data for mapping ecosystem service indicators Maps of ecosystem service indicators
Exploratory analysis of ecosystem service indicators
Figures
Figure 1.1. Localization of Trentino (the orange area) within the Alps (the green area)
6
Figure 1.2. Digital Terrain Model of Trentino 8
Figure 1.3. Land Cover classes (adapted from the Corine Land Cover map) 8
Figure 1.4. Outline of the thesis 9
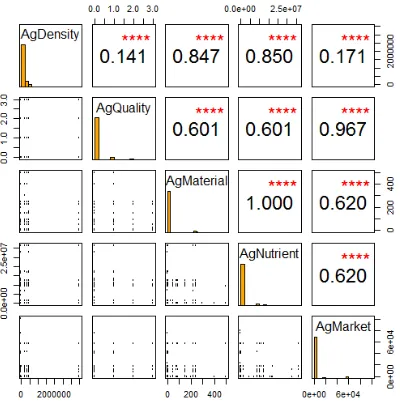
Figure 4.1. Correlation analysis among the five indicators of the ES "Agriculture production". Scatterplots on the down-left allow for a visual interpretation of correlations; Spearman correlation coefficients are on the up-right of the figure and stars represent p-value (p-value for four stars is 2*10-16). Indicators are: AgDensity (Density of stumps and seeds), AgMaterial (Amount of agricultural products), AgNutrient (Nutritive value of agricultural products), and AgQuality (Quality of agricultural products) and AgMarket (Selling price of agricultural products). Histograms of data distribution are graphs in the middle of the figure.
49
Figure 4.2. Selection rate of pairs of correlated indicators for different thresholds of the correlation coefficient.
50
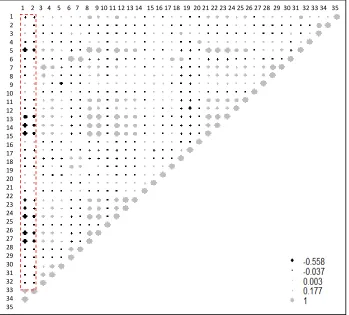
Figure 4.3. Bubble of correlations among the 35 key indicators ordered according to the list of Table 4.1. Black points are negative correlations and represent tradeoffs, i.e. negative interactions of ES indicators, while gray points are positive correlations and represent synergies, i.e. positive interactions of ESs indicators. Point size represents absolute correlation values, i.e. the degree of correlation. The dashed-red rectangle highlights the correlations between the two key indicators of the Agriculture production service and other 33 ESs.
83
Figure 4.4. Tradeoffs (first sketch) and synergies (all other sketches) among ES types and indicators. 1: tradeoffs with agriculture products. 2: synergies of hunting services, 3: synergies between ESs of water ecosystems. 4: synergies between ESs of forest ecosystems close to roads. 6: synergies between ESs of forest ecosystems. Note that the colour and width of the arrows are related to the sign and intensity of the relationship.
54
Figure 5.1. Flowchart of the method used to define ESs bundles and drivers of change
61
Figure 5.2. The most significant difference between the groups is realized for 11 cluster (local maximum of the ANOSIM, red arrow), which corresponds to about 1000 of height in the dendogram (red line).
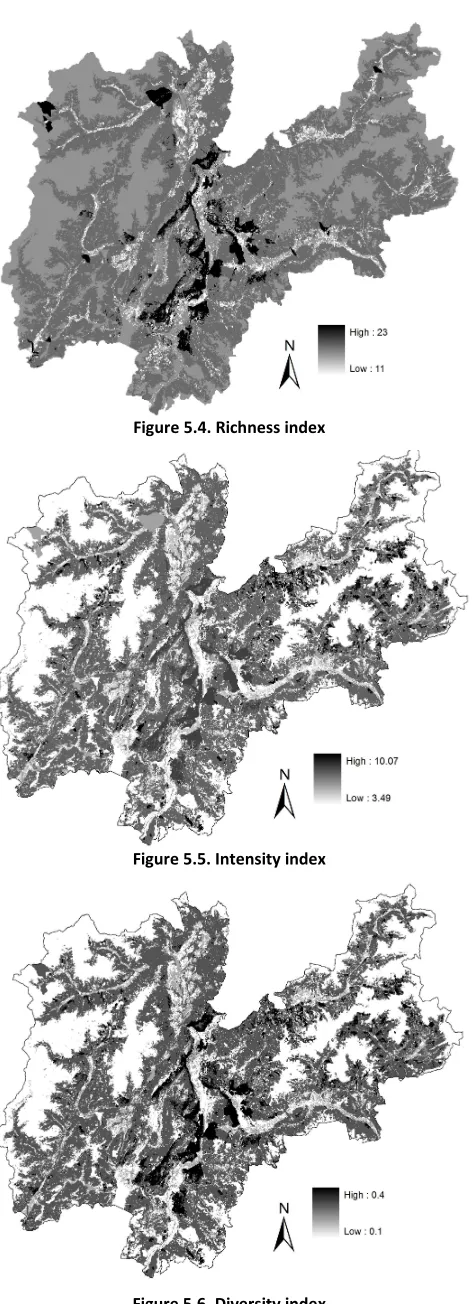
Figure 5.4. Richness index 69
Figure 5.5. Intensity index 69
Figure 5.6. Diversity index 69
Figure 5.7. Relative contribution of ESs to 11 clusters. Values range from 0 to 1, that is the maximum supply.
72
Figure 5.8. Biplot of the first two principal components 75
Figure 5.9. Map of the first Principal Component; it explains the 16% of original variance
76
Figure 5.10. Map of the second Principal Component; it explains the 7% of original variance
76
Figure 5.11. Distribution of PC1 scores among forest areas and other areas. 56% of Trentino is forest (the grey area in the picture); lowest values of PC1 are in forest areas.
77
Figure AII.1. Indicators of the ES "Agriculture production" 115 Figure AII.2. Indicators of the ES "Hunting production" 116 Figure AII.3. Indicators of the ES "Fishing production" 117 Figure AII.4. Indicators of the ES "Mushroom production" 117 Figure AII.5. Indicators of the ES "Honey production" 118 Figure AII.6. Indicators of the ES "Inorganic matter extraction" 118 Figure AII.7. Indicators of the ES "Timber production" 119 Figure AII.8. Indicators of the ES "Fuel wood production" 120 Figure AII.9. Indicators of the ES "Water supply from surface water network" 121 Figure AII.10. Indicators of the ES " Water supply from groundwater" 122 Figure AII.11. Indicators of the ES "Water flow regulation" 123 Figure AII.12. Indicators of the ES "Water quality regulation" 123 Figure AII.13. Indicators of the ES "Air quality regulation" 124 Figure AII.14. Indicators of the ES "Micro-Climate regulation" 124 Figure AII.15. Indicators of the ES "Macro-Climate regulation" 125 Figure AII.16. Indicators of the ES "Flood prevention capacity" 125 Figure AII.17. Indicators of the ES "Hazard protection capacity" 126 Figure AII.18. Indicators of the ES "Cultural heritage" 126 Figure AII.19. Indicators of the ES "Scenic beauty" 127
Figure AII.20. Indicators of the ES "Hunting" 127
Figure AII.21. Indicators of the ES "Fishing" 128
Figure AII.22. Indicators of the ES "Mushroom collection" 128 Figure AII.23. Indicators of the ES "Honey collection" 128 Figure AII.24. Indicators of the ES "Outdoor recreation" 129
Figure AII.25. Indicators of the ES "Leisure" 129
Figure AIII.1. Scatterplots, histograms and Spearman correlation coefficients of five indicators of the Agriculture production service. Acronyms of indicators are: AgDensity for Density of stumps and seeds, AgQuality for Quality of agricultural products, AgMaterial for Amount of agricultural products,
AgNutrient for Nutritive value of agricultural products and AgMarket for Selling price of agricultural products.
Figure AIII.2. Scatterplots, histograms and Spearman correlation coefficients of four indicators of the Hunting production service. Acronyms of indicators are: HuDensity for Density of ungulates, HuMaterial for Amount of hunting products, HuNutrient for Nutritive value of hunting products, HuQuality for Proportion of ungulates out of the entire hunted population.
134
Figure AIII.3. Scatterplots, histograms and Spearman correlation coefficients of four indicators of the Fishing production service. Acronyms of indicators are: FiBiomass for Fish biomass, FiMaterial for Amount of fishing products, FiNutrient for Nutritive value of fishing products and FiQuality for Proportion of key Alpine species out of the entire caught population.
135
Figure AIII.4. Scatterplots, histograms and Spearman correlation coefficients of two indicators of the Mushroom production service. Acronyms of indicators are: MuMaterial for Intensity of mushroom production and MuQuality for Mushroom quality.
136
Figure AIII.5. Scatterplots, histograms and Spearman correlation coefficients of two indicators of the Honey production service. Acronyms of indicators are: HoMaterial for Intensity of honey production and HoQuality for Nectar value.
136
Figure AIII.6. Scatterplots, histograms and Spearman correlation coefficients of three indicators of the Inorganic matter extraction service. Acronyms of indicators are: InMatDensity for Amount of inorganic matter in quarries, InMaterial for Amount of inorganic matter extracted and InMatMarket for Selling price of inorganic matter.
137
Figure AIII.7. Scatterplots, histograms and Spearman correlation coefficients of three indicators of Timber production service. Acronyms of indicators are: WoDensity for Wood density in forests, TiMaterial for Amount of timber harvested and TiMarket for Selling price of timber harvested.
138
Figure AIII.8. Scatterplots, histograms and Spearman correlation coefficients of four indicators of Fuel wood production service. Acronyms of indicators are: WoDensity for Wood density in forests, FWoEnergy for Energy embedded in fuel wood, FWoMaterial for Amount of fuel wood harvested and FWoMarket for Selling price of fuel wood.
139
Figure AIII.9. Scatterplots, histograms and Spearman correlation coefficients of three indicators of Water supply service from surface water network. Acronyms of indicators are: SupWFlow for Water flow from surface water network, SupWMaterial for Water consumption from surface water network and SupWMarket for Selling price of surface water supply.
indicators of Water supply service from groundwater. Acronyms of indicators are: GWFlow for Water flow from groundwater, GWMaterial for Water consumption from groundwater and GWMarket for Selling price of surface groundwater supply.
Figure AIII.11. Scatterplots, histograms and Spearman correlation coefficients of two indicators of Water flow regulation. Acronyms of indicators are: WFDensity for Surface area of lakes, reservoirs and glaciers and WFFlow for Specific discharge coefficient.
142
Figure AIII.12. Scatterplot and histogram of the Water quality regulation service indicator. Indicator name: Capacity of water ecosystems to reduce pollutants; acronym: WQuality.
142
Figure AIII.13. Scatterplots, histograms and Spearman correlation coefficients of two indicators of Air quality regulation service. Acronyms of indicators are: Roughness for Roughness of land surface adjacent to roads and VegDensity for Density of forests adjacent to roads.
143
Figure AIII.14. Scatterplots, histograms and Spearman correlation coefficients of two indicators of Micro-Climate regulation service. Acronyms of indicators are: MiCShape for Ability of forests in mitigating temperature based on shape and MiCDensity for Ability of forests in mitigating temperature based on density.
143
Figure AIII.15. Scatterplots, histograms and Spearman correlation coefficients of two indicators of Macro-Climate regulation service. Acronyms of indicators are: MaCStock for Carbon Stock and MaCInc for Carbon Increment.
144
Figure AIII.16. Scatterplot and histogram of the Flood prevention capacity service indicator. Indicator name: Curve number; acronym: CN.
144
Figure AIII.17. Scatterplots, histograms and Spearman correlation coefficients of two indicators of Hazards protection capacity service. Acronyms of indicators are: FoExtension for Forest extension and NHProt for Forest watershed protection factor.
145
Figure AIII.18. Scatterplot and histogram of the Cultural heritage service indicator. Indicator name: Proximity of cultural heritage sites to road network; acronym: CultHer.
145
Figure AIII.19. Scatterplot and histogram of the Scenic beauty service indicator. Indicator name: Landscapes visibility; acronym: ScBeauty.
146
Figure AIII.20. Scatterplots, histograms and Spearman correlation coefficients of two indicators of Hunting service. Acronyms of indicators are: Hunters for Density of hunters, HuntedAn for Game density.
146
Figure AIII.21. Scatterplots, histograms and Spearman correlation coefficients of two indicators of Fishing service. Acronyms of indicators are: Fishers for Fishing intensity, FiCaught for Amount of caught fished.
147
Figure AIII.22. Scatterplots, histograms and Spearman correlation coefficients of two indicators of Mushroom collection service. Acronyms of indicators are:
MuMarket for Revenues from permits, MuActivity Availability of mushrooms of good quality.
Figure AIII.23. Scatterplot and histogram of Honey collection service indicator. Indicator name: Availability of honey of good quality; acronym: HoActivity.
148
Figure AIII.24. Scatterplots, histograms and Spearman correlation coefficients of three indicators of the Outdoor recreation service. Acronyms of indicators are: RecInt for Intensity of sporting activities, RecSeason for Season length and RecMarket for Revenues from ski passes.
148
Figure AIII.25. Scatterplot and histogram of Leisure service indicator. Indicator name: Density of recreational activities; acronym: Leisure.
Tables
Table 2.1. List of the administrative offices, local research institutes and associations where the experts involved work. The official names of offices, institutes and associations are in the first column; the definition in the second and the number of experts involved in the third column.
13
Table 2.2. Economic classification of goods (adopted from Costanza 2008) 14 Table 2.3. List of 25 ESs types, grouped in nine classes and three themes. The
classification framework follows Haines-Young et Potschin (2010), while the names are adapted from Mayes et al. (2011).
14
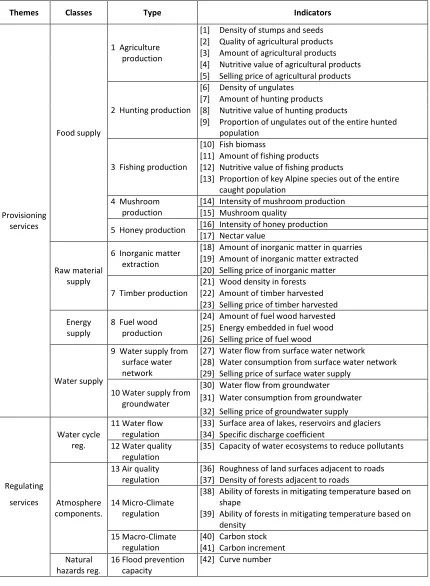
Table 3.1. List of 57 indicators (fourth column) assessing 25 ESs types (third column), that are grouped in nine classes (second column) and three themes (first column).
27
Table 3.2. Unit of measurement, data for mapping and spatial unit of representation for the indicators of the Agriculture production service
30
Table 3.3. Unit of measurement, data for mapping and spatial unit of representation for the indicators of the Hunting production service
30
Table 3.4. Unit of measurement, data for mapping and spatial unit of representation for the indicators of the Fishing production service
31
Table 3.5. Unit of measurement, data and methods for mapping and spatial unit of representation for the indicators of the Mushroom production service
32
Table 3.6. Unit of measurement, data and methods for mapping and spatial unit of representation for the indicators of the Honey production service
32
Table 3.7. Unit of measurement, data for mapping and spatial unit of representation for the indicators of the Inorganic matter extraction service
33
Table 3.8. Unit of measurement, data for mapping and spatial unit of representation for the indicators of the Timber production service
33
Table 3.9. Unit of measurement, data for mapping and spatial unit of representation for the indicators of the Fuel wood production service
34
Table 3.10. Unit of measurement, data for mapping and spatial unit of representation for the indicators of the Water supply from surface water network service
34
Table 3.11. Unit of measurement, data for mapping and spatial unit of representation for the indicators of the Water supply from groundwater service
35
Table 3.12. Unit of measurement, data for mapping and spatial unit of representation for the indicators of the Water flow regulation service
35
elements of impermeability (training walls and groynes or dikes) and different land cover types of riparian areas 30 m close to the rivers Table 3.14 Unit of measurement, data and methods of mapping and spatial unit of
representation for the indicator of the Water quality regulation service 36
Table 3.15. Unit of measurement, data for mapping and spatial unit of representation for the indicators of the Air quality regulation service
37
Table 3.16. Unit of measurement, data of mapping and spatial unit of representation for the indicators of the Micro-Climate regulation service
38
Table 3.17. Unit of measurement, data of mapping and spatial unit of representation for the indicators of the Macro-Climate regulation service
38
Table 3.18. Unit of measurement, data for mapping and spatial unit of representation for the indicators of the Flood prevention capacity service
39
Table 3.19. Unit of measurement, data for mapping and spatial unit of representation for the indicators of the Hazards prevention capacity service
39
Table 3.20. Unit of measurement, data for mapping and spatial unit of representation for the indicator of the Cultural heritage service
40
Table 3.21. Unit of measurement, data for mapping and spatial unit of representation for the indicator of the Scenic beauty service
40
Table 3.22. Unit of measurement, data for mapping and spatial unit of representation for the indicators of the Hunting service
40
Table 3.23. Unit of measurement, data for mapping and spatial unit of representation for the indicators of the Fishing service
41
Table 3.24. Unit of measurement, data and methods for mapping and spatial unit of representation for the indicators of the Mushroom collection service
41
Table 3.25. Unit of measurement, data and methods for mapping and spatial unit of representation for the indicators of the Honey collection service
42
Table 3.26. Unit of measurement, data and methods for mapping and spatial unit of representation for the indicators of the Outdoor recreation service
42
Table 3.27. Unit of measurement, data and methods for mapping and spatial unit of representation for the indicators of the Leisure service
43
Table 4.1. Key indicators of ESs used in this study. Indicators are both of Stock and Flow (4th column), measuring the Biophysical (B), Economic (E) and Socio-cultural (S-C) values (5th column) and are provided over different spatial units (6th column).
51
Table 5.1. Indices computed in the Shape analysis of clusters 67 Table 5.2. Spearman correlation coefficients of Clusters and Principal components
with Altitude, Catchments and Land use
Table AI.2. Estimates of agricultural production data 108
Table AI.3. Estimates of hunted animals data 109
Table AI.4. Estimates of additional data 109
Table AI.5. Estimates of carbon sequestration data in non-forest areas 109
Table AI.6. Estimates of data per forest type 110
Table AIII.1. Main statistics of the indicators of the Agricultural production service 133 Table AIII.2. Main statistics of the indicators for the Hunting production service 134 Table AIII.3. Main statistics of the indicators of the Fishing production service 135 Table AIII.4. Main statistics of the indicators of the Mushroom production service 136 Table AIII.5. Main statistics of the indicators of the Honey production service 136 Table AIII.6. Main statistics of the indicators of the Inorganic matter extraction
service
137
Table AIII.7. Main statistics of the indicators of the Timber production service 138 Table AIII.8. Main statistics of the indicators of the Fuel wood production service 139 Table AIII.9. Main statistics of the indicators of the Water supply service from
surface water network
140
Table AIII.10. Main statistics of the indicators of the Water supply service from groundwater
141
Summary
Ecosystem Services (ESs) are the goods and services supplied by ecosystems. In order to fully understand their contribution to human wellbeing, there is a need to identify them, assess their supply, recognise areas where they appear together repeatedly and analyse the interactions that may exist among them. Most of these tasks are also specifically required by the European Biodiversity Strategy for 2020, which asks Member States, by 2014, to identify key ESs and to spatially assess their supply and demand (European Commission, 2011). Nevertheless, these are difficult tasks and to date they have been only partly performed: existing studies in fact have typically focused on a small sub-set of ESs and made use of information that poorly reflects the actual variability of the ESs distribution across a region. The present research aims to fill these gaps, by developing methods involving a wide set of ESs and providing a detailed ESs assessment, based on spatial and statistical analyses. The methods have been tested on an Alpine region of Italy, Trentino. The Alps present a heterogeneous landscape, resulting from the combination of natural and urbanized environments, that allows the supply of a wide range of ESs.
The research has four specific objectives. The first objective focuses on the selection and the representation over specific spatial units of the real supply of multiple ESs. Operatively, 51 experts from the local administrative offices and research institutes have been involved in the selection of the most important ESs and spatial indicators for the case study. The experts identified 25 ESs and 57 representative spatial indicators (1 to 5 indicators for each service), and provided data for indicators mapping. To consider the heterogeneity of the ESs supply across the region, indicators were mapped over 20 different spatial units, including: land cover classes, cadastral parcels, fishing zones and catchments.
the lowly correlated ones. 35 indicators were selected for the case study (out of the 57 initial indicators). The analysis showed that there is a minimum number of key indicators for each ES. Accordingly, three general rules were identified for the selection: (i) if the supply of an ES is regulated, both its biophysical-stock and biophysical-flow indicators must be selected, (ii) if multiple stock (flow) biophysical indicators for a single ES are mapped over different spatial units, all stock (flow) indicators must be maintained, (iii) socio-cultural or economic indicators are always selected as key indicators.
The third objective is to develop and test a statistical method for defining bundles of ESs, as sets of spatially correlated services. Principal Component Analysis was used to summarize the information of the 35 indicators, while hierarchical clustering was applied to identify 11 ESs clusters. Clusters were turned into bundles by analyzing the spatial variability of the services due to biophysical (e.g. morphological conditions) and human (e.g. land use) factors. The results of the analysis show that in Trentino multiple ESs can be grouped in a few number of bundles with a complex shape. In particular, areas with poor ESs supply are grouped in one single bundle and the largest bundle follows the spatial distribution of a single land cover class: i.e. forest.
management was found as the external factor that causes the greatest variability of the ESs distribution across the region. Within forest areas, forest management activities that involve loss of vegetation were found as the main drivers of ESs change.
1
Scope and outline of the thesis
1.1
Introduction
Ecosystem services (ESs) are the goods and the services supplied by ecosystems (MA, 2003), and used by human populations to maintain and develop their own wellbeing (MA, 2005). A forest ecosystem, for instance, can supply the ESs of food, timber, fresh water and fuel wood that people may use to satisfy their basic material needs. It can also supply the ESs of regulation of flood, disease, carbon and climate that guarantee secure and healthily environmental conditions for people, and also recreation and aesthetic values (MA, 2003). ESs are recognized in relation to the presence of human wellbeing needs (i.e. basic material, security, health and social relationships; MA, 2005), and their number vary according to the heterogeneity of morphology, land cover and land use of the territory (MA, 2003; Costanza, 2008).
Schwartz et al. (2000) pointed out that ESs are directly and positively dependent on the presence and on the dynamics of a wide range of species and habitat types, and that the safeguarding of ESs may strongly contribute to the conservation of biodiversity (Schwartz et al., 2000 and later Kremen, 2005). Furthermore, Haines-Young and Potschin (2010b) observed that the provision of ESs is highly sensitive to the variation of biodiversity, especially in case of low biodiversity values.
Therefore, the ESs concept considers nature for the benefits it can directly and explicitly provide to human society, and promotes the conservation of biodiversity not for its intrinsic value but for its value to people (Balmford et al., 2008). The challenge is to acknowledge the value of ESs and to link it to biodiversity and human wellbeing, in the perspective to assess the dynamics that can cause ESs loss (Carpenter, et al., 2006; Daily and Matson, 2008 and Anton et al., 2010).
1.2
Evolution of the ecosystem service concept
benefits were named "ecosystem services" for the first time by Ehrlich and Ehrlich only in 1981. The concept emerged as a topic of discussion in the latest 1990s, when Costanza et al. (in 1997) estimated the worldwide economic value of 17 ESs for 16 biomes. The first comprehensive global assessment of the consequences of ecosystems changes for human wellbeing dated back to 2001. It was a project promoted by the United Nation that involved more than 1300 scientists all around the world: the Millennium Ecosystem Assessment (MA). The project delivered new knowledge about the conditions, the trends, the options to restore the major ESs worldwide and the measures for a sustainable ESs use. The key finding of MA was that 60% of ESs were being degraded and used unsustainably by 2005 and that this has been having really negative consequences for human wellbeing, compromising both the achievement of the Millennium Development Goals of 2000 and the objective of poverty alleviation of the Brundtland Commission of 1987.
The ESs concept was also covered by the Biodiversity Targets set in the Convention on Biological Diversity (CBD) in 1992 in Rio de Janeiro that sought to put human needs at the centre of biodiversity management in order to achieve sustainable management of ecosystems by 2010. The impact of biodiversity loss on wellbeing was evaluated within an initiative of G8+5 Environment Ministers that took place from 2007 to 2010, i.e. The Economic of Ecosystems and Biodiversity (TEEB). Among all, TEEB pointed out that Biodiversity Targets for 2010 were not met. In the European Union, the new Biodiversity Strategy set new targets for 2020, where the conservation of ES is explicitly address. In particular, by 2014 Member States are asked for the identification of the important ESs and for the spatial assessment of the service supply and demand in their countries (European Commission, 2011).
concept have a strong capability to address concerns that relate to the conservation of biodiversity and the improvement of human wellbeing, and also to get considerable funding (Goldman et al., 2008; Tallis et al., 2008; de Groot et al., 2010). Projects are usually carried out in areas with high presence of ESs, like rural areas of Asia, Africa and Latin America (WWF and IUCN), with the aim to restore those ecosystems where basic materials and social relations were strongly exploited and at the cost of ESs that guarantee human health and security. For instance, several projects have being carried on in Indonesia after the Indian Ocean tsunami of 2004, focusing on the restoration of the storm protection capacity of mangrove forests. Seppelt et al. (2011) suggested that ESs research is still driven mainly by curiosity rather than by the need to respond to local issues. In contrast, projects are carried out mainly to respond to environmental and sustainable development issues (Liu et al., 2010).
(2010) highlighted the need to analyze trade-offs between the ESs provision and the changes in the ecosystems. Anton et al. (2010) summarized a number of these information in a number of priority research needs: the analysis of the ecological underpinning of ESs and of the drivers that affect ecosystems, the valuation in different spatial and temporal scales, the development of indicators, and the study of habitat management and conservation policy.
1.3
Objectives of the study
The general aim of this research is to improve the knowledge about the spatial assessment of ESs at regional scale. In particular, the research focuses on the mapping of the actual supply of multiple ESs for an Alpine region and on the study of the relationships that exist among them. Mapping calls for the definition of key spatially-explicit indicators that allow biophysical, socio-cultural and economic values of important ESs (both in terms of stock and flow) to be measured, and the spatial heterogeneity of the ESs to be represented. The study of the relationships requires the development of methods, based on spatial and statistical analyses, that allow the distribution of multiple ESs across the region, the variance of the ESs distribution, the common drivers to this variance and the synergies and tradeoffs between ESs to be explained. The specific research objectives and related research questions are described hereafter.
1. Mapping multiple ESs in an Alpine region. The first objective of the research is the selection of the important ESs for an Alpine region of Italy (Trentino) and the mapping of important indicators. Selected ESs are those able to satisfy actual human wellbeing needs (Chapter 2), and selected indicators are those able to measure the biophysical, economic and socio-cultural value, in terms of stock and flow, of the ESs supply (Chapter 3). Mapping must take into account the differences in the spatial units over which ESs are supplied (e.g. cadastral parcels, water network and river sub-catchments) and the availability of existing data (Chapter 3).
Research questions
- Are there ESs that are exclusively associated with the Alpine region?
- How can available data be used to measure/map the biophysical, economic and socio-cultural value, in terms of stock and flow, of the ESs supply?
2. Identifying key ESs indicators. When ESs are many, their characterization can be problematic due to the considerable human resources needed for data recovery, and to computational requirements for the analysis of all relevant information. Therefore, the identification of a non-redundant set of indicators (i.e. key indicators) is a priority. Chapter 4 presents a method, based on statistical correlations, for the selection of key indicators out of a large set and lists three criteria to guide the definition of indicators in data-poor environments.
Research questions
- Can the number of ESs assessment indicators be consistently reduced? - How to assess the sensitivity of the selection?
- Can rules be defined to allow the identification of a minimum set of ES indicators?
3. Defining bundles of ESs. ESs have been historically mapped over land uses or administrative units, but this is not consistent with the areas (i.e. spatial units) over which they are actually supplied. As these areas are ESs-specific (e.g. agricultural cadastral parcels for the ES "Agriculture production", fishing zones for the ES "fishing" and river sub-catchments for the ES "water flow regulation"), the consideration of multiple ESs calls for the definition of spatial units where sets of ESs are supplied simultaneously, i.e. bundles. These are obtained by multivariate statistical analyses on key indicators. In order to give these bundles a meaning, the distribution of bundles across the region and distribution of ESs across bundles are studied through spatial and statistical analyses (Chapter 5).
Research questions
- How to consider multiple ESs on the basis of their spatial distribution and value? - How to account for the spatial heterogeneity of the ESs supply?
- How to define a suitable number of bundles?
4. Analysing ESs tradeoffs and drivers of change. The supply of a given ES is correlated with
respectively. Chapter 4 presents a method, based on statistical correlations between key ESs indicators, to identify synergies and tradeoffs among related ESs. While multiple factors may have an influence on the ESs provision, land use management is assumed to be the single most important one. This study verifies this hypothesis through a scientifically sound methodology and explores which management actions have the greatest influence on the ESs supply (in Chapter 5).
Research questions
- Which synergies and tradeoffs exist between ESs?
- Which ESs are correlated in terms of supply across different spatial units? - Is land use management the strongest factor affecting the ESs provision?
1.4
Case study
The Alpine region is an important source of ESs for the entire Europe (MA, 2003; Grêt-Regamey et al., 2012), that contribute to the maintenance and the development of the wellbeing of dwellers and people living in outside areas. In fact, the Alps constitute the reservoir of the 40% of freshwater and their forests, that cover more than 40% of the territory, are the third reservoir of carbon in Europe. One fifth of the forests extension contributes to the protection of urban settlements and, annually, people from all over the world make use of such forests and of the mountains' upper part for recreation activities, like trekking
and skiing (Morandini et al., 2009). Alpine ecosystems provide also storage in biomass and soil, natural resources and biodiversity (Grêt-Regamey et al., 2008). Details are likely to change depending on the morphological (e.g. altitude and forest composition) and on the socio-economic characteristics (e.g. agricultural produce, tourism activities) of specific Alpine regions.
The present research has focused on Trentino, Italy (Figure 1.1). This is an autonomous province located in the eastern Alps with an area of 6212 km2 and a population of 524,826 inhabitants, as of 2010 (average population density: 82.5 inhabitants km-2). The elevation varies greatly, ranging from 62 to 3343 m above the sea level (the highest peak is Marmolada), with about 30% of the territory under 1000 m (Figure 1.2) , about 50% between 1000 and 2000
Figure 1.2. Digital Terrain Model of Trentino
1.5
Outline of the thesis
Chapter 2 describes the important ESs of Trentino, while indicators are selected and mapped in Chapter 3. The description of selected ESs strongly emphasizes their specific characteristics (e.g. of being storable and renewable services). Selected indicators can represent the biophysical, socio-cultural and economic values of the ESs supply in terms of stock and flow, and the mapping process deals with the issue of representing the spatial heterogeneity of single ESs. In Chapter 4 key indicators are selected by means of statistical correlations, general criteria of selection are defined, and synergies and tradeoffs are explored. Key indicators feed the spatial and statistical analyses introduced in Chapter 5, that define bundles of ESs and combine indicators from which to explain the spatial distribution of ESs and the main drivers of change. Finally, Chapter 6 summarizes the main findings of the research, discusses their strengths and weaknesses and contains directions for the future research.
Introduction (Chapter 1)
Ecosystem services in Trentino (Chapter 2)
Indicators mapping (Chapter 3)
Key indicators identification (Chapter 4)
Bundles analysis (Chapter 5)
Tradeoffs and driver of change analysis (Chapter 4 and 5)
2
Ecosystem services in the Trentino region
In this Chapter important ESs for Trentino are identified. They are selected from the list
provided in Maes et al. (2011b) by a number of experts belonging to local administrative
offices and local research institutes; selected ESs are classified under the CICES systems
(Haines-Young and Potschin, 2010a). Then, they are described reporting specific information
for the study region. In particular, Section 2.1 introduces the concepts of definition,
classification and characterization of ecosystem services. Section 2.2 reports the list of local
offices, associations and institutes with the number of experts involved in the ESs selection,
the selection criteria used by experts and the list of selected ESs. Sections 2.3, 2.4 and 2.5
describe respectively provisioning, regulating and cultural ESs, while Section 2.6 provides some
final considerations.
2.1
Definition, classification and characterization of ecosystem services
Several definitions of ES have been developed through the years by different professional
figures (scientists, economists, practitioners and policy makers) in order to fit different
purposes (such as education, environmental accounting, landscape management and
valuation; de Groot et al., 2010). Daily (1999) defined ESs as "the conditions and processes
through which natural ecosystems, and the species that make them up, sustain and fulfil
human life", while Boyd and Banzhaf (2007) as "the ecological components directly consumed
or enjoyed to produce human wellbeing". Analogously, the physical constituents and the
processes/functions of ecosystems, and the linkages to human wellbeing, have been described
and defined in many ways. Fisher et al. (2009) called the physical constituents “intermediate
services”, the processes and functions “final services”, and the linkages to human wellbeing
“benefits”. Haines-Young and Potschin (2010b) considered the physical constituents and the
processes and functions of ecosystems as “intermediate products”, and services and benefits
as “final products” of the interactions between biodiversity, ecosystem functions and human
wellbeing. Despite the differences in terminologies, both of them argued that an ES exists only
in relation to the presence of a human wellbeing need; in other words, ESs can be recognized
demand of the service supply, that clearly differentiates from the potential supply (Bastian et
al., 2012).
The choice of the classification system follows the definition of ESs (Carpenter et al., 2006;
Fisher et al., 2009; Haines-Young and Potschin, 2010a). The MA classified ESs according to four
main categories of the benefits people obtain from ecosystems: supporting, regulating,
provisioning and cultural services. The Economics of Ecosystems and Biodiversity project
(TEEB) added another service category, "habitat services" to account the capacity of ESs to
sustain biodiversity (Balmford et al., 2008). The Common International Classification of
Ecosystem Services (CICES) was proposed to standardize the way of naming and describing ESs
in the perspective of environmental accounting and landscape management (see Haines-Young
et al., 2010a). Here ESs are defined as the contributions of ecosystems to human wellbeing.
CICES covers the categories of the MA classification except the ‘supporting services’ category,
since it focuses on final outputs of ecosystem processes. Such categories constitute the first
level of CICES. They are nested in nine classes, 23 groups and 59 types of services. The
importance of ESs is case-specific; accordingly, they must be selected in relation to specific
human wellbeing needs and to the heterogeneity of morphology, land cover and land use of
the studied territory.
Scientific literature has argued that ESs may be described according to a number of aspects
(Fisher et al., 2009), among which:
• Public-Private accessibility to the service. Costanza (2008) suggested to apply the
economic classification of goods (i.e. public, private, common and club goods) to
characterize single ESs, that means that ESs may be grouped according to the degree to
which people can be excluded or can have complete access to them. Therefore, public
services are those with complete and free access (not rival and not excludable services),
private services are those limited to payers (rival and excludable services), common
services are those limited but free (rival and not excludable services) and club services are
those that can be freely accessed but only by payers (not rival and excludable services).
• Spatial dynamism. Costanza (2008) also suggested that ESs can be classified according to
the spatial dynamism existing between the areas where services are supplied and the
areas where they are used. The relationship between SPU and SBU may be “identical”
(services are supplied and used in the same area), “omni-directional” (services are
by a gravitational process to the to the beneficiaries) and “directional” (services are
supplied by directional effects to the to the beneficiaries).
2.2
Selection and classification
ESs have been selected with the aid of experts belonging to local administrative offices of the
Autonomous Province of Trento, local research institutes or associations. 51 Experts (see Table
2.1) with knowledge about the ecosystem goods and services in Trentino have been involved
in the selection.
Table 2.1. List of the administrative offices, local research institutes and associations where the experts involved work. The official names of offices, institutes and associations are in the first column; the definition in the second and the number of experts involved in the third column.
Names of the administrative offices, local research institutes or associations
Definition Experts
number Associazione Cacciatori Trentini Local hunters association 1 Associazioni produttori ortofrutticoli Trentini
(APOT)
Association of local farmers 1
Associazione Troticoltori Trentini Local trout breeder association 1 Fondazione Edmund Mach (FEM) Edmund Mach Foundation - Research institute 6 FEM - Centro di Ecologia Alpina FEM - Centre for Alpine Ecology 1 Museo Civico di Rovereto Civic Museum of Rovereto 1 MUseo delle Scienze (MUSE) Science museum of Trento 1 Provincia autonoma di Trento (PAT) - Agenzia
Provinciale per la Protezione dell'Ambiente (APPA)
PAT- Local Environmental Protection Agency 3
PAT - Agenzia Provinciale per i Pagamenti in agricoltura (APPAG)
PAT - Agency for payments of public subsidies in agriculture
1
PAT - Dipartimento Agricoltura Food and Agriculture Department 4 PAT -
Dipartimento Territorio, Ambiente e Foreste
PAT - Territory, Environment and Forests Department
3
PAT - Servizio Bacini Montani PAT - Rivers and streams office 1 PAT - Servizio Conservazione della Natura e
Valorizzazione Ambientale
PAT - Nature conservation office 2
PAT - Servizio Foreste e Fauna PAT - Forests and wildlife office 8
PAT - Servizio Geologico PAT - Geologic office 3
PAT - Servizio Gestione Risorse Idriche ed Energetiche
PAT - Water and energy resources office 2
PAT - Servizio Minerario PAT - Mining office 2
PAT - Servizio Statistica PAT - Statistics office 1 PAT - Servizio Urbanistica e Tutela del Paesaggio PAT - Urban and landscape planning office 2 Unità Operativa Igiene e Sanità Pubblica
Veterinaria
PAT - Operative unit for hygiene and public veterinary medicine
3
Università di Trento - Dipartimento di Ingegneria civile, ambientale e meccanica (DICAM) - Gruppo di idrologia
University of Trento - DICAM - Group of Hydrology 2
Università di Trento - DICAM - Gruppo di meteorologia
University of Trento - DICAM - Group of Meteorology
three "themes" (provisioning, regulating and cultural services). ESs themes, groups and types
are listed in Table 2.3. From this point onwards, the acronym "ESs" will stay for "ESs types".
ESs are also described according to the following characteristics: their the degree of access,
renewability and storability. Costanza (2008) proposed an ESs classification based on the
degree to which users can access freely to them, i.e. based on the consumption rivalry and the
ability to exclude non-payers. This classification reflects the economic classification of goods:
public, private, common and club (Table 2.2). Renewability is the ability of ecosystems to
guarantee a continuous provision of the service through the years, while Storability indicates
the property of ESs to be used in a long period after the provision.
Table 2.2. Economic classification of goods (adopted from Costanza, 2008) No rival Rival
No excludable Public Common Excludable Club Private
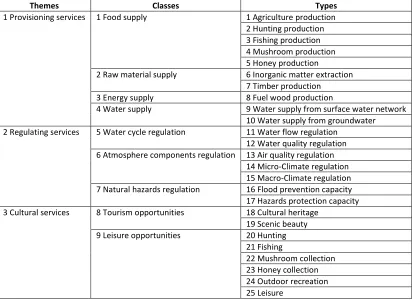
Table 2.3. List of 25 ESs types, grouped in nine classes and three themes. The classification framework follows Haines-Young et Potschin (2010), while the names are adapted from Mayes et al. (2011).
Themes Classes Types
1 Provisioning services 1 Food supply 1 Agriculture production 2 Hunting production 3 Fishing production 4 Mushroom production 5 Honey production
2 Raw material supply 6 Inorganic matter extraction 7 Timber production 3 Energy supply 8 Fuel wood production
4 Water supply 9 Water supply from surface water network 10 Water supply from groundwater 2 Regulating services 5 Water cycle regulation 11 Water flow regulation
12 Water quality regulation 6 Atmosphere components regulation 13 Air quality regulation
14 Micro-Climate regulation 15 Macro-Climate regulation 7 Natural hazards regulation 16 Flood prevention capacity 17 Hazards protection capacity 3 Cultural services 8 Tourism opportunities 18 Cultural heritage
19 Scenic beauty 9 Leisure opportunities 20 Hunting
21 Fishing
2.3
Provisioning services
Agriculture production
It is the ability of any cultivated land to provide vegetable food for people and animals (MA,
2003; Burkhard et al., 2009 and Maes et al., 2011b). It is a private, renewable and storable
good. In Trentino, agriculture is practiced for commercial purposes and agricultural products
are trade all around Italy (e.g. apples are the 25% of national production). 5.8% of the region is
occupied by agricultural areas where 27 types of agricultural products are cultivated: kiwi,
grapes, apples, pears, olives, plums, cherries, apricots, hazelnuts, walnuts, chestnuts (tree
farming), polyphitic/monophitic grass and grasslands, corn (crop cultivation) and potatoes,
lettuces, carrots, cabbage, pumpkins and small fruits - gooseberries, strawberries, redcurrants,
blackberries, raspberries and blueberries (market gardening).
Hunting production
It is the availability of animals for hunting and it is a common, renewable and storable good. In
Alpine regions it is not a primary source of food but it involves natural ecosystems with a large
potential in providing food for local people. In Trentino the activity mostly aims to regulate the
presence of animals; the region is divided in 226 game reserves and the service supply is
planned at administrative level for every game reserve: there are rules and restrictions about
the game season, the species and the number of animals that can be hunted. Moreover, in the
Stelvio National Park (in the north-west of Trentino) hunting is forbidden. Species available for
hunting are ungulates (Roe deer, Red deer, Chamois, Muflon and Wild boar), big birds (Rock
partridge and Black grouse), some species of songbirds and little mammals (Fox, Hare, Alpine
hare). The activity represents also a cultural service.
Fishing production
It is the availability of fish in the water network, both in rivers and lakes. It is a common,
renewable and storable good. In Trentino each river or lake is divided into fishing zones (7776
for rivers and 379 for lakes), in order to measure the fish biomass and the caught. Fishing can
be practiced only for self consumption; any angler can catch maximum five units per day. Since
trout), Thymallus thymallus (Grayling), Coregonus lavaretus (Lavaret), Esox lucius (Pike), Perca
fluviatilis (Perch), Salmo gairdneri (Rainbow trout), Cyprinus carpio (Common carp), Salvelinus
alpinus (Arctic char), Salvelinus fontinalis (Brook trout) and Tinca tinca (Tench). The service
does not consider the fish production by aquaculture. The activity represents also a cultural
service.
Mushroom production
Forest ecosystems provide suitable conditions for the production of mushroom. Conditions
depend on the pedological-lithological characteristics of the forest subsoil and on the forest
typologies. Mushrooms are a common, renewable and storable good. The activity represents
also a cultural service.
Honey production
Forest and grass ecosystems provide suitable conditions for the production of nectar and
honeydew. Conditions depend on the slope, altitude, forest typologies and on the presence of
obstacles for bees (like lakes or walls); in fact, bees cannot fly more than 500 m far away from
their hive and over a water surface. Honey is a common, renewable and storable good. The
activity represents also a cultural service.
Inorganic matter extraction
It is a no-biomass product for human constructions or other uses and it represents a private,
non-renewable and storable good. In Italy the extractions are regulated by a royal law of 1936,
that defines mines as inorganic matters of national interest (e.g. mineral water, dolomite rock)
and quarries as inorganic matters of local interest (e.g. clay, basalt, limestone). The law
regulates the extraction rights: the exploitation of mines is planned at national level, while the
exploitation of quarries is planned at local administrative level. The provincial plan establishes
the amount of matter annually extractable for each quarry every 10 years. The exploitation
rights are related to the market trends, the economic convenience and the avoidance of
environmental hazards: e.g. erosions or landslides. The inorganic matter of Trentino quarries
Timber production
It is a biomass product of forests for building or other uses and it represents a private,
renewable and storable good. Trentino forests cover more than 56% of the total area and 75%
of them are public. In order to guarantee the provision of material through the years and to
maximize the income of felling, the service supply is planned at administrative level in each
public property and also in some large private properties, every 10 years. The growing stock
and the increment of wood are monitored, in order to estimate the amount that can be cut
per year while ensuring the sustainability. In Trentino the most renowned timber is that of
Valle di Fiemme (in the North-East of the region), whose wood is used to make violins.
Fuel wood production
It is the ability of ecosystems to provide wood for energy production. This ES is a private,
renewable and storable good. In Trentino fuel wood is mostly supplied for domestic use and its
provision follows the same rules of the service Timber production. Fuel wood is the only ES for
the energy production considered in this study. The other energy resources (e.g. biomass, sun,
wind and water) have been disregarded because of lack of data.
Water supply from surface water network
Water for drinking, irrigation and industrial uses is withdrawn by the surface water network. In
Trentino water is withdrawn from 2803 points over rivers, lakes and reservoirs. The quality of
water ecosystems is guaranteed by the fact that a minimum discharge is assured in each water
course. The service is a private, renewable and storable good.
Water supply from groundwater
Aquifers also provide water for drinking, irrigation and industrial uses. Water is withdrawn in
10617 points (springs or wells) and its quality is assured by a area of respect of 200 m around
each point, where any activity is forbidden. The service is a private, renewable and storable
2.4
Regulating services
Water flow regulation
It is the capacity to accumulate water and to regulate the hydrological flows in normal weather
conditions. Water is accumulated mostly in lakes/reservoirs (in Trentino they are 372 elements
for 4657 ha), in glaciers (3775 ha) and in aquifers (no precise data on their capacity are
available). Rainfall, snow melting processes, evapotranspiration and water losses due to
percolation towards deep aquifers, contribute to the long term average discharge production
per sub-catchment. The ES represents a public, renewable and non-storable good.
Water quality regulation
It is the capacity of permeable riverbeds and riparian areas to regulate the chemical elements
in water, by filtering and absorbing incoming pollutants from agricultural activities. In Trentino
87% of the riverbeds are permeable (total river length: 5920 km), while the 13% is disturbed by
the presence of impermeability elements like, training walls or paved channel (total length in
rivers: 753 km), and groynes or dikes (15603 groynes or dikes dislocated in the water network).
The hygrophilous vegetation in riparian areas has the best capacity in absorbing pollutants but
it is only the 3% of the whole area close to rivers; active riparian areas are those 30 m around
the water course. The ES represents a public, renewable and non-storable good.
Air quality regulation
It is the capacity to regulate the concentration in the air of the pollutants affecting human
health and the quality of urban life. In Trentino, the presence of mountains and valleys
influences local circulations, sensibly reducing the pollutants’ transport range. Moreover, the
presence of forests may help the deposition of such pollutants. At local scale, the presence of
buildings, trees or other obstacles close to the roads may prevent the dispersion of pollutants
emitted by the cars. In general, the air quality regulation capacity of rough surfaces depends
on their proximity to the emission sources; the regulating effect of forests depends also on
their density and on the type of trees (Jim and Chen, 2008). The ES represents a public,
Micro-Climate regulation
Forests actively contribute to mitigating microclimate conditions, in terms of temperature and
humidity, with positive effects for human habitations and health (Teuling et al., 2010). In fact,
they provide shadow with transpirations attitudes, that depend on the forests shape and the
density of trees. The ES represents a public, renewable and non-storable good.
Macro-Climate regulation
The extraction and the stock of the carbon dioxide from the atmosphere are essentially
performed by forest and agriculture ecosystems. In Trentino the growing stock and the
stocking capacity of forest ecosystems is significant (forest covers more than 56% of Trentino)
and it has been accurately measured. Indeed, Rodeghiero et al. (2010) built an inventory of the
organic carbon stored in the forest ecosystems in both above- and below-ground pools,
according to the Kyoto protocol and IPCC requirements. The ES represents a public, renewable
and storable good.
Flood prevention capacity
It is the capacity of the territory of preventing negative consequences for human life and
buildings coming from natural events like floods, debris flows, landslides and avalanches. The
ES represents a public, renewable and non-storable good.
Hazards protection capacity
Forest vegetation covers an important role in the stabilization of the terrain during floods,
debris flows, landslides and avalanches. Forests are also important for the protection of
building and infrastructures from falling rocks, by mechanical action. Despite the presence of
large and extended forested areas in Trentino 1609 floods and debris flows, 6527 landslides
and 644 avalanches occurred from 1965 to 2005 (ARCA, 2006). The ES represents a public,
2.5
Cultural services
Cultural heritage
Ecosystems may create the conditions for the visit of cultural heritage sites. The ES represents
a public, renewable and non-storable good. The regional landscape plan (PUP, 2008) has
identified 173 landscape goods and 595 archeological sites. Landscape goods are: historical
and rural buildings within an appreciable natural landscape, like castles and isolated churches,
monumental trees, and waterfalls.
Scenic beauty
Ecosystems may create landscapes of particular beauty, inspiring spiritual, aesthetic values and
historic memory. The ES represents a public, renewable and non-storable good. The regional
landscape plan (PUP, 2008) has identified 199 points of natural and cultivated ecosystems of
particular beauty, 396 landscape fronts (i.e. terraces), 173 landscape goods and 595
archeological sites.
Hunting
It represents a leisure activity performed by more than 7000 hunters at year. It depends on the
availability of animals in game reserves. The ES represents a common, renewable and
non-storable good. In Trentino hunting is planned at administrative level, in order to guarantee the
activity through the years. There are specific rules and restrictions about game season, the
species and number of animals that can be hunted. For further details see the service Hunting
production above.
Fishing
This leisure activity depends on the availability of fish in fishing zones. For further details see
the service Fishing production above. The ES represents a common, renewable and
non-storable good.
Mushroom collection
It is a leisure activity and depends on the availability of mushroom of good quality in forests.
The ES represents a common, renewable and non-storable good. According to local
can gather without any permit, while visitors must get a permit and pay a fee (that is 12€ per
person). The activity is usually performed three km close to forest roads. For further details see
the service Mushroom production above.
Honey collection
This leisure activity depends on the availability of nectar and honeydew in forests, pasture and
scrublands. The ES represents a common, renewable and non-storable good. Trentino honey is
of good quality and its production is principally for self-consumption The activity is mostly
performed 150 m close to forest roads, that is the maximum distance walked by beekeepers
bearing hives. For further details see the service Honey production above.
Outdoor recreation
Trentino environment offers several opportunities to practice outdoor activities, like walking,
cycling, climbing, skiing, rafting, windsurfing and sailing. At 2008 cycling paths were 573 km
long and forest roads 7532 km; there were also 236 ski lifts. Mountaineering is practiced both
in summer and winter over 984 paths long more than 5000 km. About 45 Alpine refuges can
host climbers and trekkers. The ES represents a club, renewable and non-storable good.
Leisure
In Trentino, lakes and forests provide opportunities to spend free time and relax. 372 lakes are
spread all over the region. Large lakes are present in the valleys bottom, while small lakes up
to the highest mountain peaks. The ES represents a public, renewable and non-storable good.
2.6
Conclusion
Undoubtedly, a certain degree of subjectivity affects the selection of ESs, as involved experts
have personal opinions. However, the high number of experts and of institutions they belong
to, ensures acceptable robustness to the selection.
Selected ESs are typical of semi-urbanized areas with large forests: in fact, 18 services are
provided by forest ecosystems. A number of them is typical of Alpine regions, like Hazard
protection capacity and Water flow regulation by glaciers. The number of ESs belonging to
renewable resources used by local communities to satisfy a wide range of wellbeing needs. 11
ESs (all the provisioning and one regulating service) are storable. All regulating services are
public goods, while provisioning are common or private goods and cultural are public, common
3
Mapping ecosystem service indicators
The assessment of ESs typically consists in the computation of indicators that can measure
specific characteristics of ESs (Carpenter et al., 2006; Vihervaara et al., 2010; Haines-Young, et
al., 2012). Such indicators may be used to include ESs in decisions that regard the management
of ecosystems (Egoh et al., 2007; Goldman and Tallis, 2009; de Groot et al., 2010; Muller et
Burkhard, 2012). In this Chapter indicators for 25 ESs of Trentino are identified. Indicators are
selected among a great number listed in 19 peer reviewed papers and scientific reports, by 51
experts of local administrative offices and research institutes, and according to two criteria: (1)
indicators must measure the biophysical, economic and socio-cultural value, in terms of stock
and flow, and must take into account of the spatial heterogeneity of the ESs supplied, and (2)
indicators must be computed with existing and available data.
Each indicator is described by reporting: a definition, the ES value that it is measured, whether
indicators is a proxy of the measure, data and methods for the computation and mapping. In
particular, in Section 3.1 a rational for mapping ESs is proposed, in Section 3.2 the list of peer
reviewed papers from which indicators are selected, the explanation of selection criteria
followed by experts and the table of selected indicators for each ES are reported. In Section
3.3, Section 3.4 and Section 3.5 each indicator is described; the unit of measurement, data and
mapping methods are summarized in a table. Conclusions are in Section 3.5.
3.1
Key issues on ecosystem service
mapping
The need to assign values to ESs was already emphasized by Westman (1977). Since then, the
science of the ESs assessment has been improved: several indicators for the measure of the
ESs values have been defined (e.g. Daily, 1999; de Groot et al. 2002 and 2006; Grêt-Regamey
et al., 2007; Liu et al., 2010), and the modelling of such indicators has been developed (e.g.
Nelson et al., 2009; Maes et al., 2011b; Van Oudenhoven et al., 2012), as well their mapping
(Willemen et al., 2008; Raudsepp-Hearne et al., 2009; Plieninger et al., 2013). In this Section
main issues on the definition of ESs indicators, on the selection of the proper ones (based on
the ESs supply across the region) are explored, in order to provide background knowledge for
the assessment of the ESs in the Trentino region.
Multiple indicators need to be defined for a single ES in order to account for the variety of
meanings of the ES concept (see Section 2.1) (Niemeijer and de Groot, 2008; Cowling et al.,
2008). Several lists of ESs indicators have been developed through the years (e.g. Daily and
Ehrlich, 1999; Eales et al., 2007; Burkhard et al., 2009; Liu et al., 2010), each of them reporting
a single indicator for each service (Niemeijer and de Groot, 2008). For instance, Turner et al.
(2010) proposed a contingent valuation to assess the economic value of the carbon storage, in
the perspective to link the ecology and economy for the ecosystem management, while
Naidoo et al. (2008) proposed a land cover based proxy indicator to produce a spatial
representation of the state of the carbon storage.
Prerequisites for the selection of proper indicators for a single service are their applicability
and utility in the study context (de Groot et al., 2010). Specific criteria are identified in order to
ensure scientific credibility of selected indicators: measurability, low resource demand,
international compatibility, analytical soundness, policy relevance and sensitivity to changes
(Dale and Beyeler, 2001; Niemeijer and de Groot, 2008). Anyway, the ESs assessment may
involve further aspects:
• Supply and demand assessment. ESs are supplied by the ecosystems in relation to a human well-being demand (Carpenter et al., 2006). Supply and demand involve two
complementary perspectives: an ecological and an anthropogenic one. At present,
research efforts have been focused mostly on the supply assessment (the ecological
perspective), while little has been done on the demand side (Nelson et al., 2008;
Grêt-Regamey et al., 2012b; Maes et al., 2012;). In contrast, field applications of the ES concept
start from the assessment of the ES demand to promote sustainable management of
ecosystems and sustainable use of the ESs supplied (Goldman et al., 2008).
• Real and potential supply assessment. The definition of indicators for the assessment of the curren