Experimental Verification of Dynamic Modelling of
Nitrogen Adsorption on Zeolite 13X with VSA Process
Abolfazl Karimi1,*, Peyman Emrani1, Marjan Haghayegh2
1School of chemical Engineering, University of Tehran, Tehran, Iran
2Young Researchers and Elites club, Science and Research Branch, Islamic Azad University, Tehran, Iran
Abstract
The four-step vacuum swing adsorption process applying zeolite 13X is studied in order to separate oxygenfrom air. Effects of the duration of vacuum stage, pressure drop and NMP solvent as a coat of the adsorbent are evaluated. An adsorption model is utilized for isothermal adsorption system by different mechanisms containing local equilibrium and solid diffusion model. Linear isotherm can describe the adsorption process, appropriately. Moreover, linear driving force, LDF, is used as the mass transfer approximation, in solid diffusion model. By this approximation and finite difference solution, ODE equations are solved by Runge-Kutta method using MATLAB. Solid diffusion model utilizing one fitting parameter predicts the breakthrough curve properly more compatible than another theory. The appropriate solid diffusion coefficient utilized as the fitting parameter is 10-10m2/s. The model accuracy is evaluated, and the error values of equilibrium and solid diffusion
model from experimental data are reported 11.7, 1.17, respectively.
Keywords
Vacuum swing adsorption, Zeolite 13X, Oxygen, Nitrogen, Mathematical model1. Introduction
Oxygen is used in the various aspects such as metallurgical industry, glass-making and ceramic industry, and wastewater treatment [1]. Vacuum/ pressure swing adsorption process(VSA/PSA) is the developed operation to separate and purify gasses, which is based on adsorption ability and selectivity of an adsorbent [5, 6]. In 1970, this method was initially utilized to generate oxygen from air. This technology has advantages compared with various procedures used to separate of air and manufacture oxygen such as cryogenic distillation, membrane and chemical absorption method [2]. In other words, VSA/PSA process is a safe and automatic method, which requires small investment with low energy requirement that would be put in/exit from the service easily [1]. The development of highly selective adsorbents such as LicaX and LiAgX facilitates the generating oxygen up to 200 tons/day by VSA process, which is competitive with cryogenic distillation [2]. Also, VSA process is more economic to produce of over 15 ton/day oxygen in comparison with PSA process [1, 2].
In VSA process, adsorption and desorption pressure, and the adsorbent capacity are key factors to separate of air, efficiently. The optimal vacuum pressure and time play the critical role to reduce the cost of equipment and energy. For
* Corresponding author:
[email protected] (Abolfazl Karimi) Published online at http://journal.sapub.org/scit
Copyright © 2017 Scientific & Academic Publishing. All Rights Reserved
air separation, most industries operate VSA process in the ambient temperature, adsorption pressure of 1.1 to 1.8 atm and desorption pressure of 0.05 to 0.3 atm. Moreover, choosing the regeneration method depends on the adsorbent, adsorption ability and operating condition of the unit [2].
Apart from the experimental investigations, mathematical modeling of VSA process is widely utilized to determine the optimum conditions. Moreover, modeling methods can be useful for process development and scale-up, and provide conceptual procedures to estimate some parameters which are necessary for process design purposes [1, 5, 9].
Linear driving force (LDF) has been applied as a suitable approximation to describe the rate coefficient for extra particle and intra particle mass transfer controlling. Also, intra particle mass transfer can be predicted by four main region: local equilibrium, pore diffusion, solid diffusion, and combined pore and solid diffusion. By these approximation procedures and finite difference method, solid concentration is obtained by solving Ordinary Differential Equation (ODE) equations instead of Partial Differential Equation(PDE) [10, 11].
[16]. Moreover, this model has been employed for isothermal PSA process using zeolite in a column with plug flow and no radial gradient of concentration [17, 18].LDF model with Langmuir isotherm has been studied to predict breakthrough in the fixed bed with axial dispersion and plug flow [19]. A non-isothermal dynamic model using LDF model and the Langmuir-Freundlich isotherm has been applied for VSA process of removing N2 from air using zeolite 13X and 10X. In this study zeolite 13X has produced product with higher purity [2].Budner et al. has generated oxygen by VSA process using CaX zeolite, and provided the non-equilibrium model [1].
The main goal of the present work is the investigation of the operating condition of VSA process which is used to adsorb nitrogen from air by zeolite 13X. For this purpose, the experiments operated in consecutive processes are designed to determine the adsorption time and vacuum required, and the appropriate result is presented in this work. Also, two models of VSA process including equilibrium and solid diffusion model are studied. In order to evaluate the model validity and determine the appropriate model, the results from the mathematical model are compared with experimental data.
2. Experiment
a) Vacuum-swing adsorption system:
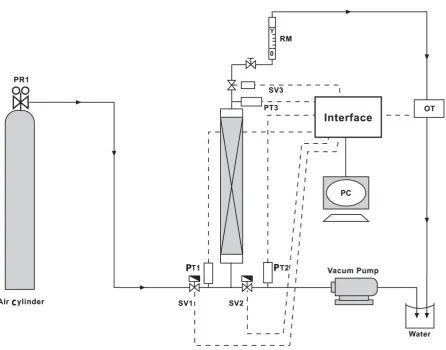
The schematic of the vacuum-swing adsorption apparatus is shown in figure 1. VSA process consists of four stages: pressurize, adsorption, depressurize, and vacuum operation. Adsorption system designed as bench scale includes an adsorption column with pipes, valves, rotameter, oxygen sensor (SENKO-SS1118), vacuum pump (VALUE- VE115), hardware for Data acquisition and software package of SENKO Co. to convert and monitor results. The length and inner diameter of adsorption column made of stainless steel pipe are 0.2 and 0.1 m, respectively. Two perforated plates with mash consisting of thin hole are installed on both ends of column to fix adsorbent. Oxygen sensor and its transmitter which are located in a handmade sheath can measure the concentration with response time of 15 to 20 seconds. Oxygen concentration versus sampling time is stored as HEX format, and it is converted to decimal numbers by coding in MATLAB. Sampling time is adjustable, and it is considered 1 second which is appropriate regarding to adsorption rate.Moreover, since oxygen sensor should not be under gas pressure, a needle valve is utilized after the adsorbent column and in front of the sensor.
Table 1. Properties of the adsorbent Adsorbent Size range (mm) Tapped bulk density(g/l) 𝑁𝑁2 adsorption (ml/g)
-1013 mbar, 25℃ porosity Pore diameter (nm) Zeolite 13X
(Zeochem Co.) 0.6 580-680 >21.5 0.4 0.8
The air mixture which contains N2 and O2 (78/21 Vol.%) enters the fixed bed as feed gas. 532 g of zeolite 13X, which does not absorb oxygen and contains spherical particles, is located as an adsorbent in the column. The characteristics of the adsorbent are listed in Table 1.The process is operated with two consecutive cycles by pressurizing of 2 bar, adsorbing with flow rate of 1.5 lit/min, depressurizing to 0 bar and evacuating the bed. By using pressure in the adsorption step, nitrogen molecules pierce in particles pores, so the bed should be regenerated. By reducing pressure, the fixed bed cannot adsorb N2 in the second cycle, which states that the bed cannot be revived. Hence, in order to regenerate the adsorbent, the vacuum operation is applied. The vacuum pump is utilized in the range of 570 mmHg (25% of absolute atmosphere pressure) for 15 minutes. In this stage, input and output (I/O) routes are closed, and nitrogen adsorbed by bed is evacuated from bypass path. In order to assure of completely removing of nitrogen molecules, the outlet pipe of vacuum pump is put in a vessel of water. Therefore, whenever bubbles do not exit, it means that no gas exists in the bed. Moreover, by this way, air cannot enter to sensor chamber through outlet route in low flow rates. The VSA experiments will continue until outer concentration of O2 becomes near to inner concentration, which states that the adsorbent is saturated.
b) Determining the bed porosity:
A graduated cylinder whose volume is 𝑉𝑉𝑏𝑏 is filled with
the adsorbent. By weighing this cylinder containing adsorbent (𝑚𝑚S) and one particle of zeolite, the number of particles is determined in this volume, so the volume of all particles is calculated. By subtracting of this volume from 𝑉𝑉𝑏𝑏,
the volume of empty space is calculated as follow.
𝜀𝜀𝑏𝑏 =�6𝑉𝑉𝑏𝑏𝑚𝑚𝑝𝑝−𝜋𝜋𝑑𝑑𝑝𝑝
3𝑚𝑚𝑆𝑆
6𝑚𝑚𝑝𝑝𝑉𝑉𝑏𝑏 � (1) c) Calculating the amount of adsorption:
The amount of adsorbed nitrogen per mass of adsorbent is obtained by equation (2).
m =Qmρ s∫(1−
c c0 τ
0 ) dt (2)
The mole fraction and density of adsorbed nitrogen considered as ideal gas law is calculated as follow:
𝑦𝑦𝑁𝑁2= 1− 𝑦𝑦𝑜𝑜2 (3) ρ=PMRT (4)
3. Mathematical Modeling
Mathematical model is required to perceive the behavior
of the adsorption bed during the VSA process. This model is based on the following assumptions:
(1) The process is isothermal.
(2) The particles are spherical and they are packed uniformly into the fixed bed with homogeneous porosity.
(3) Equilibrium equations of nitrogen and oxygen components are represented by binary Henry isotherm.
(4) The gas phase behaves as an ideal gas.
(5) The flow pattern is described by the axially dispersion flow.
(6) Radial concentration gradient is negligible.
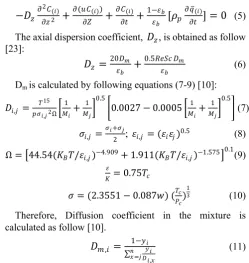
The component mass balance for the gas phase in the adsorption bed is derived by the following equation [8]:
−𝐷𝐷𝑧𝑧𝜕𝜕
2𝐶𝐶(𝑖𝑖)
𝜕𝜕𝑧𝑧2 +
𝜕𝜕(𝑢𝑢𝐶𝐶(𝑖𝑖))
𝜕𝜕𝜕𝜕 + 𝜕𝜕𝐶𝐶(𝑖𝑖)
𝜕𝜕𝜕𝜕 +
1−𝜀𝜀𝑏𝑏 𝜀𝜀𝑏𝑏 [𝜌𝜌𝑝𝑝
𝜕𝜕𝑞𝑞�(𝑖𝑖)
𝜕𝜕𝜕𝜕 ] = 0 (5)
The axial dispersion coefficient, 𝐷𝐷𝑧𝑧, is obtained as follow
[23]:
𝐷𝐷𝑧𝑧 =20𝜀𝜀𝐷𝐷𝑏𝑏𝑚𝑚 +0.5𝑅𝑅𝑅𝑅𝑆𝑆𝑅𝑅 𝐷𝐷𝜀𝜀𝑏𝑏 𝑚𝑚 (6)
Dm is calculated by following equations (7-9) [10]:
𝐷𝐷𝑖𝑖,𝑗𝑗 = 𝑇𝑇 15
𝑝𝑝𝜎𝜎𝑖𝑖,𝑗𝑗2Ω�
1
𝑀𝑀𝑖𝑖+
1
𝑀𝑀𝑗𝑗�
0.5
�0.0027−0.0005�𝑀𝑀1
𝑖𝑖+
1
𝑀𝑀𝑗𝑗�
0.5
�(7)
𝜎𝜎𝑖𝑖,𝑗𝑗 =𝜎𝜎𝑖𝑖+2𝜎𝜎𝑗𝑗; 𝜀𝜀𝑖𝑖,𝑗𝑗= (𝜀𝜀𝑖𝑖𝜀𝜀𝑗𝑗)0.5 (8)
Ω=�44.54(𝐾𝐾𝐵𝐵𝑇𝑇/𝜀𝜀𝑖𝑖,𝑗𝑗)−4.909+ 1.911(𝐾𝐾𝐵𝐵𝑇𝑇/𝜀𝜀𝑖𝑖,𝑗𝑗)−1.575�0.1(9) 𝜀𝜀
𝐾𝐾= 0.75𝑇𝑇𝑅𝑅
𝜎𝜎= (2.3551−0.087𝑤𝑤) (𝑇𝑇𝑅𝑅
𝑃𝑃𝑅𝑅)
1
3 (10)
Therefore, Diffusion coefficient in the mixture is calculated as follow [10].
𝐷𝐷𝑚𝑚,𝑖𝑖=∑1−𝑦𝑦𝑦𝑦𝑖𝑖𝑖𝑖 𝐷𝐷𝑖𝑖,𝑥𝑥 𝑛𝑛
𝑥𝑥=𝑗𝑗 (11) The boundary and initial conditions are presented below.
𝐶𝐶(𝑖𝑖)(𝑧𝑧,𝜕𝜕) =𝐶𝐶(𝑖𝑖)(0,𝜕𝜕) +𝐷𝐷𝑢𝑢𝑧𝑧𝜕𝜕𝐶𝐶𝑖𝑖𝜕𝜕𝑧𝑧(0,𝜕𝜕) ; z=0 (12)
𝜕𝜕𝐶𝐶𝑖𝑖(𝑧𝑧,𝜕𝜕)
𝜕𝜕𝑧𝑧 = 0; z=L (13)
𝐶𝐶𝑖𝑖(𝑧𝑧, 0) = 0 (14)
The binary adsorption equilibrium can be estimated by Henry isotherm as follow [10, 20]:
𝑞𝑞𝑖𝑖 =𝑘𝑘ℎ𝑅𝑅𝑇𝑇𝑅𝑅𝑖𝑖 (15)
∆𝑝𝑝=150 𝑑𝑑𝜇𝜇𝐿𝐿
𝑝𝑝
2 (1−𝜀𝜀𝑏𝑏) 2
𝜀𝜀𝑏𝑏3 𝑣𝑣𝑠𝑠+
1.75 𝐿𝐿𝜌𝜌 𝑑𝑑𝑝𝑝
(1−𝜀𝜀𝑏𝑏) 𝜀𝜀𝑏𝑏3 𝑣𝑣𝑠𝑠
2 (16)
For the each following cases, these equations are resolved numerically by Runge-Kutta method, coded by MATLAB. In order to confirm the model accuracy, the error between the experimental data and model result is obtained as follow:
% 𝑅𝑅𝑒𝑒𝑒𝑒𝑜𝑜𝑒𝑒=𝑁𝑁1∑ 𝑎𝑎𝑏𝑏𝑠𝑠(𝑦𝑦𝑚𝑚𝑜𝑜𝑑𝑑𝑅𝑅𝑚𝑚−𝑦𝑦𝑅𝑅𝑥𝑥𝑝𝑝
𝑦𝑦𝑚𝑚𝑜𝑜𝑑𝑑𝑅𝑅𝑚𝑚 ) × 100 𝑁𝑁
𝑖𝑖=1 (17)
a) Local equilibrium theory
In this theory, the rate of mass transfer is assumed rapid and immediate. Therefore, the mass transfer resistance can be neglected, and the equilibrium between fluid and adsorbed phase is established rapidly in each part of the adsorbent bed. Hence, 𝜕𝜕𝑞𝑞�𝜕𝜕𝜕𝜕 in equation (5) is replaced by 𝜕𝜕𝑞𝑞𝜕𝜕𝜕𝜕∗. 𝑞𝑞∗ is the adsorbed equilibrium concentration in solid phase,
which is determined by Henry isotherm as follow [10, 11]:
−𝐷𝐷𝑧𝑧(𝑖𝑖)𝜕𝜕 2𝐶𝐶
𝜕𝜕𝑧𝑧2+
𝜕𝜕(𝑢𝑢𝐶𝐶)
𝜕𝜕𝜕𝜕 +
𝜕𝜕𝐶𝐶
𝜕𝜕𝜕𝜕 +
1−𝜀𝜀𝑏𝑏
𝜀𝜀𝑏𝑏 [𝜌𝜌𝑝𝑝
𝜕𝜕𝑞𝑞∗
𝜕𝜕𝐶𝐶 𝜕𝜕𝐶𝐶
𝜕𝜕𝜕𝜕] = 0 (18)
𝜕𝜕𝑞𝑞∗
𝜕𝜕𝐶𝐶 =𝑘𝑘ℎ𝑅𝑅𝑇𝑇 (19)
b) Solid diffusion theory:
The zeolite crystal contains micropore states in which diffusion of adsorbate molecules happen within surface wall of the pore. In this case, the diffusion rate can be written in terms of the solute concentration. Hence, rate of mass transfer in adsorbent particles can be obtained as follow [10, 11].
∂𝑞𝑞𝑖𝑖 ∂t =
1
𝑒𝑒2𝜕𝜕𝑒𝑒𝜕𝜕 �𝐷𝐷𝑠𝑠𝑖𝑖𝑒𝑒2𝜕𝜕𝑞𝑞𝜕𝜕𝑒𝑒𝑖𝑖� (20)
Boundary and initial conditions without external resistance are:
�𝜕𝜕𝑞𝑞𝑖𝑖
𝜕𝜕𝑒𝑒�𝑒𝑒𝑝𝑝=0 = 0 (21)
�𝐶𝐶𝑝𝑝𝑖𝑖�𝑒𝑒=𝑒𝑒𝑝𝑝 =𝐶𝐶𝑖𝑖 (22) Initial condition is as follow [10].
�𝐶𝐶𝑝𝑝𝑖𝑖�𝑒𝑒 = 0 (23) With considering LDF approximation, the last term in the equation (5) is defined as:
𝜕𝜕𝑞𝑞𝑖𝑖
𝜕𝜕𝜕𝜕 =𝑘𝑘𝑛𝑛(𝑞𝑞𝑖𝑖∗− 𝑞𝑞�𝑖𝑖) (24)
For solid diffusion, 𝑘𝑘𝑛𝑛 is calculated by equations (23-24)
considering R=1 for linear isotherm [8].
𝑘𝑘𝑛𝑛 =15𝜓𝜓𝑒𝑒𝑝𝑝2𝑠𝑠𝐷𝐷𝑠𝑠𝑖𝑖 (25)
𝜓𝜓=1−0.1060.894𝑠𝑠𝑠𝑠0.5 (26)
𝑞𝑞𝑖𝑖∗ is estimated by Henry isotherm, and the average
amount of adsorption (𝑞𝑞�𝑖𝑖) is calculated by solving the set of
differential mass balance equations of particle. Finally the equation of gas phase in the bed (Eq. 5) and particle phase (Eq. 20) are solved simultaneously, according to the boundary conditions of the particle.
4. Result and Discussion
Figure 2 represents experimental oxygen composition data versus time. The characteristics of air as feed is stated in table 2. According to figure 2, the maximum concentration of oxygen is produced during 0 to 100 seconds because the sites of adsorbent contain no adsorbate at the beginning of the process, so it has the comprehensive potential to adsorb nitrogen. By passing air, the adsorbent becomes saturated, and the adsorption rate decreases between 100 to 280 seconds.
Table 2. Specification of inlet air as feed
Parameter Unit Value
Density kg/m3 2.4*10-3
viscosity kg/m.s 1.846*10-5 Molecular weight g/mole 28.8
flow rate lit/min 1.5 inner pressure Bar 2 outer pressure Bar 1.6
To calculate the theoretical pressure drop, velocity is calculated by volumetric flow rate and cross section of bed, and bed porosity is determined by equation 1. The experimental and theoretical pressure drop (eq. 16) is 0.4 and 0.3558, respectively.
a) Evaluating the time of vacuum stage:
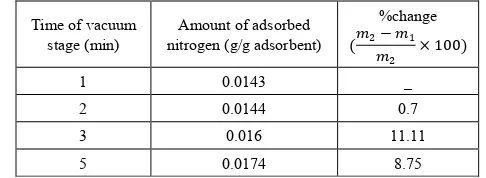
In order to estimate the appropriate duration of vacuum stage, temporal oxygen compositions are studied in different time periods of applied vacuum (560 torr). Therefore, the effect of vacuum condition is determined by calculating the amount of adsorbed nitrogen (Eq. 2) in various time of applied vacuum pressure, which is shown in Table 3. which states that the time of 3 minutes is appropriate for the vacuum stage.
Table 3. The amount of adsorbed nitrogen in different time of vacuum pressure (560 torr)
%change
(𝑚𝑚2𝑚𝑚− 𝑚𝑚1
2 × 100)
Amount of adsorbed nitrogen (g/g adsorbent) Time of vacuum
stage (min) _ 0.0143 1 0.7 0.0144 2 11.11 0.016 3 8.75 0.0174 5
b) Coating the adsorbent by NMP solvent:
The breakthrough curves of zeolite 13X which is covered by 5% and 10% of NMP are shown in figure 4. By much more amount of NMP, the adsorption of nitrogen decreases in the bed. Also, considering to the experiment, coating zeolite by NMP is an exothermic reaction.
c) Comparing the results of experiment and model: In the mathematical model, Henry constant is put 1.1839e10-5 in the Henry isotherm [20]. In order to compare the results of model with experiments, the dimensionless of
nitrogen mole fraction versus time is plotted as the breakthrough curve.
Local equilibrium theory:
Figure 5 shows the effluent nitrogen concentration which is modeled by local equilibrium theory with error of 11.7%. Therefore, this model cannot predict the experimental data appropriately. As a result, non-equilibrium model based on mass transfer rate is applied in the following section.
Figure 2. Temporal profiles of effluent oxygen composition
Figure 3. Temporal profiles of effluent oxygen composition in different time of vacuum pressure (560 torr)
0 50 100 150 200 250 300
20.5 21 21.5 22 22.5 23
time(sec)
O2 c
om
pos
ition i
Figure 4. Temporal profiles of effluent oxygen composition of zeolite 13X covered by the various amount of NMP
Figure 5. The experimental breakthrough curve of nitrogen modeled by equilibrium theory
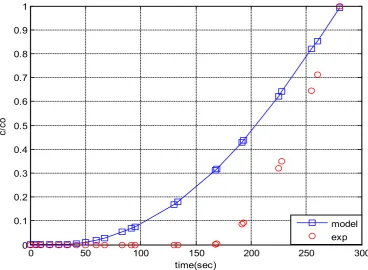
Solid diffusion model
Modeling of adsorbed nitrogen by solid diffusion theory is displayed by figure 6. In this model, zeolite crystallite diffusivity (Ds), which is in the range of 10-7 to 10-14 [8], is
used as the fitting parameter. According to this figure, the single fitting parameter model results in more accurate correlation. Moreover, solid diffusion model is capable to predict the breakthrough curve better than the equilibrium model, with error of 1.17%. Since the pore diameter of
zeolite 13X is less than 1 nm, it is considered as micropore. Hence, its dominant diffusion mechanism occurs on the surface of micropore. Also, the effect of zeolite diffusivity as the fitting parameter is shown by figure 8. Considering the %error values, this parameter affects the model and the amount of 10-10 is suitable to predict the data.
If instate of axil diffusion (3.45e10-4) used molecular diffusion coefficient (1.38e10-5) reduced error percent to 1% that shown in figure 7.
0 200 400 600 800 1000 1200 1400
16 16.5 17 17.5 18 18.5 19 19.5
time(sec)
O
2 c
om
pos
iti
on i
n %
NMP5 NMP10
0 50 100 150 200 250 300
0 0.1 0.2 0.3 0.4 0.5 0.6 0.7 0.8 0.9 1
time(sec)
c/
co
Figure 6. The experimental breakthrough curve of nitrogen modeled by solid diffusion theory
Figure 7. The experimental breakthrough curve of nitrogen modeled by solid diffusion theory without dispersion
0 50 100 150 200 250 300
0 0.2 0.4 0.6 0.8 1 1.2 1.4
time(sec)
c/
co
Ds=10-10
model exp
0 50 100 150 200 250 300
0 0.2 0.4 0.6 0.8 1 1.2 1.4
time(sec)
c/
co
Ds=10-10
Figure 8. The effect of zeolite diffusivity on solid diffusion model
5. Conclusions
Vacuum swing adsorption using zeolite 13X is carried out in order to produce oxygen by separating air. It is obtained that VSA process is much more appropriate and applicable than PSA. According to study the effect of vacuum stage on adsorbing nitrogen, the time of 3 minutes is suitable to regenerate the adsorbent. Moreover, it is observed that coating the zeolite by NMP solvent has the detrimental effects on the structure of the adsorbent. Hence, the low amount of NMP decreases the adsorption, and its high amount deactivates the zeolite. Also, the pressure drop during the experiments is compared with Ergun equation, which has 11% error. The mass balance of the adsorption bed with isothermal process, axially dispersion flow and Henry adsorption isotherm is applied to study the adsorption of nitrogen. This model is investigated for two cases containing local equilibrium, and solid diffusion model. Solid diffusion model with LDF approximation is used successfully to correlate the adsorbed nitrogen versus time. The modeling result is improved by using adsorbent diffusion coefficient as a fitting parameter.% error values are 11.7% for equilibrium model and 1.17% for solid diffusion model with one fitting parameter.
ACKNOWLEDGEMENTS
Authors of this work wish to appreciate Dr. Fatemeh Zabihi and Dr. Ali Farzi for their attendance and Alireza Salehpour for his technical support and consultation.
Abbreviation
C fluid-phase concentration, mol/𝑚𝑚3
𝐶𝐶𝑝𝑝 pore fluid-phase concentration, mol/𝑚𝑚3
𝐶𝐶0 initial fluid-phase concentration, 𝑚𝑚2/𝑠𝑠 dp particle diameter, m
𝐷𝐷𝑧𝑧 axial dispersion coefficient, 𝑚𝑚2/𝑠𝑠
𝐷𝐷𝑠𝑠 adsorbed-phase (solid) diffusion coefficient, 𝑚𝑚2/𝑠𝑠
𝐷𝐷𝑚𝑚 axial diffusion coefficient, 𝑚𝑚2/𝑠𝑠
𝑘𝑘𝑛𝑛 rate coefficient based on adsorbed-phase concentration driving force, 𝑠𝑠−1
𝑘𝑘ℎ Henry constant
𝑘𝑘𝐵𝐵 Boltzmann constant, J/K
𝐿𝐿 bed length, m
𝑚𝑚𝑝𝑝 mass of the adsorbent particle, kg ms mass of adsorbent
m adsorbed nitrogen, kg/kg adsorbent
𝑀𝑀𝑖𝑖 molecular weight i, kg/kmol
P pressure, bar
pc critical pressure, bar
Q flow rate, m3/s
𝑞𝑞� average amount of adsorption, mol/kg adsorbent
𝑞𝑞 amount of adsorption, mol/kg adsorbent
𝑞𝑞∗ adsorbed equilibrium concentration, mol/ 𝑚𝑚3
𝑅𝑅 gas constant, 𝑃𝑃𝑎𝑎𝑚𝑚3⁄(𝑚𝑚𝑜𝑜𝑚𝑚𝐾𝐾)
sf separation factor
𝑅𝑅𝑅𝑅 Reynolds number r particle radial coordinate, m
𝑒𝑒𝑝𝑝 particle radius, m
0 50 100 150 200 250 300
0 0.2 0.4 0.6 0.8 1 1.2 1.4
time(sec)
c/
co
𝑆𝑆𝑅𝑅 Schmidt number T time, s
T Temperature, K
𝑇𝑇𝑅𝑅 critical Temperature, K
u velocity, m/s
𝑉𝑉𝑏𝑏 volume of graduated cylinder, 𝑚𝑚3
𝑉𝑉𝑅𝑅 critical volume, 𝑚𝑚3
𝑣𝑣𝑠𝑠 superficial velocity, m/s
w acentric factor
y fluid-phase mole fraction Z bed axial coordinate, m
𝜀𝜀𝑝𝑝 particle porosity
𝜀𝜀𝑏𝑏 bed porosity
𝜀𝜀 void fraction of packing (extraparticle) Λ partition ratio
𝜇𝜇 fluid viscosity, kg/(m s) Ω diffusion collision
𝜓𝜓 LDF correction factor
𝜌𝜌 fluid density, kg/𝑚𝑚3
𝜌𝜌𝑝𝑝 particle density, kg/𝑚𝑚3
𝜎𝜎 collision diameter, (°A)
𝜏𝜏 adsorption time i, j component index
REFERENCES
[1] Z. Budner, J. Dula, W. Podstawa, A. Gawdzik., “Study and modeling of the vacuum swing adsorption (VSA) process employed in the production of oxygen.” J. Trans IChemE, 1999; 77, Part A: 405-412.
[2] Jeong-Geun JEE, Jin-Hwan JUNG, Jae-Wook LEE, Soong-Hyuck SUH and Chang-Ha LEE. “Comparison of vacuum swing adsorption process for air separation using zeolite 10x and 13x”J. Revue Roumaine de Chimie, 2006; 51(11): 1095–1108.
[3] Ade´lio M. M. Mendes, Carlos A.V. Costa, Alı´rio E. Rodrigues, “Oxygen eparation from air by PSA: modelling and experimental results Part I: isothermal operation”, Separation and Purification Technology 24 (2001) 173–188. [4] Y. Y. LI, S. P. PERERA and B. D. CRITTENDEN.
“ZEOLITE MONOLITHS FOR AIR SEPARATION, Part 2: Oxygen Enrichment, Pressure Drop and Pressurization” ransIChemE, Vol 76, Part A, November 1998.
[5] Saleh Shafeeyan, M., Wan Daud, W. M. A. Shamiri, A. “A review of mathematical modeling of fixed-bed columns for carbon dioxide adsorption.” J. chemical engineering research and design, 2013. Volume 92, Issue 5, Pages 961–988. [6] Zhang, J., Xiao, P., Li, G., Webley, P. A. “Effect of Flue Gas
Impurities on CO2 Capture performance from flue gas at coal-fired power stations by vacuum swing adsorption” J. Energy Procedia 1, 2009: 1115–1122.
[7] Yuwen, Z., Yuyuan, W., Jianying, G., Jilin, Z. “The experimental study on the performance of a small-scale oxygen concentration by PSA” J. Separation and Purification
Technology, 2005; 42: 123–127.
[8] Dantas, T.L.P., Luna, F.M.T., Silva Jr., I.J., de Azevedo, D.C.S., Grande, C.A., Rodrigues, A.E., Moreira, R.F.P.M. “Carbon dioxide-nitrogen separation through adsorption on activated carbon in a fixed bed.” Chem. Eng. J., 2011; 169: 11–19.
[9] Lua, A.C. and Yang, T. “Theoretical and experimental SO2 adsorption onto pistachio-nut-shell activated carbon for a fixed-bed column.” Chem. Eng. J., 2009; 155: 175–183. [10] Green, D. and Perry, R. Chemical Engineer’s Handbook (8th
edn), Chap 16, New York, McGraw-Hill, 2002.
[11] M.Siahpoosh, Sh. Fatemi, A. Vatani, Mathematical modeling of single and multi-component adsorption fixed beds to rigorously predict the mass transfer zone and breakthrough curves, Iran. J. Chem. Eng., 2009; 28, No. 3: 25-44.
[12] N.S. Raghavan, M.M. Hassan, D.M. Ruthven, “Numerical simulation of a PSA system. Part I: Isothermal trace component system with linear equilibrium and finite mass transfer resistance.” AIChE J., 1985; 31: 385–392.
[13] L.H. Shendalman, and J.E. Mitchell, “A study of heat less adsorption in the model system CO2 in He”, J. I. Chem. Eng.
Sci., 1972; 27: 1449–1458.
[14] S. Kaguei, L. W. Shemilt, N. Wakao, “Models and experiments on adsorption columns with constant wall temperature-radially varying and radially lumped models.” J. Chem. Eng. Sci., 1989; 44: 483–491.
[15] S. Kaguei, Q. Yu, N. Wakao, “Thermal waves in an adsorption column: parameter estimation.” J. Chem. Eng. Sci., 1985; 40: 1069–1076.
[16] K. S. Hwang, W.K. Le, “The adsorption and desorption breakthrough behavior of carbon monoxide and carbon dioxide on activated carbon effect of total pressure and pressure-dependent mass transfer coefficients.” J. Sep. Sci. Technol., 1994; 29: 1857–1891.
[17] Y. Takamura, S. Narita, J.Aoki, S. Hironaka, S. Uchida, “Evaluation of dual-bed pressure swing adsorption for CO2 recovery from boiler exhaust gas.” J. Sep. Purif. Technol., 2001; 24: 519–528.
[18] D. Diagne, M. Goto, T. Hirose, “Numerical analysis of a dual refluxed PSA process during simultaneous removal and concentration of carbon dioxide dilute gas from air.” J. Chem. Technol. Biotechnol., 1996; 65: 29–38.
[19] R. F. P. M. Moreira, J. L. Soares, G. L. Casarin, A.E. Rodrigues, “Adsorption of CO2 on hydrotalcite - like compounds in a fixed bed.” J. Sep. Sci. Technol., 2006; 41: 341–357.
[20] M. B. Gorbunov, A. M. Arkharov, N. A. Gorbunova, V. V. Serpinskii, I. Kalinnikova, “Adsorption of N2-O2 mixtures at
elevated pressures.” Institute of Physical Chemistry, Academy of Sciences of the USSR, Moscow, 1986; No. 5: 984-988.
[21] Ergun, “Fluid Flow through Packed Columns, “J. of Chemical Engineering Progress, 1952; Vol. 48, No. 2: 89-94. [22] M. Suzuki, and J.M. Smith “Axial dispersion in beds of small