Casual Relationship and Volatility of BSE Index with special reference to
Indian stock market
1Dr.S.Baranidharan, Ph.D., 2Ms.N.Dhivya 1Assisstant Professor, 2Final Year Student
1 Department of Business Administration, 2Department of Management Studies, 1 ST.Joseph College of Arts and Science (Autonomous), Cuddalore - 607001, India.
2IFET College of Engineering, Villupuram- 605108, India.
E-mail: 1 [email protected]. 2 [email protected].
1. INTRODUCTION:
India has emerged as the fastest growing major economy in the world and is expected to be one of the top three economic powers of the world over the next 10-15 years, backed by its strong democracy and partnerships. India is today one of the most vibrant global economies, one of the most prominent has been take place by the Indian Stock market. The recent global economic situation has witnessed immense highs and lows including some unfortunate happenings related to stock market. Indian Stock market is a physically existing institutionalized set up where instruments of security market such as shares, bonds, debentures, securities, etc. were traded. The major functions of Indian stock market are providing liquidity and marketability to existing securities. It helps to provide the value for securities and safety transactions and fair dealing in buying and selling of securities. The Exchange while providing an efficient market also upholds the interest of investors and ensures Redressal of their grievances whether against the companies or its own member – brokers. There are 23 Stock Exchange in India as per the Security Exchange Board of India (SEBI). Among them Bombay stock exchange is the biggest stock exchange in India accounts for almost 75% of total stocks in India and there are four indices connected with the BSE such as Sensex, BSE-200, BSE-500, and National Index. The Indian stock market plays a prominent role in the growth of the Indian economy. The present study on
“Casual Relationship and Volatility of BSE Index with special reference to Indian stock market” selected five indexes
such as BSE AUTOEX, BSE BANKEX, BSE CORBANEX, BSE GREENEX and BSE SENSEX to certain the relationship between the indices and impact of one indices with the other indices.
2. REVIEW OF LITERATURE:
This works “Casual Relationship and Volatility of BSE Index with special reference to Indian stock market”
reveals about the two broad categories. The first one reveals that impact of movement of prices that prevail in the BSE Stock Indices and the second one discuss about the relationship between the stock market volatility and volatility with special reference to Indian stock market.
Memchal. L. Jibon Kumar Sharma (2006) revealed that there is no significant relationship between price change and volume in two days of bull market and bear market where as there is a significant relationship between the two variables in 20 days through investigating the relationship between price change and volume in the Indian Stock Market in the
Abstract: As per the Central Statistics Organization and International Monetary Fund, India has emerged as the fastest growing major economy in the world and by its strong democracy and partnerships the Indian economy is expected to be one of the top three economic powers of the world over the next 10 – 15 years. Trade liberalization, financial liberalization, tax reforms and opening up to foreign investments were some of the important steps which also include share market, which helped the economy to gain momentum. The essential part of an Indian economy is the movement of shares in Stock exchange. Stock Exchange offers a ready market for buying and selling the securities. Share Bazaar is the business market with crores of rupees being put to stake. The Bombay Stock Exchange, the premier share market, registers dealings worth several hundred crore a day. The purpose of this study is to analyze the Casual Relationship and Volatility of BSE Index with special reference to Indian stock market through the data collected from the period of April 2010 to March 2018. Using SPSS software, the Descriptive statistics and Correlation developed which shows the relationship between share price & various factors affecting the same and also its casual relationship are very helpful for policy makers, Institutional investors, traders and all other stakeholders to take investment decision.
Key Words: Economic, Investment, Inflation, Price, Institutional Investor, Investment Decision, Policy.
linked to the unusual interest by somebody in that security has attributed that there is a high volume is accompanied by price increases in bull market. It also reveals that unsatisfied demand in the market reflected an increasing price accompanied by increasing volume with signal a buy situation. It also found that when the market is bullish the liquidity of the market is more and low when it is bearish.
All Asghar Anvary Rastamy (2008) examined that there is a positive relationship between the stock market efficiency level and level of economic development and also concluded that there is a positive relationship between the stock market efficiency level and its attractiveness to foreign investors through evaluating the relationship among the economic development, stock market efficiency level, market attraction to foreign investors and the nature of information.
Brajesh Kumar and Priyanka Singh (2009) found that there is a positive contemporaneous correlation between absolute price changes and trading volume in Indian Stock markets through analysing the returns and volume relationships, focusing on the contemporaneous relationship between absolute returns and trading volume by using 50 Indian Stocks.
Satish Mittal, Sonal Jain (2009) explored whether seasonal deviation exist in Indian Stock Market or not for three indices BSE – 200, CNX – 500, CNX – 100 by using the data has been collected from January 2007 to December 2008 which resulted that the market can be considered as informationally efficient and the deviation do not exist in the Indian Stock market and also showed that there turns on Monday are negative whereas positive means returns on Friday but there is insignificant difference between the returns on Monday and other weekdays and it was concluded by using T-test.
Gupta (2011) examined by using the comparative study of Indian Stock Markets with other Asian Markets whether Indian stock market returns were correlated to the stock returns of other selected Asian Economies or not and compared the distribution of the stock market returns of India with other selected Asian economies such as BSE (India), Heng Seng (Hong Song), JKS (Indonesia), KLSE (Malaysia), Nikkie (Japan), KS11 (Korea) and concluded that the mean weekly returns of India and the Indonesian markets were observed to be the highest around 23%.There is maximum variance in Indian Market. A low peak with a fat mid range on either side was indicated by the weekly returns of Indian Stock markets. The normal distribution of stock returns in Indian stock market is signified that the kurtosis of India is Playkurtic.
Nidal Rashid Sabri (2012) explored the causes and interpretations of stock market crises and high price volatility found that the causes and interpretations of stock market crises reside in various models including overreaction model, the adverse impact of related laws, increasing linkage model, transmission of volatility model, etc.
Vashishtha et al (2013) by reviewing the impact of economic growth rates on capital movement and explored that IIP growth moderately related with S&P BSE Index whereas WPI was highly correlated with S&P BSE Sensex.
Luthra and Mahajan (2014) examined the study on the impact of macroeconomic factors on BSE Bankex and revealed there will be a positive impact of Exchange rate, Inflation, GDP growth rate on Banking Index whereas Gold Prices has negative impact on BSE Banking Index but none of them have significant impact on Bankex.
Subramanian (2015) by using the quarterly data from December 2005 to June 2012 examined that the stock market index are strongly influenced by the macroeconomic variables.
Ahmad and Sinha (2016) by examining the relationship between BSE Sensex, GDP and Exchange rate and resulted that there will be an positive correlation between the Independent variables (GDP and Exchange rate) with dependent variable. But GDP is a significant predictor of BSE while taking individually whereas Exchange rate has not significant predictor of BSE.
3. STATEMENT OF HYPOTHESIS: Null Hypothesis:
H0: There is no casual relationship and degree of variation of a trading price series among the Bombay Stock Exchange Indices such as BSE AUTOEX, BSE BANKEX, BSE CORBANEX, BSE GREENEX and BSE SENSEX
Ha: There is casual relationship and degree of variation of a trading price series among the Bombay Stock Exchange Indices such as BSE AUTOEX, BSE BANKEX, BSE CORBANEX, BSE GREENEX and BSE SENSEX
4. METHODOLOGY:
4.1 Statement of the problem:
speculative motive among the other market participants. The investors felt suspicious to invest in BSE Indexes due to lack of transparency in transaction.
The present study is to remove the myths and misconception of volatility of BSE Indexes regarding to the Indian stock market and the Casual relationship between the indexes which helps to understand the market for the common man for timely investment decision making.
4.2 Objectives:
1. To analyze the impact of BSE Indexes with special references to Indian Stock market for investment decision making.
2. To ascertain the smooth functioning and volatility of BSE Indexes.
3. To analyze the movements of the Indian Stock Market with special reference to BSE in comparison to the indices.
4. To examine the long term and causal relation between BSE Indexes with special references to Indian Stock market.
4.3Scope of study:
The study reveals the linkage between the Indian stock market and Bombay Stock Exchange indexes such as BSE AUTOEX, BSE BANKEX, BSE CORBANEX, BSE GREENEX and BSE SENSEX using SPSS during the period of April 2010 to March 2018. The study portrays about that casual relationship between the BSE Index and how the volatility of Indian stock market influences the investors to make a better investment strategy for long term investment.
4.4 Importance of study:
The Indian stock market is indispensable for the proper functioning of corporate enterprises it brings together large amounts of capital necessary for the economic progress of a country.
Bombay stock exchange plays a major role in the collecting money and encouraging investments. The main purposes of stock exchange transactions are either for the purpose of investment or for speculation. Investment transaction are made with the intention of earning a return on the securities by holding them more or less permanently whereas speculative transactions are made with the intentions of making gains by disposing of the securities at favourable prices.
This study will helps to analyze the efficient market condition and upholds the interest of investors and also strives to educate and enlighten the investors by making available necessary informative inputs.
4.5 Sources and Collection of the Data:
The study will be using mainly secondary data. Information is obtained from www.rbi.org, www.bseindia.com and other sources.
4.6 Sample selection:
The sample selection of the study will include the five Bombay Stock Exchange Indexes such 1. BSE AUTOEX,
2. BSE BANKEX, 3. BSE CORBANEX, 4. BSE GREENEX and 5. BSE SENSEX
4.7 Study period: The study of the influence of macroeconomic variable on BSE attempted during the period of April 2010 – March 2018.
4.8 Tools used for analysis:
To test the influences of macroeconomic variable; 1. Descriptive statistics,
2. Unrestricted Co integration Rank Test 3. Granger Causality Tests
4. Correlation, 5. Regression.
Descriptive statistics:
study descriptive statistics is used to analyze the summary of macroeconomic variables and BSE Sensex. We used measures of central tendency (mean) and measures of variability (standard deviation, range, maximum and minimum) to explain the data set.
Johansen Co integration Rank Test:
Johansen test is a procedure for testing co integration of time series. There are two types of Johansen test, either with trace or with eigenvalues, and the inferences might be a little bit different. The null hypothesis for the trace test is that the number of co integration vectors is r=r*<k, vs. the alternative that r=k. Testing proceeds sequentially for r*=1, 2, etc. and the first non-rejection of the null is taken as an estimate of r. The null hypothesis for the "maximum eigenvalues" test is as for the trace test but the alternative is r=r*+1 and, again, testing proceeds sequentially for r*=1, 2, etc., with the first non-rejection used as an estimator for r.
Granger Causality Tests:
Granger causality is a way to investigate causality between two variables in a time series. The method is a probabilistic account of causality; it uses empirical data sets to find patterns of correlation.
The basic steps for running the test are:
1. State the null hypothesis and alternate hypothesis. For example, y (t) does not Granger-cause x (t). 2. Choose the lags. This mostly depends on how much data you have available. One way to choose lags i
and j is to run a model order test (i.e. use a model order selection method). It might be easier just to pick several values and run the Granger test several times to see if the results are the same for different lag levels. The results should not be sensitive to lags.
3. Find the f-value. Two equations can be used to find if βj = 0 for all lags j:
Correlation:
Correlation analysis is attempts to determine the degree of relationship between variables and testing whether it is significant and establish the cause and effect relationship. When two or more variables have a strong relationship with each other then there is a strong or high correlation, while a weak or low correlation means that the variables are hardly related. Correlation coefficient can range from -1.00 to +1.00. The +1.00 denotes that there will be a perfect positive relationship between the variables and the -1.00 denotes that there will be a perfect negative relationship between the variables. A Zero value denotes that there is no relationship between the variables.
Regression:
The regression analysis is a statistical device with the help of which we are in a position to estimate the unknown values of one variable from known values of another variable. The variable which is used to predict the variable of interest is called the independent variable or explanatory variable and the variable we are trying to predict is called the dependent variable or explained variable.
Here, in our study we carried out this analysis to explore the effect of the macroeconomic variables on Bombay stock exchange Sensex. Here, the dependent variable is BSE Sensex and the independent variables are BSE AUTOEX, BSE BANKEX, BSE CORBANEX, BSE GREENEX and BSE SENSEX
Y= a+bX a= Σy-bΣx b = NΣxy – (Σx) (Σy)
N NΣx2 – (Σx) 2
1. N = number of observations or years 2. x = a year index (decade)
3. y = population size for given census year
Table 1: Analysis of descriptive statistics for BSE and major stock indices
Source: The data of the analysis computed in SPSS 20
Interpretation:
Table 1 indicates that the Descriptive statistics has been analyzed the materialistic properties of data mean, standard deviation, skewness, kurtosis, Jarque – Bera and Probability of each independent and dependent variables.
From the table it is noted that BSE- BANKEX present a high inequality with a minimum of -0.1400 and a maximum of 0.2444 and it has the highest mean value of 0.0111. Concerning with the other major indices BSE BANKEX has the
highest standard deviation of 0.0731. The normality of the data has been determined through the values of skewness and
kurtosis. Skewness is the measure of asymmetry of the distribution of a real valued random variable. Skewness of a systematic distribution, such as the normal distribution is Zero (0). Kurtosis is a measure of the probability distribution of a real valued random variable. The kurtosis of a normal distribution is 3. The table which was given above has no variable equal to 0 and kurtosis equal to 3 which signifies that the data is not normal. Jarque Bera test is a goodness of fit test to examine whether the sample data have the skewness and Kurtosis matching with the normal distribution. In this table, the probability of Jarque Bera values is BSE AUTOEX (0.8865), BSE BANKEX (5.2008) BSE CORBANEX (0.1697), BSE GREENEX (0.5145) and BSE SENSEX (0.1869) which indicates that the distributions are not normal.
4.9.2 Johansen Co integration Rank Test:
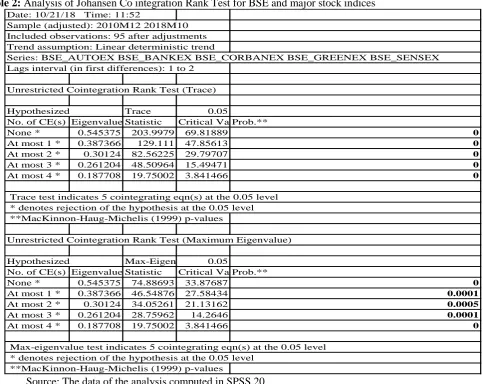
Table 2: Analysis of Johansen Co integration Rank Test for BSE and major stock indices
BSE_AUTOEX BSE_BANKEX BSE_CORBANEX BSE_GREENEX BSE_SENSEX
Mean 0.0100 0.0111 0.0066 0.0079 0.0076
Median 0.0139 0.0075 0.0026 0.0071 0.0045
Maximum 0.1356 0.2444 0.1315 0.1518 0.1167
Minimum -0.1665 -0.1400 -0.1036 -0.1106 -0.1064
Std. Dev. 0.0610 0.0731 0.0460 0.0481 0.0455
Skewness -0.2329 0.4560 0.0931 0.1626 0.0574
Kurtosis 3.0119 3.6649 2.9172 2.8577 2.8195
Jarque-Bera 0.8865 5.2008 0.1697 0.5145 0.1869
Probability 0.6420 0.0742 0.9187 0.7732 0.9108
Date: 10/21/18 Time: 11:52
Sample (adjusted): 2010M12 2018M10 Included observations: 95 after adjustments Trend assumption: Linear deterministic trend
Series: BSE_AUTOEX BSE_BANKEX BSE_CORBANEX BSE_GREENEX BSE_SENSEX Lags interval (in first differences): 1 to 2
Unrestricted Cointegration Rank Test (Trace)
Hypothesized Trace 0.05
No. of CE(s) Eigenvalue Statistic Critical ValueProb.**
None * 0.545375 203.9979 69.81889 0
At most 1 * 0.387366 129.111 47.85613 0
At most 2 * 0.30124 82.56225 29.79707 0
At most 3 * 0.261204 48.50964 15.49471 0
At most 4 * 0.187708 19.75002 3.841466 0
Trace test indicates 5 cointegrating eqn(s) at the 0.05 level * denotes rejection of the hypothesis at the 0.05 level **MacKinnon-Haug-Michelis (1999) p-values
Unrestricted Cointegration Rank Test (Maximum Eigenvalue)
Hypothesized Max-Eigen 0.05
No. of CE(s) Eigenvalue Statistic Critical ValueProb.**
None * 0.545375 74.88693 33.87687 0
At most 1 * 0.387366 46.54876 27.58434 0.0001
At most 2 * 0.30124 34.05261 21.13162 0.0005
At most 3 * 0.261204 28.75962 14.2646 0.0001
At most 4 * 0.187708 19.75002 3.841466 0
Max-eigenvalue test indicates 5 cointegrating eqn(s) at the 0.05 level * denotes rejection of the hypothesis at the 0.05 level
Interpretation:
The unrestricted Johnson Co-integration test are report the results in Table 2. It consists of two basically types of test statistics. The first block reports are called trace statistics (λ trace) and the second block reports the maximum Eigen value (λ max). Both the trace statistic and maximum Eigen value statistics indicating that trace statistics are BSE AUTOEX (203.9979), BSE BANKEX (129.111), BSE CORBANEX (82.56225), BSE GREENEX (48.50964)and BSE SENSEX (19.75002) and the maximum Eigen value are BSE AUTOEX (74.88693), BSE BANKEX (46.54876), BSE CORBANEX (34.05261), BSE GREENEX (28.75962) and BSE SENSEX (19.75002) co integrated at the 0.05 level. Hence it concluded that there will be a long run relationship between BSE AUTOEX, BSE BANKEX, BSE CORBANEX, BSE GREENEX and BSE SENSEX and also the price movement of the BSE Indices causes the Indian Stock Market Returns.
4.9.3 Granger Causality Tests:
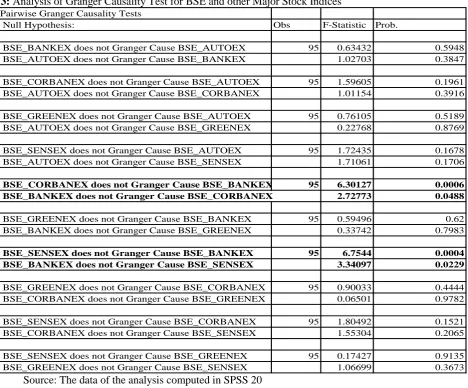
Table 3: Analysis ofGranger Causality Testfor BSE and other Major Stock Indices
Source: The data of the analysis computed in SPSS 20
Interpretation:
Granger Causality Test is used to investigate the casual relationship between two variables in a time series. There are three set of relationship among the variables which includes unidirectional, bidirectional and no directional. Table 3 shows that there will be an bidirectional relationship exit among the BSE_BANKEX and BSE_AUTOEX (0.63432), BSE_AUTOEX and BSE_BANKEX (1.02703), BSE_CORBANEX and BSE_AUTOEX (1.59605), BSE_AUTOEX and BSE_CORBANEX (1.01154), BSE_GREENEX and BSE_AUTOEX (0.76105), BSE_AUTOEX and BSE_GREENEX (0.22768), BSE_SENSEX and BSE_AUTOEX (1.72435), BSE_AUTOEX and Cause BSE_SENSEX (1.71061), BSE_CORBANEX and BSE_BANKEX (6.30127) ,BSE_BANKEX and BSE_CORBANEX (2.72773), BSE_GREENEX and BSE_BANKEX (0.59496), BSE_BANKEX and BSE_GREENEX (0.33742), BSE_SENSEX and BSE_BANKEX (6.7544), BSE_BANKEX and BSE_SENSEX (3.34097), BSE_GREENEX and BSE_CORBANEX (0.90033), BSE_CORBANEX and BSE_GREENEX (0.06501), BSE_SENSEX and BSE_CORBANEX (1.80492), BSE_CORBANEX and BSE_SENSEX (1.55304), BSE_SENSEX and BSE_GREENEX (0.17427) and BSE_GREENEX and BSE_SENSEX (1.06699). The null hypothesis of no casual relationship exit between the BSE AUTOEX, BSE BANKEX, BSE CORBANEX, BSE GREENEX and BSE SENSEX and also interpret that the indices do not share any casual relationship in Indian Stock Market.
Pairwise Granger Causality Tests
Null Hypothesis: Obs F-Statistic Prob.
BSE_BANKEX does not Granger Cause BSE_AUTOEX 95 0.63432 0.5948
BSE_AUTOEX does not Granger Cause BSE_BANKEX 1.02703 0.3847
BSE_CORBANEX does not Granger Cause BSE_AUTOEX 95 1.59605 0.1961
BSE_AUTOEX does not Granger Cause BSE_CORBANEX 1.01154 0.3916
BSE_GREENEX does not Granger Cause BSE_AUTOEX 95 0.76105 0.5189
BSE_AUTOEX does not Granger Cause BSE_GREENEX 0.22768 0.8769
BSE_SENSEX does not Granger Cause BSE_AUTOEX 95 1.72435 0.1678
BSE_AUTOEX does not Granger Cause BSE_SENSEX 1.71061 0.1706
BSE_CORBANEX does not Granger Cause BSE_BANKEX 95 6.30127 0.0006
BSE_BANKEX does not Granger Cause BSE_CORBANEX 2.72773 0.0488
BSE_GREENEX does not Granger Cause BSE_BANKEX 95 0.59496 0.62
BSE_BANKEX does not Granger Cause BSE_GREENEX 0.33742 0.7983
BSE_SENSEX does not Granger Cause BSE_BANKEX 95 6.7544 0.0004
BSE_BANKEX does not Granger Cause BSE_SENSEX 3.34097 0.0229
BSE_GREENEX does not Granger Cause BSE_CORBANEX 95 0.90033 0.4444
BSE_CORBANEX does not Granger Cause BSE_GREENEX 0.06501 0.9782
BSE_SENSEX does not Granger Cause BSE_CORBANEX 95 1.80492 0.1521
BSE_CORBANEX does not Granger Cause BSE_SENSEX 1.55304 0.2065
BSE_SENSEX does not Granger Cause BSE_GREENEX 95 0.17427 0.9135
4.9.4 Correlation:
Table 4: Analysis of Correlation for BSE and other Major Stock Indices
Source: The data of the analysis computed in SPSS 20
Interpretation:
Table 4 indicates that the correlation between the Bombay Stock Exchange Indices. There is highly significant positive relationship between the BSE CORBANEX with BSE AUTOEX is 0.85353608 and BSE CORBANEX with BSE BANKEX (0.895426298). BSE GREENEX is positively correlated with BSE CORBANEX (0.000633884). There is highly positive relationship the BSE SENSEX with BSE AUTOEX (0.837381363), BSE BANKEX (0.886081298), BSE CORBANEX (0.954867458) and BSE GREENEX (0.036602253). The positive relationship indicates that there will be a direct proportion between the BSE CORBANKEX with BSE AUTOEX, BSE BANKEX and BSE GREENEX with BSE CORBANEX and BSE SENSEX with BSE AUTOEX, BSE BANKEX, BSE CORBANEX and BSE SENSEX. Hence it portrays that there will be an Strong relationship BSE SENSEX, BSE AUTOEX, BSE BANKEX, BSE CORBANEX and BSE GREENEX.
4.9.5 Regression:
Table 5: Analysis of impact of BSE with other major Indices.
Source: The data of the analysis computed in SPSS 20
Interpretation:
This table provides the R and R2 values. The R value represents the simple correlation between the dependent variable BSE SENSEX and the predictors such as BSE AUTOEX, BSE BANKEX, BSE CORBANEX and BSE GREENEX is 0.918465 (the "R" Column), which indicates a high degree of correlation. The R2 value (the "R Square" column) indicates how much of the total variation in the dependent variable, can be explained by the independent variable. The total variation between the BSE Sensex and the other variable is 0.914958.
Durbin – Watson test is a test statistics which is used to test the autocorrelation in residuals from regression analysis. The Durbin Watson test reports a test statistic, with a value from 0 to 4, where:
a. 2 are no autocorrelation.
b. 0 to <2 is positive autocorrelation (common in time series data). c. >2 to 4 is negative autocorrelation (less common in time series data).
In this study the value of Durbin Watson test is 1.51075 which portrays that positive auto correlation between the BSE Sensex and predictor variable.
F and Sig. – This is the F-statistic the p-value associated with it. The F-statistic is the Mean Square (Regression) divided by the Mean Square (Residual): .261.9047. In this study the value of F statistic is 261.9047 which are significant at the 0.000; through this we conclude that there will be impact of Bombay Stock Exchange Sensex with the other
BSE_AUTOEX BSE_BANKEX BSE_CORBANEX BSE_GREENEX BSE_SENSEX
BSE_AUTOEX 1
BSE_BANKEX 0.779333528 1
BSE_CORBANEX 0.85353608 0.895426298 1
BSE_GREENEX 0.057055102 0.091697157 0.000633884 1
BSE_SENSEX 0.837381363 0.886081298 0.954867458 0.036602253 1
Dependent Variable: BSE_SENSEX Method: Least Squares
Variable Coefficient Std. Error t-Statistic Prob.
C 0.000974 0.001375 0.70841 0.4805
BSE_AUTOEX 0.052592 0.042672 1.23249 0.2209
BSE_BANKEX 0.088829 0.042353 2.09736 0.0387
BSE_CORBANEX 0.759282 0.081091 9.3633 0
BSE_GREENEX 0.017993 0.028764 0.62552 0.5332
R-squared 0.918465 Mean dependent var 0.00764
Adjusted R-squared 0.914958 S.D. dependent var 0.04549
S.E. of regression 0.013266 Akaike info criterion -5.75751
Sum squared resid 0.016367 Schwarz criterion -5.62563
Log likelihood 287.1182 Hannan-Quinn criter. -5.70417
F-statistic 261.9047 Durbin-Watson stat 1.51075
5. FINDINGS:
Based on the analysis, the following results are observed through the study are:
a. Descriptive statistics showed that distributions are not normal and the Jarque Bera test indicates that the obtained data are not normally distributed.
b. The Unrestricted Johnson Co-integration test portrayed that the there will be a long run relationship between the BSE Indices and also the price movement that affect the Indian Stock market.
c. Granger Causality Test denoted that the bidirectional relationship exist among the BSE SENSEX, BSE AUTOEX, BSE BANKEX, BSE CORBANEX and BSE GREENEX.
d. Correlation indicates that the positive and strong relationship between all the Indices such as BSE SENSEX, BSE AUTOEX, BSE BANKEX, BSE CORBANEX and BSE GREENEX.
e. Durbin Watson Test in Regression showed that the positive auto correlation between the BSE SENSEX and the Predictor variable.
6. CONCLUSION:
The Paper “Casual Relationship and Volatility of BSE Index with special reference to Indian stock market”
explored that the integration and price movement of BSE Indices has been examined through the tools such as Johansen Co-integration and Granger Causality test for the period 2010-2018. It shows that the Unrestricted Co-integration test expressed that long run relationship and price movement in various indices of BSE affects the Indian Stock Market. The study reveals that there would be a bidirectional relationship exists among the BSE SENSEX, BSE AUTOEX, BSE BANKEX, BSE CORBANEX and BSE GREENEX. Thus the study will helpful for the Institutional investors and traders to take investment decision and also volatility with reference to Indian Stock Market helps to fix the price for securities and invest in stocks and also helps regulatory authority and policy makers to frame policies.
REFERENCES:
1. Agrawal, G., Srivastav, A.K. and Srivastava, A. (2010): A study of exchange rates movement and stock market volatility. International Journal of Business and Management 5 (12).
2. Aggarwal, R. (2013): Exchange rates and stock prices: a study of the US capital markets under floating exchange rates. Akron Business and Economic Review 12:7–12.
3. Ahmed S (2008): Aggregate Economic Variables and Stock Market in India. International research Journal of Finance and Economics 14: 141-165.
4. Banerjee, A., & Sarkar, S. (2006): Modeling daily volatility of the Indian index market using intra-day data. IIMK WPS, 588.
5. Balaban, E., & Bayar, A. (2005): Stock returns and volatility: empirical evidence from fourteen countries. Applied Economics Letters, 12(10), 603-611.
6. Baranidharan, S., The Dynamic Long-run and Short-run Linkages between Exchange rates and BSE Sensex Return. IPE Journal of Management. Jul-Dec2016, Vol. 6 Issue 2, p92-105. 14p.
7. Baranidharan, S.; Vanitha, S., The Effect of Macroeconomic and financial related variables on stock market capitalization of global growth generator countries. Journal of Contemporary Management Research, Mar2016, Vol. 10 Issue 1, p1-27. 27p.
8. Baranidharan, S.; Vanitha, S. The Impact of Macroeconomic Variables on Indian Stock Market using Factor
Analysis Approach”. IPE Journal of Management. Jul-Dec2015, Vol. 5 Issue 2, p38-56. 19p.
9. Chen, N., Roll, R & Ross, S. A. (1986): Economic forces and the stock market. The Journal of Business, 59(3), 383-403.
10. Gabriela-Victoria Anghelache and Andreea Negru Ciobanu, (2012): “Correlating Stock Exchange Indices under
both Normal and Financial Crisis Conditions”, Theoretical and Applied Economics, Vol. 19, No. 11, pp. 75-84, 11. Kumar A (2011): an Empirical Analysis of Causal Relationship between Stock Market and Macroeconomic
Variables in India. International Journal of Computer Science and Management Studies 11: 8-14.
12. Mahajan, S., & Singh, B. (2009): The empirical investigation of relationship between return, volume and volatility dynamics in Indian stock market. Eurasian Journal of Business and Economics, 2 (4), 113-137. 13. M.V. Subha and T. Nambi, (2010): “A Study on Cointegration between Indian and American Stock Markets”,
Journal of Contemporary Research in Management, pp. 105-113.
14. Nupur Gupta and Vijay Agarwal, 2011): “Comparative Study of Distribution of Indian Stock Markets with other
Asian Stock Markets”, International Journal of Enterprise Computing and Business Systems, Vol. 1, No. 2, pp. 1-20.
16. Sanjay Sehgal and Asheesh Pandey (2012): “Strategic Allocation, Asset Pricing and Prior Return Patterns:
Evidence from Indian Commodity Market”, Vision 16(4) 273–28, SAGE Publication.
17. Vanita Tripathi and Shruti Sethi, “Integration of Indian Stock Market with Major Global Stock Markets”, Asian Journal of Business and Accounting, Vol. 3, No. 1, pp. 117- 134, 2010.
18. Walia S (2012): Impact of Global Economic Crisis on Indian Economy: An Analysis. International Journal of Latest Trends in Engineering and Technology 1: 31-36.
19. S.Baranidharan, PhD. K.Dhanavathi, and C.Sukumar; galaxy international interdisciplinary research journal vol.6 (5), May (2018) pp.6-22 “Influence of Macroeconomic variables on Exchange rate volatility by using Structural Equation Model.
20. Yao.Zheng (2014): “The linkage between aggregate stock market investor sentiment and commodity futures