Organized by C.O.E.T, Akola & IWWA, Amravati Center. Available Online at www.ijpret.com266
INTERNATIONAL JOURNAL OF PURE AND
APPLIED RESEARCH IN ENGINEERING AND
TECHNOLOGY
A PATH FOR HORIZING YOUR INNOVATIVE WORK
SPECIAL ISSUE FOR
NATIONAL LEVEL CONFERENCE
"SUSTAINABLE TECHNOLOGIES IN
CIVIL ENGINEERING"
EVALUATION OF ELECTROCOAGULATION PROCESS FOR REMOVAL OF FLUORIDE
FROM WATER
MS. V. M. BHEDI1, MR. L. N. VAIRAGADE2
1. Asst. Professor, Dept. of Civil Engineering, GHRAET, Nagpur.
2. Asst. Professor, Dept. of Civil Engineering, GHRAET, Nagpur.
Accepted Date: 13/03/2015; Published Date: 01/04/2015
Abstract –Air, water and food are the three basic needs for the survival of human beings.Water intended for human consumption should be not only “Safe” but also wholesome water. Though surface water sources have fulfilled the water needs for a long time groundwater has become a source of drinking water since last few decades, but it has led to the emergence of chronic health effects in certa in pa rts of the coun try d ue to the p res en ce of excess fluoride, arsen ic an d nitra te contents in grou ndwa ter.
WHO standards and BIS: 105000, 1991 permit only 1 mg/l as the upper permissible limit for fluoride in drinking water for the Indian context. If it exceeds a certain limit it can act as an accumulative toxin causing den tal fluoros is, skeletal damage. Since majority of fluoride intake for human beings is through water, defluoridation of drinking water is one of the important remedial measures to solve high fluoride problem in drinking water. Hence in this study the Electro-coagulation method is used for the deflouridation and Observations were recorded with different Initial concentration as 2mg/l, 5mg/l & 10mg/l of fluorides at different voltages say 6 Volts & 12 Volts for different range of pH from 5 to 9. The maximum efficiency of fluoride removal for various initial concentration of fluoride was obtained in constant voltage of 12 V and time required for removal is least at pH = 7 & 8. Finally, the results demonstrated the technical feasibility of Electro-coagulation as a reliable technique for removal of fluoride from water.
Keywords-Electrocoagulation, Defluoridation.
Corresponding Author: MS. V. M. BHEDI
Co Author: MR. L. N. VAIRAGADE
Access Online On:
www.ijpret.com
How to Cite This Article:
V. M. Bhedi, IJPRET, 2015; Volume 3 (8): 266-280
Organized by C.O.E.T, Akola & IWWA, Amravati Center. Available Online at www.ijpret.com267
INTRODUCTION
Air, water and food are the three basic needs for the survival of human beings. Water intended for human consumption should be not only “Safe” but also wholesome water. Though surface water sources have fulfilled the water needs for a long time groundwater has become a source of drinking water since last few decades, due to the scarcity, non availability and bacteriological pollution of surface waters in many developing and underdeveloped countries. Millions of hand pumps and deep tube wells have been installed in India since 1970, to provide safe drinking water to rural population, as groundwater is generally free of bacteriological contamination. Although this drastically reduced the incidence of water borne diseases, it has led to the emergence of chronic health effects in certain parts of the country due to the presence of excess fluoride, arsenic and nitrate contents in groundwater. Among various ions present “Fluoride” has physiological properties of the great interest and importance for human health and well beings. WHO standards and BIS: 105000, 1991 permit only 1 mg/l as the upper permissible limit for fluoride in drinking water for the Indian context. If its content is less than optimum it may result in problems like dental caries. If it exceeds a certain limit it can act as an accumulative toxin causing dental fluorosis, skeletal damage. Since majority of fluoride intake for human beings is through water, defluoridation of drinking water is one of the important remedial measures to solve high fluoride problem in drinking water. Defluoridation refers to methods of water treatment that reduce the concentration of fluoride in the water, normally, in order to make it safe for human consumption.
2. Theory
Fluorine is the 13th most abundant naturally occurring element of Halogen group with
Organized by C.O.E.T, Akola & IWWA, Amravati Center. Available Online at www.ijpret.com268
Table. 1 Physical & Chemical characteristics of forms of Fluorides
Property Sodium fluoride (NaF) Hydrogen fluoride (HF) Physical state White, crystalline
powder
Colourless liquid or gas with biting smell Melting point
(°C)
993 -83
Boiling point (°C) 1695 at 100 kPa 19.5
Density (g/cm3) 2.56 -
Water solubility 42 g/litre at 10 °C Readily soluble below 20 °C
Acidity - Strong acid in liquid form; weak acid dissolved in water
World Health Organisation (WHO) recommends it in the range of 0.1– 1.5 ppm. The safe limit of fluoride in drinking water is 1.0 mg/L.(WHO (World Health Organization),1984)
2.1 SOURCES OF FLUORIDE
In India, fluorite and topaz are widespread and contain a high percentage of fluoride. When water percolates through rocks it leaches out the fluoride from these rocks. The rocks rich in fluoride are:
Flurospar- CaF (Sedimentary rocks, lime stones, sand stones);
Cryolite- Na32AlFPO (Igneous, Granite);
Fluorapatite- Ca3 (PO)26 Ca (FCl)2
Sources of fluoride for human exposure: (RGNDWM, 1993)
Main sources of fluoride for human are Water, Food, Air, Medicament, Cosmetic etc.
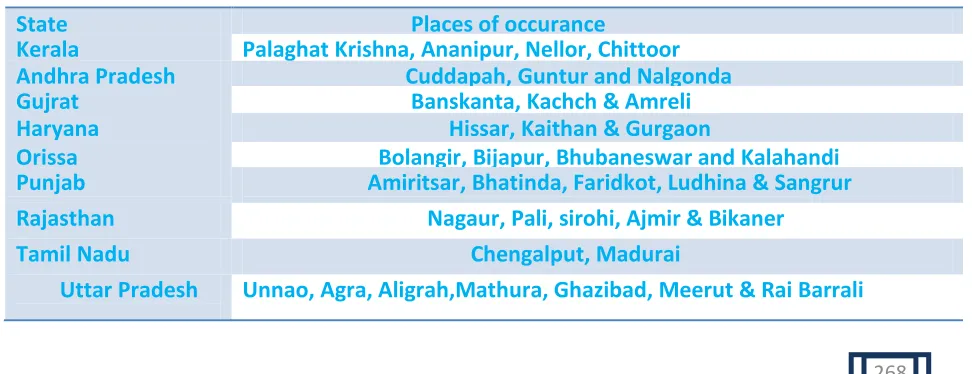
Status of fluoride in the ground water of India
Table.2 Ground water fluoride pollution in India
State Places of occurance
Kerala Palaghat Krishna, Ananipur, Nellor, Chittoor Andhra Pradesh Cuddapah, Guntur and Nalgonda Gujrat Banskanta, Kachch & Amreli Haryana Hissar, Kaithan & Gurgaon
Orissa Bolangir, Bijapur, Bhubaneswar and Kalahandi Punjab Amiritsar, Bhatinda, Faridkot, Ludhina & Sangrur Rajasthan Nagaur, Pali, sirohi, Ajmir & Bikaner
Tamil Nadu Chengalput, Madurai
Organized by C.O.E.T, Akola & IWWA, Amravati Center. Available Online at www.ijpret.com269
2.2 Effects of Fluoride
Table. 3 Fluoride concentration in drinking water & effects
mg/L Effects Below 1 Low Dental caries
1.0 safe
1..0 - 1.5 marginal
1.5-3.0 High risk of dental fluorosis
3.0-10.0 Leads to skeletal fluorosis with adverse changes in bones More than 10.0 Crippling skeletal fluorosis
2.3 Methods of Removal
Defluoridation is defined as, the downward adjustment of level of fluoride in drinking water to the optimal level. Defluoridation techniques can be broadly classified in to four categories;
1. Adsorption technique
2. Ion-exchange technique
3. Precipitation technique
4. Other techniques, which include electro chemical defluoridation and Reverse Osmosis.
3. METHODOLOGY
3.1 Introduction
Electro-coagulation is a simple and efficient method to remove the flocculating agent generated by electro-oxidation of a sacrificial anode and generally made of aluminium. This technique combines three main interdependent processes, operating synergistically to remove pollutant electrochemistry, coagulation and hydrodynamics. An examination of the chemical reactions occurring in the electrocoagulation process shows that the main reactions occurring at the electrodes (aluminium electrodes) are:
Dissolution metal from anode
Organized by C.O.E.T, Akola & IWWA, Amravati Center. Available Online at www.ijpret.com270 Formation of hydroxyl & hydrogen gas at cathode
2H2O + 2e → H2 + OH-
HCO3- + OH- → CO3-- + H2O
The aluminium hydroxide flocs normally act as adsorbents and/or traps for metal ions. Therefore, they would eliminate them from the solution. The main purpose of this study was to evaluate the electrocoagulation process efficiency for fluoride removal from water with aluminum electrodes and determination of the effects of voltage, pH, initial concentration of fluoride and reaction time on the removal efficiency.
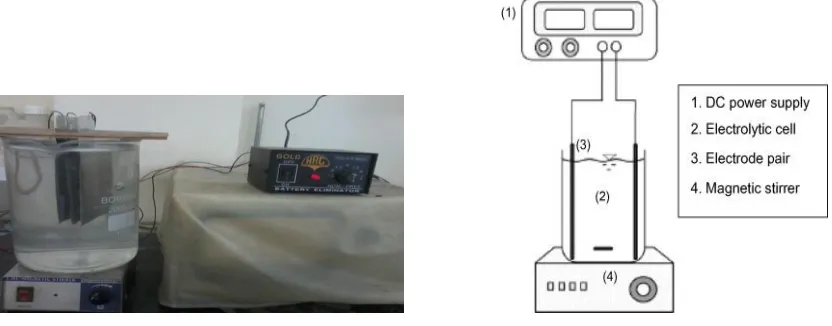
3.2 Experimental Setup
3.2.1 Estimation of fluoride using the SPADNS method by spectrophotometer to draw standard graph of Fluoride.
The SPADNS method of determination of fluoride in drinking water is a simple and a rapid technique with high accuracy. Reagent (10 mL) is taken in a 50 mL standard flask and 5 mL of the sample containing known amount of fluoride is added to the reagent. The final volume is then made up to 25 mL (Bellack and Schouboe 1958). After allowing the reaction to attain equilibrium, the mixture is transferred to the cuvette and the absorbance reading is recorded with the help of Spectrophotometer. Further a standard fluoride graph is drawn between Absorbance Vs. Fluoride concentration varied between 0.0 mg/L to 1.4 mg/L shown below. The graph represents the straight lines forming an equation Y= - 0.1955X + 0.3362.
Organized by C.O.E.T, Akola & IWWA, Amravati Center. Available Online at www.ijpret.com271
Figure 3. 2. Set up of Electro-coagulation system for fluoride removal.
3.3 Procedure
1. A standard fluoride graph is drawn between Absorbance Vs. Fluoride concentration varied between 0.0 mg/L to 1.4 mg/L shown below. The graph represents the straight lines forming an equation Y= - 0.1955X + 0.3362.
2. The Experiment setup was arranged for removal of fluoride using Electrocoagulation method (Figure.3.2).
3. Variable concentrations (2, 5 and 10 mg L-1) of fluoride solutions were prepared by mixing
proper amount of sodium fluoride with distilled water at varying pH (5,6,7,8 & 9) with variable output of 6V & 12V.
4. For an example initial fluoride concentration of 2mg/l at pH=6 and voltage = 6 V were the initial parameters.
5. 2 mg/l stock solution was mixed with distilled water and setup was started.
6. After every 15 minutes interval the different samples of 50ml were taken and analysed to determine the amount of fluoride present after the process and amount of percentage reduction, with the help of spectrophotometerand standard graph of Fluoride. (Figure 3.1)
Organized by C.O.E.T, Akola & IWWA, Amravati Center. Available Online at www.ijpret.com272
8. Thus the complete procedure was applied for all variable concentration (2, 5 and 10 mg L-1)
at variable pH (5,6,7,8 & 9) and output voltage of 6V & 12V consecutively.
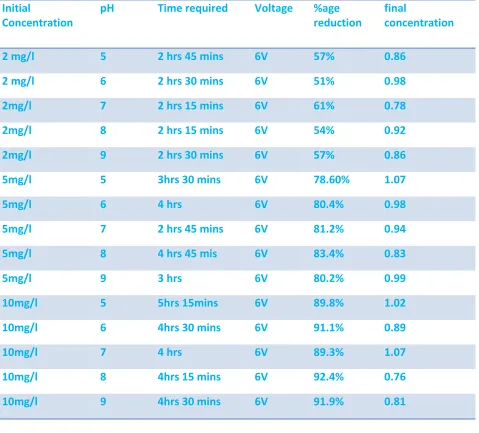
4. OBSERVATIONS & RESULTS
4.1 Observation
Observations were recorded with different Initial concentration as 2mg/l, 5mg/l & 10mg/l of fluorides at different voltages say 6 Volts & 12 Volts for different range of pH from 5 to 9. (Table No.5 & 6)
Table no.4
Initial
Concentration
pH Time required Voltage %age reduction
final
concentration
2 mg/l 5 2 hrs 45 mins 6V 57% 0.86
2 mg/l 6 2 hrs 30 mins 6V 51% 0.98
2mg/l 7 2 hrs 15 mins 6V 61% 0.78
2mg/l 8 2 hrs 15 mins 6V 54% 0.92
2mg/l 9 2 hrs 30 mins 6V 57% 0.86
5mg/l 5 3hrs 30 mins 6V 78.60% 1.07
5mg/l 6 4 hrs 6V 80.4% 0.98
5mg/l 7 2 hrs 45 mins 6V 81.2% 0.94
5mg/l 8 4 hrs 45 mis 6V 83.4% 0.83
5mg/l 9 3 hrs 6V 80.2% 0.99
10mg/l 5 5hrs 15mins 6V 89.8% 1.02
10mg/l 6 4hrs 30 mins 6V 91.1% 0.89
10mg/l 7 4 hrs 6V 89.3% 1.07
10mg/l 8 4hrs 15 mins 6V 92.4% 0.76
Organized by C.O.E.T, Akola & IWWA, Amravati Center. Available Online at www.ijpret.com273
Table no.5
Initial
Concentration
pH Time required Voltage %age reduction
final
concentration
2 mg/l 5 2 hrs 12 V 60% 0.8
2 mg/l 6 1 hr 45 mins 12 V 54% 0.92
2mg/l 7 1 hr 30 mins 12 V 60% 0.8
2mg/l 8 1 hr 30 mins 12 V 57.5% 0.85
2mg/l 9 2 hrs 12 V 58.0% 0.84
5mg/l 5 2 hrs 15 mins 12 V 84.2% 0.79
5mg/l 6 2 hrs 12 V 79.4% 1.03
5mg/l 7 2 hrs 15 mins 12 V 83.6% 0.82
5mg/l 8 2 hrs 15 mins 12 V 79.2% 1.04
5mg/l 9 3 hrs 12 V 80.0% 1
10mg/l 5 3 hrs 30 mins 12 V 94.0% 0.6
10mg/l 6 3 hrs 15 mins 12 V 93.8% 0.62
10mg/l 7 3 hrs 12 V 92.5% 0.75
10mg/l 8 2 hrs 45 mins 12 V 92.2% 0.78
10mg/l 9 3 hrs 12 V 93.2% 0.68
4.2 RESULTS AND DISCUSSIONS
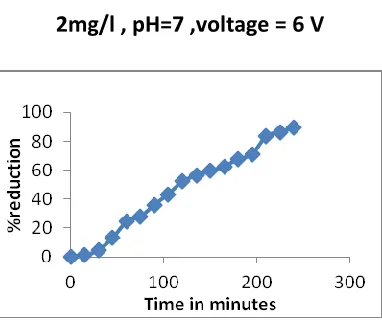
1. Percentage Reduction in concentration of Fluoride
Organized by C.O.E.T, Akola & IWWA, Amravati Center. Available Online at www.ijpret.com274
Fig. 4.1 Percentage Reduction at initial concentration. Fig. 4.2 Percentage Reduction at initial concentration
2mg/l , pH=7 ,voltage = 6 V 5mg/l , pH=7 ,voltage = 6 V
Fig. 4.3 Percentage Reduction at initial concentration Fig 4.4 Percentage Reduction at initial concentration
10mg/l , pH=7 ,voltage = 6 V 2mg/l , pH= 7 ,voltage = 12 V
Fig 4.5 Percentage Reduction at initial concentration Fig 4.6 Percentage Reduction at initialconcentration
Organized by C.O.E.T, Akola & IWWA, Amravati Center. Available Online at www.ijpret.com275
2. Effect of pH
The results of this research showed that fluoride removal efficiency in alkaline (pH=8) and neutral conditions (pH=7) is better than acidic. In this study, the pH was varied in the range 5 - 9 in an attempt to investigate the influence of this parameter on the removal of fluoride. Percentage reduction in fluoride concentration as a function of pH with aluminum electrodes are presented in figures 4.7 – 4.12.
Fig.4.7 Percentage Reduction at initial
concentration 2 mg/l ,voltage =6 V
Fig.4.8 Percentage Reduction at initial
concentration 2 mg/l,voltage = 12 V
Fig.4.9 Percentage Reduction at initial
concentration 5 mg/l ,voltage =6 V
Fig.4.10 Percentage Reduction at initial
Organized by C.O.E.T, Akola & IWWA, Amravati Center. Available Online at www.ijpret.com276 Fig.4.11 Percentage Reduction at initial
concentration 10mg/l ,voltage =6 V
Fig.4.12 Percentage Reduction at initial
concentration 10 mg/l, voltage = 12 V
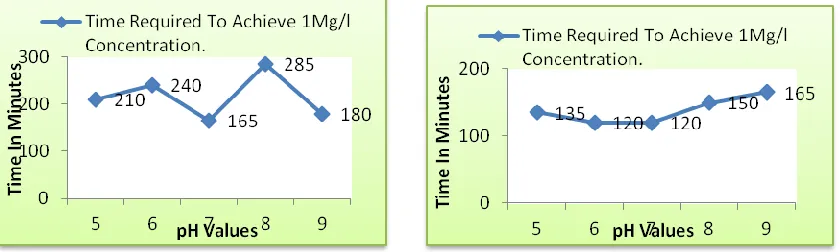
3. Effect of reaction time
The time dependence of fluoride removal by electrocoagulation process at different pHs is shown in figures 4.13 – 4.42. It can be seen from the figures that up to 30-85 % of the initial concentration of fluoride decreased within few 160 mins of processing for all concentrations and the residual fluoride concentration in effluent at the end of reaction time reached to < 1.0 mg / L. So we can discharge treated effluents to the environment in safety.
Fig.4.13 Time required at initial concentration Fig.4.14 Time required at initial concentration
Organized by C.O.E.T, Akola & IWWA, Amravati Center. Available Online at www.ijpret.com277
Fig. 4.15 Time required at initial concentration Fig. 4.16 Time required at initial concentration
5 mg/l , voltage = 6 V 5 mg/l , voltage = 12
V
Fig. 4.17 Time required at initial concentration Fig. 4.18 Time required at initial concentration
10mg/l , voltage = 6 V 10 mg/l , voltage = 12 V
4.3 CONCLUSIONS
The present study attempted to evaluate the applicability of an electrocoagulation method
using aluminum electrodes in the removal of fluoride from water.
The influence of various variables such as pH, time required for reduction in concentration
of fluoride was evaluated.
The results showed that electrocoagulation process aluminum electrodes could successfully
remove fluoride from the water.
The results obtained with synthetic solutions revealed that the rate of defluoridation is
Organized by C.O.E.T, Akola & IWWA, Amravati Center. Available Online at www.ijpret.com278
The maximum efficiency of fluoride removal for various initial concentration of fluoride was
obtained in constant voltage of 12 V and time required for removal is least at pH = 7 & 8.
During this process there was addition of residual aluminium to the treated water.
It can be also concluded that this process does not require addition of chemicals and no
need to pre & post-treatments
Low volume of sludge is obtained as compared to other methods hence no problem for
disposal of sludge.
Units can be designed for any capacity and are designed for specific locations & fluoride
content of water. But can be operated with varying fluoride concentrations by slightly altering the operating parameters.
The electrochemical reactor occupies less floor space.
Finally, the results demonstrated the technical feasibility of Electro-coagulation as a reliable
technique for removal of fluoride from water.
5. REFERENCES
1. Agarwal, M., Rai, K., Shrivastav, R., Dass, S., 2003. Defluoridation of water using amended
clay. J. Cleaner Produc. 11, 439–444.
2. Annouar, S., Mountadar, M., Soufiane, A., Elmidaoui, A., Sahli, M.A., Menkouchi, A., 2004.
Defluoridation of underground water by adsorption on the chitosan and by electrodialysis. Desalination 165, 437–438.
3. Anurag Tewari*, Ashutosh Dubey “Defluoridation of Drinking Water : Efficacy and Need “
(Journal of Chemical and Pharmaceutical Research2009, 1 (1):31-37)\
4. Apparao, B.V., Kartikeyan, G., 1986. Permissible limits of fluoride on in drinking water in
India in rural environment. Ind. J. Environ. Protec. 6, 172–175.
5. Arora, M., Maheshwari, R.C., Jain, S.K., Gupta, A., 2004. Use of membrane technology for
potable water production. Desalination 170, 105–112.
6. Ashok Kumar Yadav and Parveen Khan.“Fluoride and Flurosis Status in Groundwater of
Organized by C.O.E.T, Akola & IWWA, Amravati Center. Available Online at www.ijpret.com279
7. Azbar, N., Turkman, A., 2000. Defluoridation in drinking waters. Water Sci. and Technol. 42,
403–407.
8. Bårdsen, A., Bjorvatn, K., 1995. Fluoride sorption isotherm on fired clay. Proc. 1st Int.
Workshop on Fluorosis and Defluoridation of Water. Publ. Int. Soc. Fluoride Res.,pp. 46–49.
9. Bhargava, D.S., Killedar, D.J., 1992. Fluoride adsorption on fishbone charcoal through a
moving media adsorber. Water Res. 26, 781–788.
10.Biswas, K., Saha, S.K., Ghosh, U.C., 2007. Adsorption of fluoride from aqueous solution by a
synthetic iron(III)–aluminum(III) mixed oxide. Ind. Eng. Chem.Res. 46, 5346–5356.
11.Bjorvatn, K., Bardsen, A., TekleHaimanot, R., 1997. Defluoridation of drinking water by use
of clay/soil. In: 2nd Int. Workshop on Fluorosis and Defluoridation of Water. Publ. Int. Soc. Fluoride Res., pp. 100–105.
12.Bower, C.A., Hatcher, J.T., 1967. Adsorption of fluoride by soils and minerals. J. Soil Sci. 3,
151–154.
13.Brajesh K. Shrivastava and A. Vani Comparative Study of Defluoridation Technologies in
India (Asian J. Exp. Sci., Vol. 23, No. 1, 2009; 269-274)
14.Ching -Yao Hu, Shang-Lien Lo, Wen-Hui Kuan “Simulation the kinetics of fluoride removal by
electrocoagulation (EC) process using aluminum electrodes” (Research Center for Environmental Pollution Prevention and Control Technology, Graduate Institute of Environmental Engineering, National Taiwan University, November 2006)
15.Cengeloglu, Y., Kir, E., Ersoz, M., 2002. Removal of fluoride from aqueous solution by using
red mud. Sep. Purif. Technol. 28, 81–86.
16.Chaturvedi, A.K., Pathak, K.C., Singh, V.N., 1988. Fluoride removal from water by adsorption
on China clay. Appl. Clay Sci. 3, 337–346.
17.Chaturvedi, A.K., Yadava, K.P., Pathak, K.C., Singh, V.N., 1990. Defluoridation of water by
adsorption on fly ash. Water Air and Soil Pollut. 49, 51–60.
18.Chernet, T., Trafi, Y., Valles, V., 2002. Mechanism of degradation of the quality of natural
water in the lakes region of the Ethiopian rift valley. Water Res. 35,2819–2832.
19.Czarnowski, W., Wrzesniowska, K., Krechniak, J., 1996. Fluoride in drinking water and
Organized by C.O.E.T, Akola & IWWA, Amravati Center. Available Online at www.ijpret.com280
20.Dahi, E., Mtalo, F., Njau, B., Bregnhj, H., 1996. Defluoridation Using the Nalgonda Technique
in Tanzania, 22nd Water, Engineering and Development Centre (WEDC) Conference, New Delhi, India. Denmark.
21.Diawara, C.K., 2008. Nanofiltration process efficiency in water desalination. Sep. Purif. Rev.
37, 303–325.
22.“Defluoridation of water using Activated Alumina Technology: Studies carried out at IIT