Research Article ISSN 2250-0480 VOL 6/ ISSUE 1/JAN 2016
DESIGNING NOVEL MEK1 INHIBITORS AS ANTICANCER AGENTS
PARAG BHATTACHARYYA*1,2, MADALA KISHORE KUMAR2, MANGAMOORI
LAKSHMI NARASU1, RAMBABU GUNDLA3, SOMA SAMANTA4, CHRISTINE
CUTHBERTSON4 AND NOURIE NEAMATI4
1Center for Biotechnology, Jawaharlal Nehru Technological University, Hyderabad, India. 2GVK Biosciences Pvt. Ltd., Hyderabad, India.
3Department of Chemistry, GITAM School of Technology, GITAM University, Hyderabad, India. 4Department of Medicinal Chemistry, College of Pharmacy, University of Michigan,
Ann Arbor, MI 48109, United States.
ABSTRACT
MEK1 is a key player of Ras-Raf-MEK-ERK pathway, a widely studied pathway in cancer biology. MEK1 inhibitors therefore are promising agents for cancer treatment. Recently, the combination of MEK1 inhibitors and PPARgamma agonists are emerging as effective anticancer therapy. Here, we studied the designing of novel allosteric-MEK1 inhibitors using common feature pharmacophore protocol of DS3.5. The best hypothesis, Hypo1 was selected based on rank and max-fit value and validated with Güner-Henry scoring method. The validated model was used as template to screen an in-house database in order to retrieve potential hits. Top ranking hits were subjected to docking to analyze their interactions with MEK1. Based on the interaction energy and binding mode, 115 compounds were selected for in vitro assay against MIA PACA-2 and PC-3 cells. Five compounds show percent inhibition of 45.8-52.2% against MIA PACA-2 cells. Compounds were further tested for inhibition of p-ERK expression, the immediate downstream kinase of MEK1. Compound 72 shows 35% inhibition of p-ERK expression.
KEYWORDS: MEK1, Pharmacophore, Docking, Cytotoxicity, Downstream kinase, PPARgamma
INTRODUCTION
Mitogen-activated protein kinase kinase 1 (MAP2K1, MEK1) is a part of a signalling pathway called the Ras-Raf-MEK-ERK (RAS/MAPK) pathway. Dysregulation of this pathway leads to oncogenesis in humans. Constitutively active MEK1 proteins are present in a relatively high number of human tumors, particularly those from the colon, lung, pancreas, ovary and kidney1. MEK1 is known to be activated by several kinases, including Mos, A-Raf, B-Raf, Raf-1 and MEKK. At the same time, ERK1 is the only known substrates of MEK1. Therefore, inhibition of MEK1, rather than the Raf kinases, might offer a more effective approach to block signal transduction through the ERK pathway. Inhibitors of MEK1 operate either in an ATP-competitive fashion, targeting the ATP-binding site, or in a
Research Article ISSN 2250-0480 VOL 6/ ISSUE 1/JAN 2016
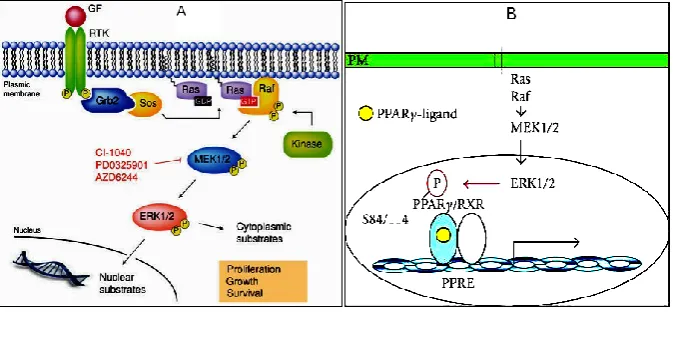
Schematic representation of the RAS/MAPK pathway and its involvement in cancer
Figure IA
Ras-Raf-MEK-ERK (RAS/MAPK) pathway4. B: Upstream and Downstream kinases of MEK1 and PPARG-ERK crosstalk5.
The present study is undertaken to design novel allosteric (non-competitive to ATP binding site) inhibitors of MEK1 using the structure activity relationship of already known inhibitors. Few highly active inhibitors from the literature were used as a template for generating a pharmacophore model to retrieve databases of drug like compounds. Upon retrieval, hits were subjected to docking against allosteric site of MEK1 followed by in vitro screening against 2 cancer cell lines i.e. MIA PACA-2 and PC-3. In order to prove the allosteric mechanism of inhibition computationally, newly designed compounds were subjected to docking against ATP binding site of MEK1. Further, to confirm MEK1 mediated anticancer activities, few promising compounds emerged from in vitro cell proliferation studies were tested for inhibition of MEK1 downstream kinase expression in MIA PACA-2 cells. In the second step of our study, we tested the combined antiproliferative effect of these newly designed MEK1 inhibitors with a known PPARG agonist in MIA PACA-2 cells, however results are not disclosed here.
MATERIALS AND METHODS
In silico studies
Common feature pharmacophore model
The common feature hypothesis (HipHop pharmacophore model) is an automated tool within Discovery studio version 3.5 (DS3.5) based on the alignment of common features present in a set of highly potent compounds termed as training set. HipHop generates a „qualitative model‟ from a set of compounds without using activity data. This qualitative model represents the vital 3D arrangement of functional groups common for the
set of compounds to form specific biological targets interactions. Molecules in the training set were evaluated based on the types of chemical features they contain, along with the ability to adopt a conformation that allows those features to be superimposed on a particular configurations. The partial features of molecules also mapped by HipHop in an aligned set, which is important to identify diverse and more significant models reducing the risk of missing a molecule which does not map to all the pharmacophore features. The generated pharmacophores were ranked from 1 to 10 (Hypo 1 to 10) as they built. The ranking indicates the mapping of the compounds onto the
proposed pharmacophores6. Five allosteric
inhibitors of MEK1 were carefully selected from literature by considering the activity, structural rigidity, and diversity to generate pharmacophore model. The structures and conformations of these 5 compounds were built within the HipHop module. The Poling algorithm implemented was used to generate conformations for all of the compounds. Possible diverse sets of conformations were generated for each molecule over an energy range
20 kcal/mol using the “BEST/Flexible”
conformation generation option in HipHop.
Research Article ISSN 2250-0480 VOL 6/ ISSUE 1/JAN 2016
coverage of activity space by the model, the enrichment factor E, and the Güner-Henry (GH) score. These variables are determined using information derived from the total number of compounds in the drug database (D), the number of
actives in the database (A), the number of actives retrieved by the model (Ha), and the total number of hits retrieved by the model (Ht). The formula to evaluate the GH score is
The representative common pharmacophore hypothesis (Hypo1) was used as search query to retrieve potential hits with novel structural scaffolds and desired chemical features from the ~1M compounds of GVK BIO‟s in-house database with drug like properties. These libraries were loaded into DS3.5 and “Search 3D database” protocol was used to screen the hits with the exact maps with the features.
Cluster analysis and docking studies
Primarily screened compounds were further refined by cluster analysis, a methodology used for arranging the derivatives under same scaffold (central moiety) followed by a substructure search. Here, cluster representatives were explored for the probable features responsible for interactions with MEK1 with reference to the crystal ligand complexes from PDB. MEK1 crystal structure from PDB (ID: 3PP1) was used for the docking studies using CDOCKER program of DS3.5. CDOCKER, a molecular dynamics (MD) simulated-annealing-based algorithm is preferable where ligand set is large and ligand complexity is low. 3D structure from protein data bank was downloaded and “Prepare Protein” protocol was applied to minimize the energy. The ligand side chains are conformationally sampled and were subjected to core-constrained protein docking, using a modified CHARMm-based CDOCKER method to generate top poses along with CDOCKER energies8. Before subjected to docking, the ligand set was prepared using “Prepare Ligands” protocol preceded by the minimization using “Smart Minimizer”, a CHARMm based force field method. Using “Prepare Ligands” protocol, charges of ligands were standardized, possible ionization states were explored at pH 6.5-8.5, and tautomers and isomers
maintaining original stereochemistry were
generated. Docking was also performed at ATP-binding site of the 3PP1 crystal structure using the CDOCKER program as discussed above. CDOCKER interaction energy of the newly designed compounds at allosteric binding site were compared to that of ATP-binding site in order to prove the allosteric nature of inhibition where
energy at allosteric site are expected to be significantly lower.
In-vitro studies Cytotoxicity assay Cell line selection
MIA PaCa-2 (Human pancreatic carcinoma) and PC-3 (Human prostate cancer) cell lines were selected for in vitro assay to test the cytotoxic activity of newly designed MEK1 inhibitors. MIA PaCa-2 cells over-express MEK1 and being widely used in MEK1 inhibitor studies1,9, while PC-3 cells are already been tested for synergic activity assays of MEK1 inhibitors in combination with PPARgamma agonists2. The selection of PC-3 cells was influenced by the long term objective to perform a synergic assay with newly designed MEK1 inhibitors from this study in combination with known PPARG agonist. As discussed previously, it is evident that when combined with a PPARG agonist, MEK1 inhibitors show higher anticancer activity and can be an effective treatment for specific drug-resistant cancers3.
Cell culture
MIA PaCa-2 and PC-3 cell lines were purchased from the American Type Culture Collection (Manassas, VA, USA). Cell lines were maintained in the appropriate growth media [RPMI 1640 (Gibco) containing 10% heat-inactivated FBS (Thermo- Fisher scientific) at 37°C in a humidified atmosphere of 5% CO2. For subculture and experiments, cells were washed with 1 × Dulbecco‟s PBS (DPBS, Gibco), detached using trypsin-EDTA, 1X (Corning), collected in growth media and centrifuged. All experiments were performed in growth media using sub-confluent cells in the exponential growth phase.
MTT assay
Cytotoxicity was assessed by
Research Article ISSN 2250-0480 VOL 6/ ISSUE 1/JAN 2016
L - 28 the treatment, MTT (Amresco, Solon, OH) solution was added to the well to a final concentration of 0.3 mg/ml, and incubated for 4 hrs at 37°C. At the end of incubation, the supernatant was removed and 100 ul of DMSO was added to each wells. Then the plates were placed on a shaker for 15 minutes at room temperature and absorbance was measured at 570 nm. Cytotoxicity was assessed by the cell viability rate as {1-(At-Ab)/(Ac- Ab)}×100 (At , Ac and Ab were the absorbance values from cells which were treated with compound, cells which were not treated with compound and blank, respectively). IC50 values were calculated by plotting concentrations (log) of the compounds versus corresponding % inhibition values.
Downstream effector assay
SDS-PAGE and Western blotting
4×10⁵/well of MIA PaCa-2 cells were cultured in 6-well tissue culture plates. Cells were treated with compounds at 20 uM for 4 hrs. After treatment, cells were lysed with cell lysis buffer (1% Triton X-100, 25 mM Tris pH 7.4, 150 mM NaCl, supplemented with proteinase inhibitor and phosphotase inhibitor cocktail) at 4°C for 30 minutes and centrifuged (12000 rpm, 10 minutes, 4°C). Protein concentrations of supernatants were measured with BCA protein detection kit (Thermo Fisher Scientific). 40 ug protein per sample was
subjected to SDS-PAGE analysis.10%
polyacrylamide gels with Tris/glycine/SDS running buffer (Bio-Rad) were used for separation of proteins in the sample. Proteins were then electro transferred to methanol activated immobilon-FL PVDF membranes (EMD Millipore, Billerica, MA). Membranes were blocked with blocking buffer (Thermo Fisher Scientific) for 1 hr at room temperature and incubated with primary antibodies (Cell Signaling, Danvers, MA) in 5% BSA overnight at 4°C.Primary antibodies p-stat3 (9145L, cell signaling,1:1000), Phospho-p44/42 MAPK (Erk1/2) (Thr202/Tyr204) (D13.14.4E) XP® (4370S, Cell signaling, 1:1000), GAPDH
(2118L, Cell signaling, 1:2000), p-AKT [(Phospho-Akt (Ser473) (587F11)], (4051S, Cell signaling, 1:1000) were used for immunoblotting. Membranes were then washed with TBST (10 minutes × 3 times), incubated with Dylight 800-conjugated secondary antibodies (Thermo Fisher Scientific, Rockford, IL) 1:7500 dilutions in 5% milk for 1 hr at room temperature, and washed with TBST (5 minutes × 3 times) and TBS (5 minutes). Fluorescent signal was then scanned by Odyssey Imaging Systems (LI-COR Biosciences, Lincoln, NE). Band intensities were quantified using Image studio software for Odyssey (Li-Cor Bioscience) where GAPDH levels were used to normalize the band intensities. Percentage inhibition of p-ERK were calculated and plotted in Microsoft-Excel.
RESULTS
In silico studies
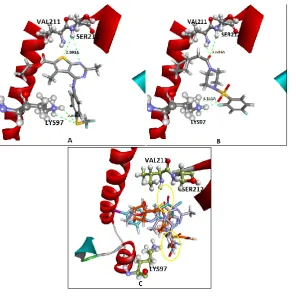
Designing common feature pharmacophore model A common structural pattern was observed in MEK1 allosteric inhibitors throughout the structure activity relationship study from literature. PDB entries reveal the inhibitor-receptor interactions involving specific amino acids i.e. Lys97, Ser212 and Val211 in ligand binding domain of MEK1 allosteric binding site. Specially, inhibitor-Lys97 interaction(s) appeared to hold the key as PDB entries studied here retain the interaction in common. Presence of electronegative H-bond acceptor(s) in the inhibitor structure facilitates the H-bond interactions with the above mentioned residues. Moreover, a hydrophobic feature towards the pocket encircled with residues Met143, Val127, Ile141, and Phe209 seems to have the structural importance to the inhibitors. Figure II shows the receptor-ligand interactions from 2 PDB IDs i.e.
3OS311 and 3PP112, shaded shapes
Research Article ISSN 2250-0480 VOL 6/ ISSUE 1/JAN 2016
L - 29
Crystal ligand interactions with amino acid residues in allosteric binding site of MEK1
Figure II
Receptor-Ligand interaction: PDB IDs 3OS3 (A) and 3PP1 (B)[http://www.rcsb.org].
The training set compounds (Fig III) selected for pharmacophore generation, were chemically diverse and expected to have similar binding mode in the allosteric binding site of MEK1. The pharmacophore features were selected based on (a) the structural and chemical features of the training set inhibitors, (b) the architecture of MEK1 allosteric binding site, and (c) the critical interactions observed between the crystal ligand and the key residues present in the binding site (PDB ID: 3PP1). The considered features for the generation of pharmacophore model were H-bond
acceptor (HBA), H-bond donor (HBD),
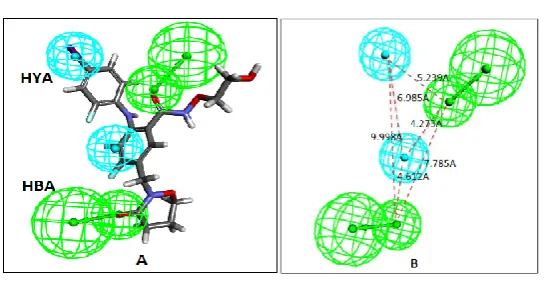
hydrophobic (HYA) and ring aromatic (RA) feature. Ten optimal pharmacophore hypotheses were generated by each of the HipHop run. These pharmacophore models were validated internally after mapping with each of the training set compounds and out of the best mapped models, Hypo1 (Fig IV) has been selected. Hypo1 carries all the important features as discussed above i.e. two electronegative (HBA) and two hydrophobic (HYA) features.
Training set
N
N
O O
O F
N F
F I
O
O
N
N
N N
O
O F
F I
O
O
N S
N N N
O
O H
H
Compound 116 Compound 117 Compound 118
IC50=5.2 nM11 IC50=3.2 nM12 IC50=38 nM13
N
N N
O F
N Cl
Br
O
O
N
N N
O O
F
O I
Compound 119 Compound 120
IC50=12 nM14 IC50=30 nM15
Figure III
Research Article ISSN 2250-0480 VOL 6/ ISSUE 1/JAN 2016
L - 30 Validation of common feature pharmacophore model and database screening
A test set database of 51 compounds with wide range of activity profile against MEK1 was built to validate the Hypo1 for its ability to discriminate active compounds from inactive compounds and Güner-Henry (GH) score was calculated. Hypo1 model generated in this study is resulted with a GH
score 0.65 (Table I), whereas GH score 0.6-1 indicates an optimal model. Once validated, Hypo1 was used as 3D query to screen ~1M compounds with drug like properties from in-house database to retrieve 5226 compounds, automatically sorted with the fit value it possesses corresponding to the pharmacophore mapping.
Table I GH score for Hypo1
Total compounds in database (D) 51 Total number of actives in database (A) 37
Total hits (Ht) 39
Active hits (Ha) 35
% Yield of actives (%Y) 89.74
% Ratio of actives in the hit list (%A) 94.60 Enrichment factor or enhancement (E) 1.24
False negative 2
False positives 4
GH score (goodness of hit list) 0.65
3D representation of the features in the Hypo1 model and ligand mapping
Figure IVA
Hypo1 is mapped onto compound 116. B: 3D representation of the features in the Hypo1 model i.e. H-bond acceptor (HBA) and hydrophobic (HYA) along with the intra-feature distances.
Cluster analysis and docking studies
All 5226 compounds i.e. primary set retrieved upon the Hypo1 screening were clustered based on central moieties. Promising cluster representatives were subjected to a substructure filter as discussed previously and a set of 564 compounds (~10% representatives from each cluster) was selected for docking studies. Docking was performed into the allosteric binding site of MEK1 (PDB ID: 3PP1). Coordinates of MEK1 from the MEK1/TAK-733 crystal structure were used after removing TAK-733 from the complex. Here, we used interaction energy of <-45 kcal/mol as threshold value for further refinement of novel ligand set. Based on this cut-off, 285 out of the primary set of 564 compounds were selected and further analyzed for
Research Article ISSN 2250-0480 VOL 6/ ISSUE 1/JAN 2016
L - 31
complexes are reported with CDOCKER
interaction energy along with the distances of H-bond interactions towards Ser212 and Lys97 residues. Figure V A represents the interactions between compound 22 and binding site residues. Superimposed image of TAK-733, compounds 22
and 72 showing the overlapping of key features responsible for H-bond interactions is represented
in Figure V D. Crystal ligand TAK-733 was also re-docked into the MEK1 allosteric binding site. CDOCKER interaction energy for TAK-733/MEK1 re-docking was found to be -57.126 kcal/mol where as H-bond distances of 2.252 A0 and 2.501 A0 were found towards Lys97 and Ser212 residues respectively.
Docking interactions of newly designed ligand and superimposition with crystal ligand
Figure VA
MEK1 interactions with compound 22. B: MEK1 interactions with compound 72. C: Superimposition of TAK-733 (blue), compound 22 (purple) and 72 (saffron) in MEK1 allosteric binding site.
In order to prove the allosteric nature of inhibition, an important aspect of this study, the newly designed compounds were docked into ATP-binding site of the MEK1 using the CDOCKER program as discussed above. We used already prepared MEK1 protein crystal structure (3PP1) for this purpose. Here, coordinates of MEK1 from the MEK1/ATP complex were used after removing
Research Article ISSN 2250-0480 VOL 6/ ISSUE 1/JAN 2016
L - 32 Table II
CDOCKER interaction energy and H-bond distance of top ranked 10 compounds
Compound #
CDOCKER interaction energy at allosteric site/ATP binding site
(-kcal/mol)
H-bond distance from
Lys97 (A0)
H-bond distance from Ser212 (A0)
22 52.886/8.142 2.806 2.891
1 52.709/4.985 2.512 3.405
72 52.556/9.225 3.161 2.603
28 52.312/6.783 2.997 2.752
86 52.215/4.582 3.212 2.625
89 52.054/4.869 3.382 2.645
35 51.929/6.665 3.088 2.714
90 51.772/5.886 3.219 2.845
14 51.559/8.188 2.795 3.275
95 51.351/10.632 3.241 2.859
TAK-733 57.126/4.118 2.252 2.501
In vitro studies Cytotoxicity assay
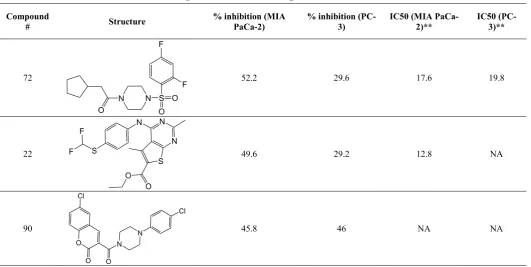
115 compounds were selected for in vitro assays and tested against MIA PaCa-2 and PC-3 cell lines for their anti-proliferative activities. Compounds 86, 14, 72, 22, 90, 1 and 35 shows relatively higher inhibition rate against both the cell lines tested.
MTT assay results i.e. % inhibition of cell proliferation and IC50 values are reported in Table III. Compounds 22, 86 and 72 shows IC50 of 12.8, 13.8 and 17.8 uM respectively against MIA PaCa-2 whereas compounds 1, 86 and 35 shows IC50 of 19.8, 22.4 and 37.0 uM respectively against PC-3 cells.
Table III
Anti-proliferative activities against MIA PaCa-2 and PC-3 cells
Mean % inhibition* @ 30 uM and IC50 values against MIA PaCa-2 and PC-3 cells
Compound
# Structure
% inhibition (MIA PaCa-2)
% inhibition (PC-3)
IC50 (MIA PaCa-2)**
IC50 (PC-3)**
72
S N N
O O O
F F
52.2 29.6 17.6 19.8
22
S N N N
S
O F
F
O
49.6 29.2 12.8 NA
90
O N
N
O O Cl
Cl
Research Article ISSN 2250-0480 VOL 6/ ISSUE 1/JAN 2016
L - 33 35
O N N
O
O O
N O
H H H
H F
48.8 48.3 46.9 37
86 N
S O
O
O N F
Cl
47.7 66.6 13.8 22.4
14
S
N
N N
23.7 NA 49.2 NA
1***
N N S
O
O O
20.3 59.7 NA NA
*Values are mean of 3 different runs, **uM, ***concentration at 20 uM, NA – not available
Downstream effector assay
MEK1 mediated anticancer activities of the newly designed compounds were evaluated by expression
of MEK1 downstream effectors i.e. ERK, p-STAT3, GAPDH and p-AKT in MIA PaCa-2 cells. Western blot images are reported in Figure VI.
Western blot of analysis of MEK1 downstream effectors
Figure VI
Expression of p-ERK, p-STAT3, GAPDH and p-AKT in MIA PaCa-2 cells.
Graph I represents the quantified values of western blot analysis. At a concentration of 20 uM, compounds 72 and 22 shows 35.06% and 11.53% inhibition respectively against p-ERK expression, the immediate downstream kinase of MEK1. As indicated in Figure V, compounds 14 and 1 show non-significant inhibition of p-ERK expression,
Research Article ISSN 2250-0480 VOL 6/ ISSUE 1/JAN 2016
L - 34 Graph I
Analysis of p-ERK expression
DISCUSSION
Inhibitory activities of the newly designed compounds against MIA PaCa-2 cells are correlated with the inhibition p-ERK expression. MIA PaCa-2 cells show higher rate of inhibition when treated with compounds 22 and 72. In downstream kinase assay, compounds 22 and 72 shows 11.53%and 35.06% inhibition of p-ERK expression respectively, where as compounds 14 and 1 showing no inhibition against p-ERK expression correlating the result of cell proliferation assay with minimal inhibition (Table III). This indicates the most valuable finding of the study that anticancer activity of compounds 22 and 72 is mediated by MEK1. This study also succeeded to achieve the eminent correlation between in silico and in vitro assay results as compounds with lower interaction energies appeared to have higher in vitro activities. Compounds 86, 14, 72, 22, 90 and 35 are
among the best ranked 10 compounds as per the interaction energies are concerned (Table II). Hence, it is believed that computational optimization of these compounds can be resulted in the development of highly potent anticancer agents specially when combined with a PPARG agonist.
CONCLUSION
This study identified a fair number of compounds possessing growth inhibitory activities against pancreatic and prostate cancer cell lines using standard in silico drug designing methods followed by in vitro assays. Considering the nature of treatment resistance in these types of cancers, newly designed MEK1 inhibitors can be very useful leads. Compounds 22 and 72 are undergoing optimization and further development to get more drug-able leads.
REFERENCES
1. Yap JL, Worlikar S, MacKerell AD Jr,
Shapiro P and Fletcher S, Small-molecule inhibitors of the ERK signaling pathway: Towards novel anticancer therapeutics. ChemMedChem. 6 (1): 38-48, (2011)
2. Bolden A, Bernard L, Jones D, Akinyeke T and Stewart LV, The PPAR Gamma Agonist
Troglitazone Regulates Erk 1/2
Phosphorylation via a PPARγ-Independent, MEK-Dependent Pathway in Human Prostate Cancer Cells. PPAR Res, 2012: 929052, (2012)
3. Gronemeyer Hinrich and Pattabhiraman
Shankaranarayanan. RXR-PPARGamma
agonist/growth factor inhibitor combination therapy for inducing apoptosis and the
treatment of cancer, International Patent, WO 2010070379 A1, 2010.
4. Fremin C and Meloche S, From basic
research to clinical development of MEK1/2 inhibitors for cancer therapy. J Hematol Oncol, 3: 8, (2010)
5. Elke Burgermeister and Rony Seger,
PPARγ and MEK Interactions in Cancer. PPAR Res, 2008: 309469, (2008)
6. Discovery Studio 3.5, Accelrys Inc., San Diego, CA, USA, 2012
7. Osman F. Guner, Ed. Pharmacophore
Perception, Development, and Use in Drug
Design, International University Line
publishers: La Jolla, CA: 191-211 (2000) 8. Pearce BC, Langley DR, Kang J, Huang H
Research Article ISSN 2250-0480 VOL 6/ ISSUE 1/JAN 2016
optimization. J Chem Inf Model. 49(7): 1797-809, (2009)
9. Yip-Schneider MT and Schmidt CM, MEK
inhibition of pancreatic carcinoma cells by U0126 and its effect in combination with sulindac. Pancreas. 27(4): 337-44, (2003)
10. Carmichael J, DeGraff WG, Gazdar AF,
Minna JD and Mitchell JB, Evaluation of a
tetrazolium-based semiautomated
colorimetric assay: assessment of
chemosensitivity testing. Cancer Res. 47(4): 936-942, (1987)
11. Isshiki Y, Kohchi Y, Iikura H, Matsubara Y, Asoh K, Murata T, Kohchi M, Mizuguchi E, Tsujii S, Hattori K, Miura T, Yoshimura Y, Aida S, Miwa M, Saitoh R, Murao N, Okabe H, Belunis C, Janson C, Lukacs C, Schuck V and Shimma N, Design and synthesis of novel allosteric MEK inhibitor CH4987655 as an orally available anticancer agent. Bioorg Med Chem Lett. 21(6): 1795-801, (2011)
12. Dong Q, Dougan DR, Gong X, Halkowycz P,
Jin B, Kanouni T, O'Connell SM, Scorah N, Shi L, Wallace MB and Zhou F, Discovery of TAK-733, a potent and selective MEK
allosteric site inhibitor for the treatment of cancer. Bioorg Med Chem Lett. 21(5): 1315-9, (2011)
13. El Abdellaoui H, Varaprasad CV, Barawkar D, Chakravarty S, Maderna A, Tam R, Chen
H, Allan M, Wu JZ, Appleby T, Yan
S, Zhang W, Lang S, Yao N, Hamatake R and Hong Z, Identification of isothiazole-4-carboxamidines derivatives as a novel class of allosteric MEK1 inhibitors. Bioorg Med Chem Lett. 16(21): 5561-6, (2006)
14. R.S. Finn, M.M. Javle, B.R. Tan Jr., C.C Weekes, J.C. Bendell, A. Patnaik, G.N. Khan, D. Laheru, L. Anderson, E. Barrett, J.L. Christy-Bittel, K. Guthrie, K.S. Litwiler, and T.S. Bekaii-Saab, A Phase 1 Study of MEK Inhibitor MEK162 (ARRY-438162) in Patients with Biliary Tract Cancer. ASCO GI, Jan 19-21, 2012, San Francisco, CA
15. Wallace MB, Adams ME, Kanouni T, Mol
CD, Dougan DR, Feher VA, O‟Connell
![Figure II Receptor-Ligand interaction: PDB IDs 3OS3 (A) and 3PP1 (B) [http://www.rcsb.org]](https://thumb-us.123doks.com/thumbv2/123dok_us/8708503.1740382/5.595.98.497.457.708/figure-receptor-ligand-interaction-pdb-ids-http-rcsb.webp)