Management and Research
Available online at: www.ijstmr.comIJSTMR
©
2017 | All Rights Reserved 42Spine MR Image Analysis Using Gabor Filter
Approach
Snehal G. Shewale
Computer DepartmentL.G.N.S.C.O.E Nashik, India
Anuja A Kumbharde
Computer Department L.G.N.S.C.O.ENashik, India
Chetan H. Patil
Bharat G. Gore
Computer Department Computer Department L.G.N.S.C.O.E L.G.N.S.C.O.E Nashik, India Nashik,IndiaAbstract: The system detect the problems such as disc degeneration, scoliosis, and osteoporosis. Accurate localization and segmentation of the intervertebral disc (IVD) in spine MRI can help accelerate the diagnosis time and assist in the treatment by providing quantitative parameters. In this paper, a method based on Gabor filter bank is proposed for IVD localization and segmentation. In this, the structural features of IVDs are extracted using a Gabor filter bank. Second, the Gabor features of spine are calculated and spinal curves are detected. Third, the Gabor feature images (GFI) of IVDs are calculated and adjusted according to the spinal curves. Fourth, the IVDs are localized by clustering analysis with GFI. Finally, an optimum greyscale-based algorithm with self-adaptive threshold, combined with the localization results and Gabor features of the spine, is performed for IVDs segmentation. Manual and automatic result is compared for accuracy purpose.
Keywords: Magnetic resonance image, intervertebral disc, Localization.
I. INTRODUCTION
Spinal diseases, such as low-back pain (LBP), are common diseases and are harmful to human health. LBP is a common symptom with considerable social and economic repercussions. LBP is experienced by 25 to 50 % of the adult population in the United States. The healthcare costs for spine pain (mainly for LBP) is increasing every year in the United States. The degeneration of intervertebral discs (IVDs) is the main factor resulting in chronic LBP and disability .Analysis of magnetic resonance imaging (MRI), including disc localization and segmentation, is the Procedure for Paper Submission degenerative disk disease and evaluate the spinal cord, ligaments, and lesions, as it provides high-resolution,high-contrast images in serial contiguous slices. Previously, disc localization and segmentation in spine MRI was performed by the radiologists manually, and the results depended on the a priori knowledge and experience. Additionally,manual localization and segmentation is laborious and lacks reproducibility between observers.
IJSTMR
©
2017 | All Rights Reserved 43 randomly sampled 3D image patches to the IVD center. The IVDs were segmented by classifying image pixels around disc centers as background or foreground. Kelm combined marginal space learning with a generative anatomical network to detect and label the IVDs. An optional case-adaptive segmentation approach was proposed to segment the IVDs and vertebrae in MRI and CT, respectively. The presence of intensity in homogeneities may influence the quality of intensity-based feature extraction. Extraction of information and its service for localization and segmentation of IVDs is important. Compared with other tissues in spinal MRI, IVD has the Zhu et al. BioMed Eng OnLine (2016) 15:32 Page 3 of 15 distinctly characteristic, relatively regular and similar elliptic structure. The extraction of IVD structure information, such as shape and direction, and avoiding interference from peripheral tissues is challenging. The Gabor filter, a windowed Fourier transform, derives from the work of Gabor D. Daugman extended the Gabor filter to two-dimensional (2D) spatial position. Given the biological background and the optimal space and spatial-frequency localization of Gabor filter it is widely used for image process applications. When the direction and frequency of the objects in an image are consistent with those of 2D-Gabor filters, the wavelet transformation has a strong response. Since the IVDs in spinal MRI are regular and ellipse-shaped, the recognition of IVDs is possible by transformation of Gabor filtering. We propose an unsupervised computer-aided IVD localization and segmentation method based on Gabor filter bank, which does not require any training. Among various wavelet bases, the 2D Gabor filters provide good resolution both in temporal and frequency domains, and provide the optimal basis to extract local features because of: (1) Frequency motivation: both multi-resolution and multi-orientation properties of Gabor wavelet are optimal for measuring local spatial frequencies (2) morphology motivation: it distorts the tolerance space for pattern recognition tasks. The proposed method adopts Gabor filters to extract the structural features of IVDs, and localize and segment the IVDs. The information from the Gabor filter is capable of increasing the accuracy and automation degree for IVD localization and segmentation.II. METHODOLOGY USED
IJSTMR
©
2017 | All Rights Reserved 44
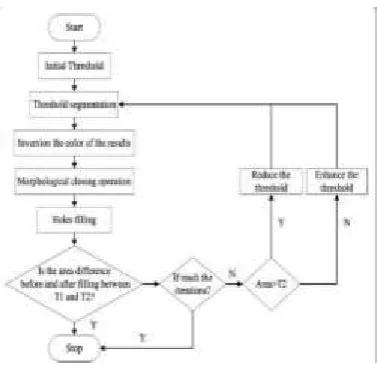
Fig 1. Flow diagram of the proposed method
A. Setting of the Gabor filter:
Effective extraction of the IVD features depends on the setting of the Gabor kernel function. Due to the elliptic shape of IVDs, the parameter _ of Gabor kernel is different in horizontal x and vertical y direction. In addition, there is an angle between the IVDs and the horizontal plane. Therefore, the Gabor kernel is defined as : where, x′ = x cos _μ + y sin _μ, y′ = −x sin _μ + y cos _μ represent the spatial locations of pixels. In spatial domain, the parameters _μ, __, and _ represent the direction, wavelength, and Gaussian window of Gabor filter bank, respectively.The parameters of Gabor are set as follows: to describe the local features of images, a Gabor filter bank has S directions and K scales (usually S = 8, K = 5) . However, the IVDs have a relatively uniform size and the differences among their angles are smaller. A Gabor filter bank in 16 directions with five scales is used. The upper frequency limit _max = _ 2 is set according to the experience. Since the size of IVDs is relatively uniform, the frequency spacing factor f = √4 2 is set to obtain the effective center frequency. The effective radius of the Gaussian window is expressed as rv = 2√2_ _v . According to the characteristics of the IVD (the width occupies at least 25 pixels and the thickness is about half of the width), _x = 3k _v , _y = 6k _v (where k = √2 ln 2). The symmetric Gabor kernel window with the size of 31 × 31 is used, based on experiment.
B. Localization Of Ivds-: Detection of spinal curves
IJSTMR
©
2017 | All Rights Reserved 45Fig. 3 Detection of spinal curves. a Spinal GFI Gspine The white point is the center of the spine, and the white crosses are the centers of left and right spinal edges. b The sum of the coefficients of the first n columns G(n). c The detection of spinal curves.
C. Localization of IVDs
The localization of IVDs is based on GFI information. GFI for localization of IVDs is calculated similar to the
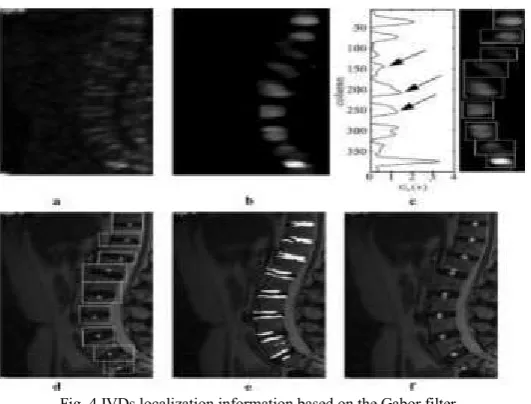
process for spines, but the directions of U1 and U2 are different. According to the anatomical knowledge, the angle between the long axis of the IVD and the horizontal line of MRI is almost ± 30°. Therefore, U1 = {7, 8, 9, 10, 11} and U2 = {1, 2, 3, 4, 5} represent directions close to the long axis of IVDs and close to the vertical directions, respectively.The IVDs information image GMdisc (Fig. 4b) is obtained by median filtering (elliptical filter template, long axis: 44 pixels, minor axis: 17 pixels) on the IVDs GFI (Fig. 4a). The searching range of IVDs is narrowed by spinal curves. The process of localization needs some a priori information. The centroid of the IVD is the locating point. In order to obtain the coordinate value of the locating point (XIVD, YIVD), two aspects of a priori anatomical knowledge are adopted:
I)Abscissa x of most IVDs is roughly loca ted in the same vertical line, except for the last few ones that lean slightly to the right.
II) The offsets of vertical y range from 20 mm to 50 mm (25 pixels to 60 pixels in this study). The information of local maximum of GMdisc, combined
a. IVDs GFI
b. IVDs information images GMdisc. c. Horizontal cumulative curve Gn(n).
d. IVD areas delineation based on localization results
IJSTMR
©
2017 | All Rights Reserved 46 Fig. 4 IVDs localization information based on the Gabor filter.(cross) and after (circle) correction with a priori knowledge, is used for coarse localization. In this process, correction of centre-of-gravity shift is also performed to improve the localization accuracy in case of severe spinal curvature. The process includes:
Step 1: Calculate the horizontal cumulative curve Gh(n) and the candidate vertical coordinate values. Gh(n) is obtained by adding each row with Eq. (5), Where M is the number of rows of the image. The coordinates of local maximum values are the candidates.
Step 2: Calculate the coarse YIVD. According to the a priori information II, the closer points merge into one. The YIVD is achieved after removing the points which do not meet the a priori information II.
Step 3: Calculate the coarse XIVD. The horizontal coordinate XIVD is calculated by a process similar to that for YIVD,but the regions of calculation are different. The mid-values of adjacent two YIVD are taken as boundaries to intercept the IVD part. The same action is performed as Eq. (6) in columns between the two boundaries. The XIVD is obtained based on the a priori information I.
Step 4: Calculate the boxes of IVDs to correct the coarse(XIVD, YIVD). Based on the results of Step 3, the rectangular regions of IVDs (Fig. 4d) are found by the boundary of the local peak of Gh(n) (Fig. 4c) and Gv(n). The upwards and downwards edges of the box in Fig. 4c are calculated by the minimum points and zero points of Gh(n). Then the left and right edges of the box are calculated by the minimum points and zero points of Gv(n) limited by upwards and downwards edges. Figure 4c shows the boxes in GMdisc. Figure 4d shows the boxes in the original image. The angles of IVDs are obtained by analyzing the GFIs information in the rectangular regions.
Step 5: Calculate the accurate center of IVDs (XIVD, YIVD). The binary image of GMdisc is calculated in the boxes obtained in step 3. Figure 4e shows the superposition of the original image and the binary image. Subsequently, the corrected localization of IVDs is obtained by calculating the centroid of the binary image. As shown in Fig. 4f, the white circles are the final localization results (XIVD, YIVD).
D. Segmentation of IVDs
Combining the localization results and spinal curves, the segmentation of IVDs is performed based on GFIs with an adaptive threshold. The main steps include:
Step 1: Delineate the candidate region of the IVD.
IJSTMR
©
2017 | All Rights Reserved 47 Step 3: Calculate the coarse segmentation of the IVD. The coarse segmentation results of IVDs are used in steps 2 to 5, in Fig. 5, with an adaptive local threshold TIVD.Step 4: Post-process for IVD segmentation. The coarse segmentation result may contain holes, non-smooth areas, and superfluous portions. In order to obtain the accurate segmentation, a morphological operator is used: holes filling,erosion, dilation, and five foreground pixels on the background pixel indicate that the pixel is the foreground pixel. When a segmentation result has many connected regions, the largest region is retained.
Fig 5. Flow chart for the adaptive local threshold based on the iteration
II. CONTRIBUTION
IJSTMR
©
2017 | All Rights Reserved 48 In above images manual selection is done by the MIPAV software which is intended for medical only By using MIPAV software we can convert the RGB image to Grey scale image,noise removal,etc functioning.IV. OUTPUT
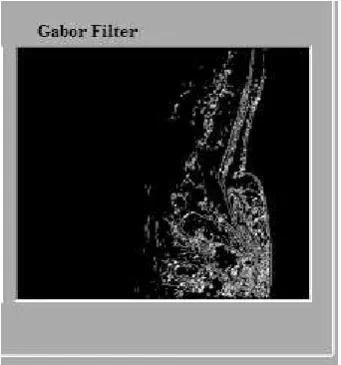
Fig 7.Gabor filter image
Fig 8. Output
In above figure the output is generated automatically by our system the dislocated disc is selected automatically after processing.
CONCLUSION
Hence,In this way we have implemented our system by comparing both result manual and automatic. Manual result is done by the MIPAV software where we concentrated on disc and in automatic result our system detect the disc automatically.
REFERENCES
1. Ract I, Meadeb JM, Mercy G, Cueff F, Husson JL, Guillin R. A review of the value of MRI signs in low back pain. Diagn Interv Imaging.2015;96:239–49.
2. Dagenais S, Galloway EK, Roffey DM. A systematic review of diagnostic imaging use for low back pain in the United States.Spine J. 2014;14:1036–48.
3. Lzzo R, Popolizio T, D’Aprile P, Muto M. Spinal pain. Eur J Radiol. 2015;84(5):746–56.
IJSTMR
©
2017 | All Rights Reserved 49 8. Peng ZG, Zhong J, Wee W, Lee JH. Automated vertebra detection and segmentation from the wholespine MR images. 2005 27th Annual International Conference of the IEEE Engineering in Medicine and Biology Society. 2005;2527–2530.
9. Castro-Mateos I, Pozo JM, Lazary A, Frangi AF. 2D segmentation of intervertebral discs and its degree of degeneration from T2-weighted magnetic resonance images. Medical imaging 2014. Comput Aided Diagn. 2014;9035:17.
10. Haq R, Aras R, Besachio DA, Borgie RC, Audette MA. 3D lumbar spine disc segmentation and compression simulation from MRI using shape-aware models. Int J Comput Assist Radiol Surg. 2015;10:45–54.
11. Law MWK, Tay K, Leung A, Garvin GJ, Li S. Intervertebral disc segmentation in MR images using anisotropic oriented flux. Med Image Anal.2013;17:43–61. Zhu et al. BioMed Eng OnLine (2016) 15:32 Page 15 of 15 12. Chevrefils C, Cheriet F, Grimard G, Aubin C. Watershed segmentation of intervertebral disk and spinal
canal from MRI images. Image Anal Recognit. 2007;4633:1017–27.
13. Neubert A, Fripp J, Engstrom C, Schwarz R, Lauer L, Salvado O, et al. Automated detection, 3D segmentation and analysis of high resolution spine MR images using statistical shape models. Phys Med Biol. 2012;57:8357–76. 14. Neubert A, Fripp J, Engstrom C, Walker D, Weber MA, Schwarz R, et al. Three-dimensional
morphological and signal intensity features for detection of intervertebral disc degeneration from magnetic resonance images. J Am Med Inform Assoc. 2013;20:1082–90.
15. Oktay AB, Akgul YS. Simultaneous localization of lumbar vertebrae and intervertebral discs with SVM-based MRF. IEEE Trans Biomed Eng2013;60:2375–83.
16. Ghosh S, Chaudhary V. Supervised methods for detection and segmentation of tissues in clinical lumbar MRI. Comput Med Imaging Graph. 2014;38:639–49.
18. Kelm BM, Wels M, Zhou SK, Seifert S, Suehling M, Zheng Y, Comaniciu D. Spine detection in CT and MR using iterated marginal space learningMed Image Anal. 2012;17:1283–92.
19. Daugman JG. Uncertainty relation for resolution in space, spatial frequency, and orientation optimized by two dimensional visual cortical filters. J Opt Soc Am. 1985;2:1160–9.
20. Daugman JG. Complete discrete 2-D Gabor transforms by neural networks for image analysis and compression. Transact Acoust Speech Signal Process. 1988; 36:1169–79.
21. Radman A, Jumari K, Zainal N. Iris segmentation in visible wavelength images using circular gabor filters and optimization. Arab J Foren Eng. 2014;39:3039–49.
22. Hacihaliloglu I, Rasoulian A, Rohling RN, et al. Local phase tensor features for 3-D ultrasound to statistical shape + pose spine model registration.IEEE Trans Med Imaging. 2014;33:2167–79.