1. INTRODUCTION
There are two known routines for quality and performance tasting of vehicle power transmission system in industry. One method is the road test in which the main objective is life assessment. The other method is on dynamometer stands in which the power train is driven by a real internal combustion engine (IEC) against a simulated load produces by a power dissipating mechanism usually of hydraulic or electrical nature. Due to numerous varieties of engines and load cases, a large number of test stands of this kind are needed to cover a whole range of products of a manufacturer. Such systems having a real engine on the test bench have to bear with wear and tear costs of the engine during long term tests in addition to fuel and operating costs. As a result it is preferred, in most cases, to replace the engine with an electric motor simulating the engine [1, 2, 3]. The initiatives behind having a versatile road test simulator are the followings:
- For testing different gearboxes on conventional dynamometers the engine has to be changed to
match with the gearbox. A road test simulator solves this problem with one or few number of electric motors.
- Drive trains of different classes of cars require different test roads. Building test tracks are extremely costly and not common for off road or steep slopes. This can easily be done on a programmable simulator.
- For a long term durability road test, the fuel and the driver costs in addition to other vehicle on road wear costs are enormous. Also the tests are not fully observable and data acquisition during the test is not easy. With Road test simulator all these problems are solved and most of the energy put into the test can by recovered, hence reducing the test costs.
2. THE BASIC IDEA
The single line diagram of the system is shown in figure 1. This figure shows the system basic components and interfaces. Both motor side and road
Multi Purpose Drive Train Road Test Simulation System
M. Durali*and M. Sadedel2
1Proffesor, 2Msc Student, Faculty of Mechanical engineering Sharif University of Technology, Tehran, Iran
Abstract
This article describes the design and manufacturing of a subscale model of a multipurpose simulator which enables the user to perform costly road tests in lab. The simulator comprises of two AC servo machines, one acting as internal combustion engine and the other acting for road loads. The engine side drive can be programmed to simulate the exact performance curves of any desired engine and to even exert negative load similar to an engine during vehicle coasting with no gas input. The road side drive can also be programmed to simulate car inertia as well as road resistances such as positive or negative slopes, air drag and wind in different directions, tire resistances, and climatic road condition changes. The gear box to be tested, manual or automatic, can be installed between the two drives to complete the drive train. The system has the power saver feature, returning the brake power of the road side drive to electrical grid. A user friendly HMI enables the operator to do the adjustments and programming prior to the test and to customize the engine and the road according to the desired test. The used programming functions are very powerful and easy to use. During the test the operator can apply gas, brake and if necessary clutch manually or through the test program. All the test data is recorded during the test by the simulator data acquisition system for further analysis. This simulator can perform long term road tests bearing heavy cost and manpower on car companies. It is also capable of measuring drive train efficiency, observing speed and load related actions of automatic transmission, pre evaluation of development ideas and road testing engine and gearbox replacements for existing platforms. A 1:50 scale, but full feature, of the system was built and successfully tested for design assessment and evaluation.
side drives can be programmed by PC through their corresponding controllers and the I/O card to generate the torque and speed required at each instant of time during the test. The matching inertia is to compensate for the inertial effects of car mass which is not fully simulated by road side drive. A high speed data acquisition card is connected to different sensors for collection of the test data and storage on the PC. Further details will be given during description of each part.
3. ENGINE SIDE DRIVE
This drive should act exactly like an engine. In other words the output torque of this motor should be related to speed and modulated by the throttle as in a real engine map. To do so, any engine map must be converted to digital series or equations that can be accessed quickly during the test and be adjusted according to instantaneous inputs. We found the MT formula presented by Mashadi and Tajalli [4] a powerful tool for this purpose. This formula can estimate the engine speed and torque for any given throttle opening by taking those values for full throttle position. The mathematical representation of MT formula is shown in equation 1.
(1)
Te( , )is the engine torque as a function of crank speed and throttle position , and TFL( )is the full throttle value of the engine torque. The coefficients A, B, C, and Dare constants which have to be determined experimentally for each engine.
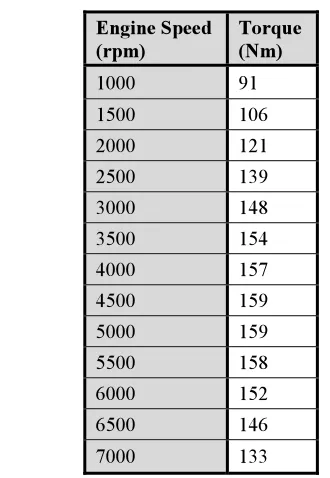
As a design step, an engine was selected for which the full throttle torque speed curve data is given in table 1.
For this engine the MT formula constants were calculated as:
A= -11.12 B= 0.0888 C= 0.803 D=1.824
Having these constants the torque-speed characteristic of the selected engine was obtained as shown in figure 2. This map agrees with the experimental map of the engine with a very good accuracy.
Z T
ZT Z
( ) ( , )
[1 exp( )] D
FL
e T C
T
A B Z
Z Z T
T
Fig. 1.Single line diagram of the system
Engine Speed (rpm)
Torque (Nm)
1000 91
1500 106 2000 121 2500 139
3000 148 3500 154 4000 157 4500 159
5000 159 5500 158 6000 152 6500 146
7000 133 Table 1.Speed torque data for the selected engine [5].
0 1000 2000 3000 4000 5000 6000
-20 0 20 40 60 80 100 120 140 160 180
Z (rpm)
Tm
(
N
.m
)
0% 10% 20% 30%
40% 50% 60% 70% 80% 100%
Fig. 2.Charachteristic curve of the engine calculated with MT formula
For each value of speed and throttle position, the simulator reads the torque from the map and give an equivalent signal to engine side motor controller. The controller will then give the appropriate signal to the motor to exert that torque to the test gearbox. The bandwidth of toque control loop (Fig. 3) of the motor controller is bigger that the speed control loop (Fig. 4), as a result the motor acts faster in torque control. The reason for that is the additional integrator in the speed control loop. It can therefore be assumed that the speed remains constant during each step of torque control.
4. ROAD SIDE DRIVE
In the roade side drive a torqe on the traction wheel equivalent to all driving related resistive forces is produced. This resistive toque works against the gearbox. The effects considered in the road side are:
Climbing resistance: positive and negative slopes are considered by calculating climbing torque TC from equation 2;
(2)
In the above equation Mis the mass of vehicle, gis the constant of gravity, is the slope angle, and ris the wheel radius. The wheel radius when unloaded is
ro, and when loaded by vehicle weight but not moving
is rs and when rolling under vehicle load is rd. The approximate relation between these radii is as defined by equation 3 [6].
(3)
Rolling resistance: The rolling resistances equivalent torque TRof the wheels are calculated from equation 4;
(4)
In which fRis the coefficient of rolling resistance.
Aerodynamic resistance:The equivalent aerodynamic resistance on car body is considered as a torque TA
calculated from equation 5 [6];
(5)
In which CDis the car drag coefficient, is the air density at ambient condition, Vis the car speed and Af
is the car frontal area. The total road side equivalent resistive torque Tris calculated at each instant of time during the test as in equation 6. This value is given as a signal to road side drive controller to produced Trin
the road side motor and to work against gearbox.
(6)
The value of Trcan be negative in steep downhills
at lower speeds, hence accelerating the car.
5. ELECTRICAL ARRANGEMENT
For many reasons such as uniform performance, low maintainance cost, and ease of control, AC brushless servomotor are chosen for both egine side and the road side drives. These machines can be controlled by drivers capable of speed and torque control. They also presnt good stability and have a fast enough response for this application. The drivers
r C R A
T T T T
ߩ 2
1 2
A D f d
T C UV A r
R
R d
T f Mg r
2. 3
s o
d
r r
r
T
sin
C
T Mg r T
T_ref T
Motor Torque _Controller
Fig. 3.Torque control loop
T_ref T
w_ref w
Speed _Controller Torque _Controller Motor 1/J 1s
Fig. 4.Speed control loop
convert the AC feed voltage to DC and invert it back to a new AC voltage with controlled frequency. The general electrical arrangement of the system is shown in Figure 5.
The capacitors on the DC lines are charged during deceleration. The resistor in the DC line can dissipate the excess voltage in the capacitor and avoid damage to the drive. The DC lines of the two machines are connected to bring about the possibility of power saving. With this feature if one of the drives goes into generation mode the produced energy is consumed in the other drive.
5. 1. The Control Hardware
The drivers of the Ac machines are connected to a
PC via an I/O card. This card digitizes the drive information with appropriate sampling rate and sends it to the computer. The calculated values are sent back to motor controllers by the I/O card. A data acquisition card is also digitizing the test parameters measured by sensors and send them to the computer for storage. Necessary protections are considered in different parts of the control hardware both on the power and the signal sides.
5. 2. Control Software
A series of subroutines managed by a main program in LabVIEW [7] environment play the role of control software of the simulator. The general view of the main menu of the software is shown in figure 6. The
Three -Phase Voltage Source
N A
B
C
SVPWM Generator Ual
ph
U
be
ta
P
ul
se
s
Resistor
+
-Machine-side Converter Road
g
A
B
C +
-Machine -side Converter Motor
g
A
B
C +
-Line -side Converter Road
g
A
B
C +
-Line -side Converter Motor
g
A
B
C +
-Electrical Reference
Electric Machine AC Road
Tm m
A
B
C a
b
c
Electric Machine AC Motor
Tm m
A
B
C a
b
c
Chopper
g
m
C
E
Capacitor Road
+
-Capacitor Motor
+
-Fig. 5.General electrical arrangement of the drives
Fig. 6.The main menu of the control software
menu has three parts. The upper part is the user interface during the test. Engine rpm and car speed, test times, different alarms, gas, brake, clutch and road slope knobs, and gear position are in the top menu
The bottom left part of the display shows the engine map programmed into the simulator. During the test an indicator shows the instantaneous operating point of the engine on the map and the operating path.
The bottom left part of the menu is for presetting s of the simulator for each test. It consists of seven pages tabbed separately. The different menus in this section and the data inputs are:
1. Engine menu; coefficients A, B, C, and D and the idle throttle opening
2. Gearbox menu; number of gears and their ratios and minimum throttle opening for each gear 3. Road and ambient Menu; air temperature and
pressure, and drag coefficient
4. Car menu; car mass, frontal area, coefficient of rolling friction, and wheel radii
5. Clutch menu; percent transmitted torque vs. paddle angle for manual clutch or torque transmission ratio vs. engine-gearbox speed difference for a torque converter
6. Brake menu; brake torque vs. brake paddle angle
7. Test menu; road profile and DAQ settings
6. THE SUB-SCALE SIMULATOR DESIGN AND CONSTRUCTION
To evaluate the design before manufacturing the real simulator, a subscale but full feature simulator was designed and built. In this section this simulator is described. The original simulator is to be able to test power trains for cars from subcompact to full size (classes A to E). The subscale simulator was designed with a 1:50 scale from the point of view of the car mass. Other parameters such as road slope (+/- 15o max), Coefficient of rolling friction (0.013), car speed (170 km/h max), drag coefficient (0.3) and other parameters not related to this scale factor were taken the same as the original simulator. The subscale simulator can show all speed related behaviors of the vehicle but not the power related ones, therefore one will not be able to do any strength and durability test on it. The selected drives (from LS Mecapion [8]) have a maximum power around 3kW and high enough maximum speed. A more powerful model was
selected for the road side drive to make sure that uphill stall of the engine even in heaviest gear can be observed. The scaled torque speed characteristic of the engine foe full throttle is compared with the torque speed characteristic of the selected motor in figure 7.
The corresponding drivers for the selected motors were obtained too. Besides chassis, all other parts of the subscale simulator were selected identical to the full size simulator. The software has also been slightly modified to fit with the needs of the subscale simulator.
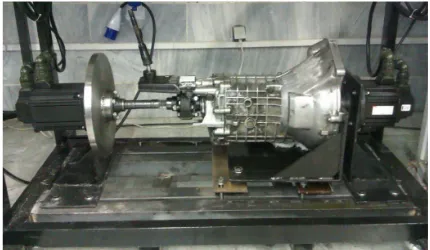
The sub-scale simulator has three main modules: Test Bed: The test bed is where the gearbox on which the test is to be performed will be mounted. The gearbox is coupled to the drives from both ends (Figure 7). Necessary adjustments in height and sideway positions of the gearbox is possible to make sure that the gearbox is well aligned with the drive
0 1000 2000 3000 4000 5000 0
0.5 1 1.5 2 2.5 3 3.5 4 4.5 5
Z (rpm)
Tm
(N
.m
)
Engine Electric Machine
Fig. 7.Platform section of the sub-scale simulator
Fig. 7.Comparison of torque speed characteristics of scaled engine and the selected motor.
shafts. Flexible couplings are provided to make sure that unnecessary loading on the drive shafts are avoided. In Figure 7 the arrangement is done for a BMW class 3 manual transmission gearbox. However necessary adaptors are provided to ensure the installation of the automatic transmission gearbox and torque converter on the platform too.
The arrangement on full size simulator will be pretty much the same, only the drive motors will be larger.
Electrical Module: This module assimilates the electrical cubicle of the full size simulator. It has all the necessary parts for a standard industrial electrical cubicle but off course in smaller sizes. The Drivers of the AC machines and their ballast resistor can be seen on the two sides of the board. In the middle part the power relays, the isolating relays, terminals, the DAQ adaptor, and the other elements are placed. Power and signal cables go from drivers to the motors and data cable is connected from this board to the system PC.
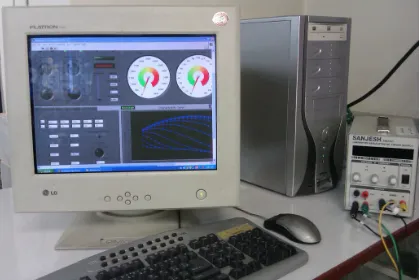
Control PC: The simulator is operated through the
test and operation software by a PC. The PC hoses the data acquisition and the I/O cards. The PC is fast enough to handle both control and data acquisition tasks at the same time. A portable switch board (shown in figure 10) enables the operator to stop the drives or the system while working on the platform and away from PC. This PC can be used in the original simulator without any change.
The general arrangement of the Subscale simulator can be seen in Figure 10. The simulator although called sub-scale, it is capable of testing full size gearboxes, but on lower power levels. In fact the aim was to see and assess the simulator design and to test the speed related performances of the gearboxes in a lower power scale. This is very important for automatic transmission gearboxes; as many features of these gearboxes are speed dependent. In fact the subscale simulator at its present capacity is well capable of evaluating the repairs done on automatic transmission gearboxes, a crucial mater to repair shops.
7. SIMULATOR TEST RESULTS
To show some of the capabilities of this multipurpose simulator some of the results of a test done on a manual gearbox is presented in this section. The test consists of the car speeding from stopped situation on a flat road, the driver shifting gears from 1 to 4 and decently speeding up. While cruising, the car faces an up hill followed by a flat and downhill ending to a flat road, when the driver steps up the gas and applies the brake.
Fig. 8.Electrical module of the sub-scale simulator
Fig. 10.The general view of the sub-scale simulator
Fig. 9.The control PC of the subscale simulator
The car speed during the test is shown in figure 12. This figure must be checked along with figure 13 in which the engine rpm is plotted against time during the test.
The acceleration under constant gas in each gear is apparent in figure 13. Please note the engine slow done as a result of the up hill slope and also due to driver decision to step up the gas at t = 61 sec. The driver is trying to slow down the car by shifting to heavier gears during time 50 to 59 sec.
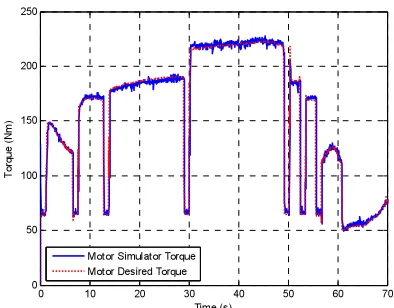
To check the action of the servomotors the motor desired torque as calculated by the simulation program and the measured torque produced by the engine side
drive are plotted on the same sheet and shown in figure 14. The sharp drops in the curves are due to the action of clutch.
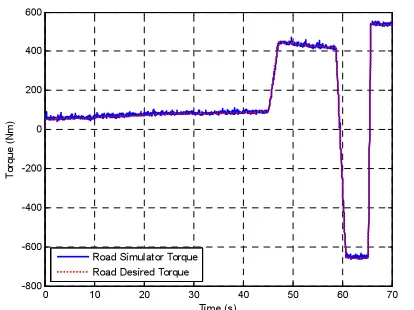
The desired torque and the actual measured torque produced by road side drive are compared during the test in figure 15. the roadside drive torque should be equal to sum of climbing, rolling, aerodynamic and braking torques. During the time that this sum becomes negative, usually as a result of a downhill slope, the road side drive plays the role of a motor and actually accelerates the gearbox and the engine (as in real life). For positive values of the torque, the drive acts as a generator producing electrical power which is either dissipated in the dissipation resistors or returned to the feed line as an action of power saving feature.
0 10 20 30 40 50 60 70
0 50 100 Gas A n gl e( % )
0 10 20 30 40 50 60 70
0 50 100 B rak e A ngl e (% )
0 10 20 30 40 50 60 70
0 50 100 C lu tc h A n g le ( % )
0 10 20 30 40 50 60 70
-20 0 20 Time (s) R o ad A n g le ( D egr ee)
Fig. 11.Sample driver and road inputs to the simulator
0 10 20 30 40 50 60 70
0 500 1000 1500 2000 2500 3000 3500 4000 Time (s) E n gi ne S p eed (rpm )
Gear 1 Gear 2 Gear 3 Gear 4 Gear 3 Gear 2 Gear 1
Fig. 13.Engine speed and gear position during the test
0 10 20 30 40 50 60 70
0 50 100 150 200 250 Time (s) To rq u e ( N m )
Motor Simulator Torque Motor Desired Torque
Fig. 14.Desired torque compared to produced torque by engine side drive
0 10 20 30 40 50 60 70
-10 0 10 20 30 40 50 60 70 Time (s) Car S p ee d (K m /h)
Gear 1 Gear 2 Gear 3 Gear 4 Gear 3 Gear 2 Gear 1
Fig. 12.Car speed during the test
8. CONCLUSIONS
The power train performance testing machines are systems that enable car manufacturers to perform performance and durability tests on the power train of their products in laboratory. This will reduce required expenses and man power usually required for road tests. These machines are manufactured by limited number of companies in the world. The objective of this research was to design such machine in Iran and to extend its capabilities to a multipurpose road test simulator system.
To achieve this goal the above mentioned system was designed to perform simulated road test on power train systems (manual or automatic) of cars in the range of A to E classes. The designed system is also capable of measuring power train efficiency, performing long term durability tests and can efficiently be used in development projects on new and existing platforms. The system is designed to be flexible and can be programmed to simulate any internal combustion engine and road geometry and condition. The system has also the power saver feature utilizing the generated electrical power in road side AC machine to partially run the engine side AC machine, hence reducing the power consumed during the test and reducing test costs.
To evaluate the design, a sub-scale model of the simulator with full features of the original simulator was designed and manufactured. As an example, the simulator was used in performing simulated road tests on a manual gearbox. The test results show that the system is well capable of performing such tests and
there is no technological barrier for manufacturing a full scale drive train road test simulator in Iran.
REFERENCES
[1] www.dynaspede.net, 2010. [2] www.cncdesign.com, 2010. [3] www.incotech.co.uk, 2010.
[4] Mashadi, B. and Tajalli, M.R., “Presenting a New Semi-Empirical Formula for Engine Torque”, National Conference on Innovations in Automotive Industry, Sept. 2008, Tehran, Iran. (In Farsi)
[5] Combustion Engine Data, Powerchip group, www.powerchip group.com, 2010
[6] Rill, G., “Road Vehicle Dynamics Fundamentals and Modeling”, 1st ed., Sept. 2011, CRC Press, Taylor and Francis Group, Florida, USA. [7] LabVIEW Help, National Instruments
Corporation, 371361G-10, June 2010.
[8] L S Mecapion Co. Ltd, Servomotor Instruction Manual, ver. 1.1, 1st ed., 01-10-2008.
0 10 20 30 40 50 60 70
-800 -600 -400 -200 0 200 400 600
Time (s)
T
or
que
(
N
m
)
Road Simulator Torque Road Desired Torque
Fig. 15.Desired torque compared to measured produced torque by road side drive