www.ijaer.in Copyright © IJAER 2016, All right reserved Page 1577
THE DEVELOPMENT AND TESTING OF A RAPID ASSESSMENT
METHOD TO PREDICT GLYCEAMIC INDEX
Nicolette Hall, Hettie C. Schonfeldt & Carmen Muller
Department of Animal and Wildlife Sciences, University of Pretoria, Pretoria, South Africa
ABSTRACT
The FAO/WHO Expert Consultation Report (1998) recommended that both the chemical composition and physiological effect of food carbohydrates, including Glycaemic Index (GI), should be considered in guiding healthy food choices. Towards this end a rapid assessment method was developed to aid the food industry during product development, mainly for screening product formulations for GI. The objectives of this study was to determine if the developed rapid assessment method determining the Hydrolysis Index (HI) of a food, could accurately predict the GI of a food, by comparing data with GI results obtained by different laboratories on the same food products. Results from in vivo GI trials on two food products (potatoes and yoghurt), performed at two recognised laboratories in South Africa, were compared with HI results obtained on the same food products through the developed rapid assessment method (in vitro). The results indicated good correlation between HI and GI values. Noteworthy discrepancies were noted in the GI of the potato cultivar as determined by the different laboratories, and recommendations can be made that the current methodologies exercised by the different laboratories, be re-examined.
Keywords: Hydrolysis Index, Glycaemic Index, potatoes, yoghurt, in vivo, in vitro, methodology
INTRODUCTION
www.ijaer.in Copyright © IJAER 2016, All right reserved Page 1578
the food and the nature of the carbohydrate, all influence the extent to which glucose will be released into the blood (Jenkins, et al., 1981). Thus the need arose for a simple indication or index which incorporate all these factors (Laville, 2004).As a result, the glycaemic index (GI) was developed. The GI is an empirical system for classifying carbohydrate-based foods, founded on the degree of glucose release into the blood stream once ingested (Ludwig, 2007). The need is recognised for information to complement food composition data, to enable the control of postprandial glycaemic response (Monro & Shaw, 2008).
The FAO/WHO Expert Consultation Report (1998) recommended that both the chemical composition and physiological effect of food carbohydrates should be considered in guiding healthy food choices. This is because the chemical nature or amount of food components does not completely describe their physiological effect (FAO/WHO, 1998). The use of bioavailability factors and other physiological indexes are being increasingly considered for inclusion in food composition tables and other reference databases. Although some researchers and health professionals question the relevance and practicality or express concerns related to the validity and reliability of data, GI values (reflecting the quality of carbohydrate) in combination with food composition data (reflecting the amount of carbohydrate) seem to be a more useful source of dietary advice than the chemical classification and/or amount of carbohydrates alone (Ludwig, 2007; Foster-Powell, et al., 2002).
Towards this end, 1322 GI values have been published in the Finnish Food Composition Database. The database expressed the GI value, the origin of the value, as well as the methods used to derive it. A further 888 GI values were calculated based on recipe formulas and included in the Finnish Database (Kaatinen, et al., 2010). The Brazilian Network of Food Composition data systems analysed the GI of 41 local foods, using FAO standards, through partnerships with and assistance from universities and local industries (Menezes, et al., 2009). The results were included in the Brazilian Food Composition Database as part of their initiative to reduce the use of carbohydrate values obtained by difference in food composition tables (Greenfield & Southgate, 2003; FAO/WHO, 1998). Instead, they quantify carbohydrate rich foods into fractions of available and unavailable carbohydrate, together with glycaemic response, to
effectively address users’ needs in terms of physiological effects after consumption (Menezes, et
al., 2009).
www.ijaer.in Copyright © IJAER 2016, All right reserved Page 1579
Delport, 2005). The other 260 values were derived from international tables. Since 2005, approximately 70 more foods have been analysed by the GIFSA laboratory each year (Delport, GIFSA, Personal communication, 2010).
Although there is an International Table of Glycemic Index and Glycemic Load Values (Foster-Powell, et al., 2002), there are various limitations to borrowing GI data. Factors influencing food characteristics, such as cultivar and region, or recipe ingredients, can have a significant impact on glycaemic response.
Until recently, the only way to determine the GI of a food was by determining the increment in blood glucose concentration in a human subject (in vivo) after the consumption of a test meal over a set period of time and comparing it with an isoglucosidic control meal (normally white bread or glucose) and expressed as a percentage (Goni, et al., 1997). This is a process which is often considered out of reach for many food companies based on cost and time expenditures, especially during the product formulation phase. An existing alternative to GI analysis is to have theoretical GI calculations done. The overall theoretical GI is calculated by calculating the percentage contribution of the different sources of carbohydrate in the food product, taking into consideration the different GI values of single ingredients. Wolever and Jenkins (1986) reported that such a theoretical method can be used in ranking the relative glycaemic impact of mixed foods (Wolever & Jenkins, 1986). However, its exact clinical utility of controlling postprandial glycaemia still needs to be established. At the GIFSA laboratory, this theoretical service is provided at approximately 10% of the cost of an analytical GI test, just to give an indication of the GI, to aid the food company during product development.
www.ijaer.in Copyright © IJAER 2016, All right reserved Page 1580
food, in comparison to the rate of hydrolysis of maltose as the reference food. The amount of carbohydrates absorbed into the surrounding fluid is then measured by means of infrared spectrophotometry.
As part of the development and testing of this rapid assessment method for the prediction of the glycaemic index (GI) of foods, two food products were selected to undergo both in vivo (GI) analysis at recognised South African laboratories, and in vitro (HI) analysis by means of the developed method (Gibson, et al., 2011). The two food products chosen included a potato cultivar (Solanum Tuberosum L. cultivar Almera) with a potentially low GI, and a specific brand of raspberry and litchi flavoured fat free yoghurt. These products were randomly chosen as food samples to represent both high carbohydrate foods (potatoes), and foods containing a protein and carbohydrate matrix (yoghurt), both without significant amounts of fat. Comparisons were drawn between the results from in vivo analysis (GI), and results from in vitro analysis (HI), to establish
the accuracy of the developed method to predict a food’s GI.
To further explore variations in results obtained by using in vivo methods, the potato cultivar (Solanum Tuberosum L. cultivar Almera) was sent for in vivo analysis to two different GI laboratories in South Africa, on two separate occasions. Comparisons were drawn between the four trials performed at these two local laboratories, and GI results obtained from the Sydney University Glycemic Index Research Service (SUGIRS) in Australia on the same potato cultivar.
The objectives of this study was thus firstly to determine the accuracy of the HI of a food (obtained by the rapid assessment method) to predict the GI of a food, and secondly to compare this data with GI results obtained on two food products, namely a potato cultivar and yoghurt, by different in vivo laboratories.
HYDROLYSIS INDEX
Sampling
Maltose and defrosted white bread were used as control samples during the trial. Samples to represent 2 g carbohydrates (by difference) were weighed for each food, i.e. 2 g maltose and 4.4 g white bread.
www.ijaer.in Copyright © IJAER 2016, All right reserved Page 1581
To determine the GI of any food, the amount of carbohydrate such a food contains needs to be determined. As Almera is a new cultivar on the South African market and no nutritional data are available for this specific cultivar, nutrient analysis of selected nutrients (energy, carbohydrate (by difference), protein, fat, moisture and ash) was done at the ARC-Irene Analytical Services. The laboratory holds SANAS accreditation.16 In Table 1 the nutrient content of Almera potatoes,
as analysed, and the yoghurt, as found on the product label, are presented.
For hydrolysis, one kilogram potatoes were randomly selected from the bag to represent the batch. The potatoes were peeled and cut into blocks after which they were cooked, uncovered, in boiling water on a stove top until soft (internal temperature of 95°C). Three samples of 19.0 g, each containing 2 g of carbohydrate calculated from the nutritional composition obtained by analysis (Table 1), were used for testing. The samples were tested at room temperature, approximately five hours after cooking.
Three 100 ml litchi and raspberry flavoured fat free yoghurts were purchased from retail outlets representing two separate batches (with different batch numbers). Composite samples, weighing 34.0 g, containing 2 g of carbohydrate based on the nutritional composition provided on the product label (Table 1), were used for the analysis.
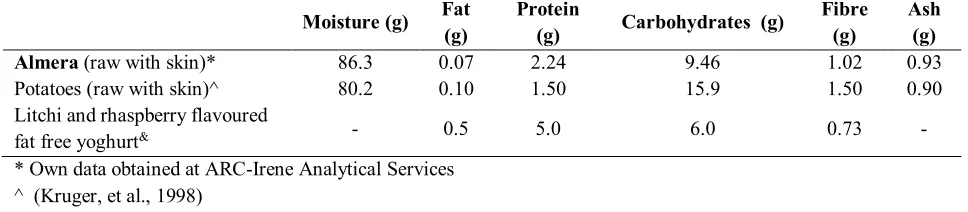
Table 1: The nutritional composition of raw Almera potatoes (g/100g)
Moisture (g) Fat (g)
Protein
(g) Carbohydrates (g)
Fibre (g)
Ash (g)
Almera (raw with skin)* 86.3 0.07 2.24 9.46 1.02 0.93
Potatoes (raw with skin)^ 80.2 0.10 1.50 15.9 1.50 0.90 Litchi and rhaspberry flavoured
fat free yoghurt& - 0.5 5.0 6.0 0.73 -
* Own data obtained at ARC-Irene Analytical Services ^ (Kruger, et al., 1998)
& Obtained from product label
MATERIALS AND PREPARATION
Flat cellulose membrane dialysis tubing, porcine stomach pepsin powder, alpha amylase, and maltose monohydrate were obtained from Sigma-Aldrich, Johannesburg, SA. The ARC-Irene Analytical Services supplied dipotassium phosphate (K2HPO4.3H20, 28.23 mM) and potassium
dihydrogen phosphate (KH2PO4, 136.09 mM) which were used to make up a 0.1 M potassium
phosphate buffer solution (pH 6.9); orthophosphoric acid (H3PO4); hydrochloric acid (HCl, 0.2
www.ijaer.in Copyright © IJAER 2016, All right reserved Page 1582
The equipment used during the method belonged to the ARC-Irene Analytical Services, and included an Ultra Turrax, shaking water bath, single channel pipettes, Erlenmeyer flasks, volumetric flasks, volumetric cylinders, glass beakers, glass bottles with lids and the various funnels required.
To prepare the pepsin enzyme solution, 2.5 g of the porcine pepsin powder were dissolved in 10 ml HCl.KCl (0.2 M0) buffer. As alpha amylase is heat sensitive, the amylase solution was kept in the refrigerator at a temperature below 4°C until just before adding to the samples. A quantity of 31 μl was administered to each sample.
METHODOLOGY
A sample of each food (as eaten), containing 2 g of carbohydrate, was sliced, ground and placed in an Erlenmeyer flask with 20 ml of a buffer solution at 37°C. The samples were further homogenized with an Ultra Turrax at 13 500 rpm until liquid or for a maximum time of two minutes. The Ultra Turrax was rinsed with an additional 20 ml buffer solution to ensure that most of the carbohydrates remained in the sample.
To simulate the gastric phase, the pH of each sample was decreased to pH 2.5 with 5 % orthophosphoric acid, after which 2 ml of the pepsin enzyme solution was added. The samples were swirled. All the samples were placed in a 37 °C shaking water bath for one hour to simulate the time that food would be churned in the human stomach.
After the gastric phase, each sample was buffered back to pH 6.9 ± 0.2 with 50 % KOH. Alpha amylase solution (2 ml) was added to each sample and swirled to distribute the enzyme throughout the sample. The content of each flask was then transferred into a dialysis tube, 20 to 30 cm in length. The tube was closed and placed in flasks containing 500 ml buffer solution. The flasks were placed in the stirring water bath and 40 ml of the buffer solution was extracted every 30 minutes to determine the rate of hydrolysis of carbohydrate from the dialysis tube into the buffer solution.
Reduced sugars were determined using Infra-red spectrophotometry (Milkoscan). All the experimental work was performed at the ARC-Irene Analytical Services, South Africa.
www.ijaer.in Copyright © IJAER 2016, All right reserved Page 1583 RESULTS AND DISCUSSION
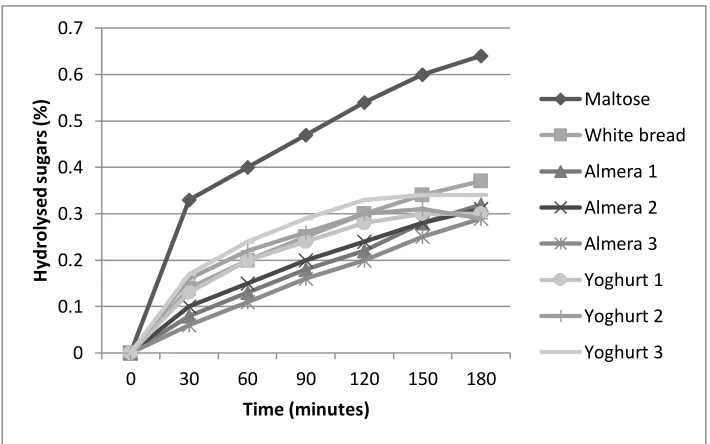
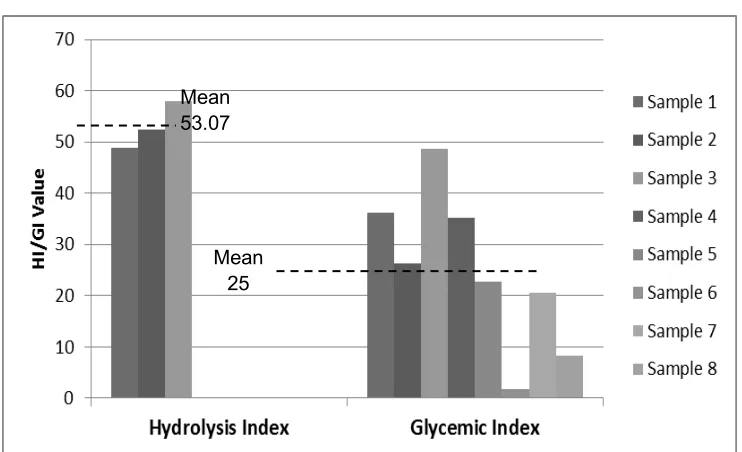
The amount of carbohydrates which diffused through the dialysis tube of each sample into the surrounding fluid was tabulated and graphically presented as concentration-over-time curves (Figure 1). From these curves, the mean areas under the concentration-over-time curves for each tested food product were determined. The HI values were calculated as the relation between the AUC of the specific food compared to the AUC of maltose as the reference food, using the calculation indicated previously.
Figure 1: The concentration-over-time curves used for the determination of the area under the curve (AUC) of each sample tested
In Table 2 the AUC and calculated HI values are presented. White bread had a HI value of 53.0, Almera potatoes had a mean HI value of 38.8, while the yoghurt had a mean HI value of 53.0. The low HI value for white bread found could be attributed to the fact that the same bread was used for testing throughout the experimental period of twelve months, during which slices of bread were kept frozen until used for testing. Normally, frozen bread is used when white bread is used as a reference food (Wolever, 2011: Personal Communication). However, a study found that prolonged freezing decreased the glycaemic response of white bread (Burton & Lightowler, 2008). Within this research project maltose was used as the reference food and white bread was included in each trial to determine repeatability. In previous tests, performed within 3 months after freezing, the average HI of seven white bread samples tested were found to be 67.0 (Gibson, et al., 2011).
0 0.1 0.2 0.3 0.4 0.5 0.6 0.7
0 30 60 90 120 150 180
www.ijaer.in Copyright © IJAER 2016, All right reserved Page 1584 Table 2: Area under the concentration-over-time curve (AUC) and hydrolysis index (HI)
values of the maltose, white bread, Almera potatoes and yoghurt
Area under the concentration-over-time
curve (AUC$) Hydrolysis index (HI)^
Maltose 79.8 100
White bread 42.5 53.0
Almera potato Mean 31.0 38.8
SD - 3.81
95 % CI (lower) - 35.0
95 % CI (higher) - 43.2
Sample 1 31.5 39.0
Sample 2 33.8 42.0
Sample 3 27.8 35.0
Yoghurt Mean 42.4 53.0
SD - 4.55
95 % CI (lower) - 48.5
95 % CI (higher) - 57.6
Sample 1 39.0 49.0
Sample 2 41.9 52.0
Sample 3 46.2 58.0
$AUC determined by geometric calculation by applying the trapezoid rule
^HI calculated as the AUC of food tested expressed as a percentage of the AUC of maltose
GLYCAEMIC INDEX
Two food products, namely yoghurt and a potato cultivar, were used to measure GI in vivo. The GI of the litchi and raspberry yoghurt was determined at one recognized South African laboratory on one occasion. The GI of the Almera potato cultivar was tested at two different recognized South African laboratories on two separate occasions each. The GI of yoghurt is presented first, followed by the results on Almera potatoes obtained from the different laboratories.
Glyceamic Index of yoghurt
Materials and methods
www.ijaer.in Copyright © IJAER 2016, All right reserved Page 1585
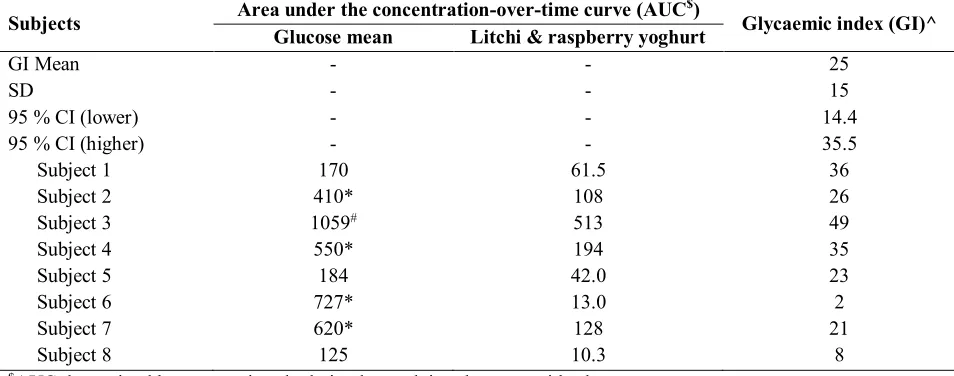
A standard food portion was calculated using the nutritional analyses which were supplied to the laboratory by the supplier (Table 1). An amount of 847.5 g yoghurt was determined to present 50 g glycaemic carbohydrate. Ten subjects were required to consume the full portion, as is, within a period of 15 minutes. Of the eight subjects that took part in the trial, four had non-insulin dependent diabetes mellitus (NIDDM) and one had insulin-dependent diabetes mellitus (IDDM). Blood glucose readings were taken fasting and every 15 minutes starting immediately after ingestion, until two blood glucose readings fell on or below the initial reading, or for a maximum total time of 120 minutes (healthy subjects) or 180 minutes (diabetic subjects), according to international protocol. Delport (2006) compared GI values on five food products in a group of healthy volunteers taking their blood glucose readings over two hours, to a group of healthy and diabetic subjects, until two readings were on or below baseline. No significant difference was found between the two groups (Delport, 2006). The results from the subjects were used to determine the GI of the product by using the formula: GI = ([AUC of the test food ÷ AUC of the subjects’ reference glucose value] X 100). Results and discussion
Table 3 presents the AUC and the mean GI values of each panel member, together with the SD. The CI indicates that the researcher can be 95 % confident that the GI of the specific product will lie between the bottom and the top values presented i.e. for litchi and raspberry flavoured yoghurt between 14.4 and 35.5. The mean GI value of litchi and raspberry flavoured yoghurt was 25 which classify this product as a low GI food (GI < 55). The SD was 15, which according to the analytical report was adequate to consider the results as trustworthy.
Table 3: Area under the concentration-over-time curve (AUC) and glycaemic index (GI) values of litchi and raspberry flavoured yoghurt
Subjects Area under the concentration-over-time curve (AUC
$)
Glycaemic index (GI)^ Glucose mean Litchi & raspberry yoghurt
GI Mean - - 25
SD - - 15
95 % CI (lower) - - 14.4
95 % CI (higher) - - 35.5
Subject 1 170 61.5 36
Subject 2 410* 108 26
Subject 3 1059# 513 49
Subject 4 550* 194 35
Subject 5 184 42.0 23
Subject 6 727* 13.0 2
Subject 7 620* 128 21
Subject 8 125 10.3 8
$AUC determined by geometric calculation by applying the trapezoid rule
www.ijaer.in Copyright © IJAER 2016, All right reserved Page 1586
*Non-insulin-dependent diabetes mellitus (NIDDM) #Insulin-dependent diabetes mellitus (IDDM)
Glycemic Index of Almera potatoes
Almera potatoes were determined at two laboratories, and each laboratory performed the analysis on two separate occasions. Laboratory A, performed the analysis at two different locations. During the first trial (Laboratory A, Trial 1), the potatoes were cooled before consumption similar to the methodology followed when performing HI analysis. During the second trial (Laboratory A, Trial 2), the potatoes were consumed warm. Laboratory B performed both tests on warm samples, but used different panel members in the second trial (Laboratory B, Trial 2), than in the first trial (Laboratory B, Trial 1).
Laboratory A
Materials and methods
Laboratory A conducted the trials on Almera potatoes according to international protocol (as recommended by an International Expert Consultation on Carbohydrates in Human Nutrition (FAO/WHO, 1998), the recommendations of the International Life Sciences Institute (ILSI) appointed International Committee for the Standardization of GI Testing Methodology and the draft regulations of the South African Department of Health pertaining to GI testing methodology (Brouns, et al., 2005). Ethical approval was obtained from the Faculty of Health Sciences Research Ethics Committee (University of Pretoria) (Ethics number: 8/2006) and all subjects signed informed consent.
During Trial 1, ten pre-screened panellists, and during Trial 2, eleven trained, healthy volunteers took part in Trial 2. In Trial 1, the subjects who partook in the trial included seven healthy subjects and three subjects with NIDDM). During Trial 2 no subjects with NIDDM took part in the trial. Subjects took a fasting blood glucose reading as well as a second reading as a control, the mean of which was used in the calculations, according to ISO(International organization for Standardization, 2008).
www.ijaer.in Copyright © IJAER 2016, All right reserved Page 1587
Potatoes were peeled, weighed and cubed into 50 to 60 mm cubes. These cubes were cooked in salted water until done (approximately 15 minutes). In both trials, each panellist received 528.5 g cooked potatoes, representing 50 g carbohydrates, which each panellist divided into ten portions and consumed within 10 to 15 minutes together with 250 ml water (Brouns, et al., 2005). In Trial 1 the potatoes were cooled overnight, and reheated before consumption the next morning. In Trial 2, the samples were consumed after cooking while still hot, by each individual within a time frame of 15 minutes. A drink of water, rooibos tea or decaffeinated coffee (250 – 500 ml) was allowed to be consumed together with the food portion.
Blood glucose readings were taken fasting and every 15 minutes, starting immediately after ingestion, until two blood glucose readings fell on or below the initial reading, or for a maximum total time of 120 minutes (healthy subjects) or 180 minutes (diabetic subjects). The results from the subjects were used to determine the GI of the product by using the formula: GI = [(AUC of
the test food ÷ AUC of the subjects’ reference glucose value) X 100].
Results
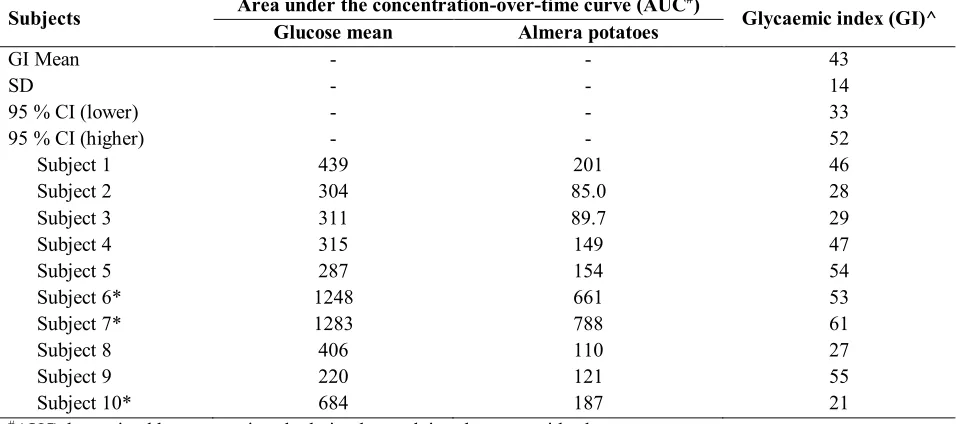
www.ijaer.in Copyright © IJAER 2016, All right reserved Page 1588 Table 4: Area under the concentration-over-time curve (AUC) and glycaemic index (GI)
values of Almera potatoes as determined by Laboratory A, Trial 1
Subjects Area under the concentration-over-time curve (AUC
#)
Glycaemic index (GI)^
Glucose mean Almera potatoes
GI Mean - - 43
SD - - 14
95 % CI (lower) - - 33
95 % CI (higher) - - 52
Subject 1 439 201 46
Subject 2 304 85.0 28
Subject 3 311 89.7 29
Subject 4 315 149 47
Subject 5 287 154 54
Subject 6* 1248 661 53
Subject 7* 1283 788 61
Subject 8 406 110 27
Subject 9 220 121 55
Subject 10* 684 187 21
#AUC determined by geometric calculation by applying the trapezoid rule
^GI calculated as the AUC of Almera expressed as a percentage of the AUC of glucose *Non-Insulin Dependent Diabetes Mellitus (NIDDM)
www.ijaer.in Copyright © IJAER 2016, All right reserved Page 1589 Table 5: Area under the concentration-over-time curve (AUC) and glycaemic index (GI) values of the Almera potato cultivar obtained with eleven healthy volunteers at Laboratory
A, Trial 2
Subjects Area under the concentration-over-time curve (AUC*) Glycaemic index (GI)^
Glucose mean Almera potatoes
GI Mean - - 63
SD - - 18
95 % CI (lower) - - 50
95 % CI (higher) - - 76
Subject 1 316 160 51
Subject 2 244 197 81
Subject 3 179 152 85
Subject 4 173 105 61
Subject 5 296 254 86
Subject 6 265 118 45
Subject 7 220 77.3 35
Subject 8 252 115 46
Subject 9 321 205 64
Subject 10 356 272 76
*AUC determined by geometric calculation by applying the trapezoid rule
^GI calculated as the AUC of Almera expressed as a percentage of the AUC of glucose
Laboratory B
Materials and methods
The methodology followed was approved by the Committee for Human Research of the University of Stellenbosch. During the first trial 13 healthy volunteers, and during the second trial 14 healthy volunteers, participated in the tests.
The potatoes were cultivated under controlled conditions, harvested when the tubers reached medium size, couriered to the laboratory within three days after harvest, and stored in a cool, dry place until needed. On the day of testing the products were peeled and cubed into squares of approximately 20 X 30 mm. These cubes were boiled until soft (approximately 20 minutes) and a portion to represent 25 g glycaemic carbohydrate (264 g) was weighed for each panellist during both trials. The samples were consumed by the volunteers and blood glucose was measured every 15 minutes for the first 60 minutes, and every 30 minutes for a second 60 minutes, adding up to a total period of two hours.
www.ijaer.in Copyright © IJAER 2016, All right reserved Page 1590
The areas under the concentration-over-time curves from the first trial were used to calculate the AUC values. Using the AUC values to determine GI, the results from the first trial indicated that the mean GI value was 84 (SD 21) (Table 6), which indicated that the product falls within the high GI category. These results are in direct contrast to the results obtained at Laboratory A, which found in Trial 1 that the cooled Almera potato cultivar falls within the low GI category and in Trial 2 that the warm Almera potato cultivar falls within the intermediate GI category. Statistically there were no outliers identified within the group of volunteers, but it was recommended that the test be repeated by a new group of volunteers because the results differed so significantly from the results obtained from Laboratory A.
During the second trial, 14 healthy volunteers ingested 264 g of cooked Almera potatoes to represent 25 g glycaemic carbohydrate. The mean GI for the second evaluation was even higher, namely 96 (SD 21) (Table 7), which is higher than white bread and close to the GI for glucose (the reference food). The recognised mean GI for baked potatoes as presented in the South African Glycemic Index and Load Guide is 85 (Steenkamp & Delport, 2005). It should be noted that during the trial candidates were not prompted to halt blood glucose withdrawal once two values equal to or lower than the fasting glucose value was obtained and all participants continued the trial for a total period of two hours.
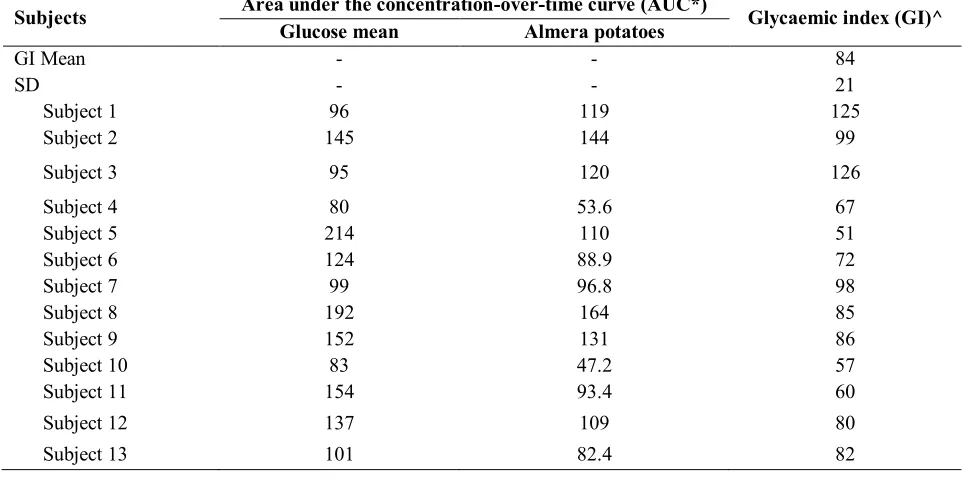
Table 6: Area under the concentration-over-time curve (AUC) and glycaemic index (GI) values of the Almera potato cultivar obtained from 13 healthy volunteers at Laboratory 2,
Trial 1
Subjects Area under the concentration-over-time curve (AUC*) Glycaemic index (GI)^
Glucose mean Almera potatoes
GI Mean - - 84
SD - - 21
Subject 1 96 119 125
Subject 2 145 144 99
Subject 3 95 120 126
Subject 4 80 53.6 67
Subject 5 214 110 51
Subject 6 124 88.9 72
Subject 7 99 96.8 98
Subject 8 192 164 85
Subject 9 152 131 86
Subject 10 83 47.2 57
Subject 11 154 93.4 60
Subject 12 137 109 80
www.ijaer.in Copyright © IJAER 2016, All right reserved Page 1591
*AUC determined by geometric calculation by applying the trapezoid rule
^GI calculated as the AUC of Almera expressed as a percentage of the AUC of glucose
Table 7: Area under the concentration-over-time curve (AUC) and glycaemic index (GI) values of the Almera potato cultivar obtained from 14 healthy volunteers at Laboratory 2,
Trial 2
Subjects Area under the concentration-over-time curve (AUC*) Glycaemic index (GI)^
Glucose mean Almera potatoes
GI Mean - - 96
SD - - 21
Subject 1 163 161 98
Subject 2 146 176 121
Subject 3 74 96 130
Subject 4 97 72.9 75
Subject 5 89 69 77
Subject 6 142 140 98
Subject 7 142 137 97
Subject 8 121 95.3 79
Subject 9 83 114 137
Subject 10 110 80.5 74
Subject 11 158 131 83
Subject 12 105 91.6 87
Subject 13 105 94.1 90
Subject 14 93 65 70
*AUC determined by geometric calculation by applying the trapezoid rule
^GI calculated as the AUC of Almera expressed as a percentage of the AUC of glucose
COMPARING GLYCAEMIC INDEX WITH HYDROLYSIS INDEX
www.ijaer.in Copyright © IJAER 2016, All right reserved Page 1592
The HI value of cooled Almera potatoes (38.8 ± 9.47) predicts that this potato cultivar falls within the low GI range of equal to or less than 55. This was in line with results found with in vivo GI analysis which was conducted at Laboratory A, Trial 1, which was done on the same batch of potatoes using similar preparatory methods (GI 43 ± 9.6).
The HI value of litchi and raspberry flavoured fat free yoghurt (53.0±11.3) predicted that the yoghurt would fall within the low GI range. The in vivo GI analysis, conducted on a different batch five years prior to the HI trial, indicated the GI value of the yoghurt to be 25 ± 10.6, indicating a low GI with a relatively large CI (range between 14.4 and 35.5). Protein in the yoghurt, which also cause insulin release in human subjects, could explain this difference in measurement, indicating that the HI method may be less sensitive to a starch-protein food matrix.
Table 8: Correlating calculated hydrolysis index (HI) values with obtained in vivo
glycaemic index (GI) values
Hydrolysis index (HI) Glycaemic index (GI)
HI SD 95 % CI (lower) 95 % CI (higher) GI SD 95 % CI (lower) 95 % CI (higher)
Almera potatoes 38.8 3.81 29.4 48.3 43 14 33 52.4
Yoghurt 53.1 4.55 41.8 64.4 25 15 14.4 35.5
*Obtained from the South African Glycemic Index and Load Guide (Steenkamp & Delport, 2005)
www.ijaer.in Copyright © IJAER 2016, All right reserved Page 1593 Figure 2: Individual hydrolysis index (HI) values and glycaemic index (GI) values for
Almera potatoes to visualise variation in results
Figure 3: Individual hydrolysis index (HI) values and glycaemic index (GI) values for litchi and raspberry flavoured yoghurt to visualise variation in results
Mean 53.07
Mean 25 Mean 38.84
www.ijaer.in Copyright © IJAER 2016, All right reserved Page 1594 Figure 3: Individual hydrolysis index (HI) values and glycaemic index (GI) values for litchi
and raspberry flavoured yoghurt to visualise variation in results
COMPARISON OF THE GLYCAEMIC INDEX OF ALMERA POTATOES BY DIFFERENT LABORATORIES
As significant differences were observed between the GI results obtained with Almera potatoes between the different laboratories in South Africa, it was decided to compare these results with international values and investigate the possible reasons for discrepancies.
The Sydney University Glycemic Index Research Service (SUGIRS) was established in 1995 to provide a commercial GI testing laboratory for the international food industry. The standard protocol at the laboratory involves feeding ten or more healthy volunteers a portion of test food containing 50 g glycaemic carbohydrate, and measuring the effect on blood glucose concentration over a period of two hours. Each person, at another stage, consumes a standard glucose portion containing 50 g glucose and the response of blood glucose concentration is also measured. A GI value for the test food is calculated, as in the South African laboratories, by
dividing each individual’s blood glucose AUC of the test food by their average blood glucose
AUC of the reference food. The final GI value is then calculated as the mean GI for all participants that took part in the trial.
Mean 53.07
www.ijaer.in Copyright © IJAER 2016, All right reserved Page 1595
According to Dr Alan Barkley of SUGIRS, their laboratory tested the GI of the Almera potato cultivar on eight different occasions. The results from these trials varied from 40 to 69, with a mean GI value of 55. For each test, the potatoes used for the samples were grown under slightly
different conditions. In Dr Barkley’s opinion the Almera cultivar, when grown under the correct
conditions and cooked appropriately, would have a low GI (Barkley, SUGIRS, Personal communication, 2010).
It can be clearly seen that the GI values from Laboratory B were significantly greater than the values obtained from Laboratory A and SUGIRS (Figure 4). The data obtained in the second trial at Laboratory A also produced results which were similar to the result published on the electronic database of the Australian GI website (Glycemic Index, 2010). The glycaemic value obtained from the rapid assessment method on the cooled samples (HI 40), is similar to the results obtained on the cooled samples at Laboratory A (GI 43) (Trial 1).
*A food with a glycaemic index value greater than or equal to 70 is considered to have a high GI, lower than or equal to 55 is considered to have a low GI, and a value between 70 and 55 (or from 56 – 69) is classified as an Intermediate GI food.
Figure 4: GI values for cooked Almera potatoes obtained 43
63
84
96
55
65
40
0 20 40 60 80 100 120
G
lyc
ae
m
ic
V
al
u
e
www.ijaer.in Copyright © IJAER 2016, All right reserved Page 1596
Various factors influence the GI of a food product including product characteristics such as cultivar, growing conditions, preparation method, etc. Furthermore, the method used to determine GI could also impact significantly on the GI reading which is obtained.
Inter- and intra-individual variability
Firstly it is essential to note that human subjects vary, however, this is taken into consideration as the effect of the food on blood glucose values is compared to the effect of a reference food, e.g. glucose or white bread on blood glucose values in the same individual. Secondly, many factors, including emotional and stress factors, which cannot be controlled, may also play a significant role in influencing glycaemic response (Cummings & Stephan, 2007; Delport, 2006). It thus becomes important to ensure that the person is subject to the same conditions when performing the reference test (i.e. glucose), than when testing a specific food.
Concerning subject variability, a study conducted to determine the inter-individual and intra-individual variability of GI values of white bread found a high degree of variation both between individuals (CV = 94 %), and within individuals over a period of time (CV = 17.8 %, with a 42.8 % variability) (Vega-Lopez, et al., 2006). Wolever found a significant coefficient of variation (CV) (25 %) in glucose response within individuals forming part of an eleven member panel on eight separate occasions (Wolever, et al., 1985). Another study evaluated the intra-individual reproducibility (within the same individual, when repeatedly measured) and inter-individual variability (among individuals) of GI value determinations for white bread relative to glucose in 56 volunteers who differed by sex, age (18 to 85 y) and body mass index (BMI) (18.5 to 24.9, 25 to 29.9, 30 to 35 kg/m2). Each volunteer underwent three sets of food challenges in random
order, after abstaining from strenuous physical activity and alcohol intake for at least 72 hours prior to each session. Each set involved ingestion of glucose and white bread (each containing 50 g available carbohydrate). An intra-individual CV range from 2 to 77 % and an inter-individual CV of 25 % were found. An association was observed between the GI value for white bread and age (r=0.30, p=0.028), but not for sex (63 ± 15 vs. 63 ± 18; males vs. females, p=0.96) or BMI (67 ± 18, 62 ± 14 and 58 ± 15 for BMI categories 18.5 to 24.9, 25 to 29.9 and 30 to 35, respectively, p=0.17) (Matthan, et al., 2010). These high CV values within subjects suggest that no one individual can be expected to give accurate glycaemic values at all occasions.
www.ijaer.in Copyright © IJAER 2016, All right reserved Page 1597
Earlier work by Coulston noted that by expressing glycaemic response of a test food as a comparison of the response to a reference food, the variation in GI that occurs for age, sex, body composition, ethnicity and medical conditions should be accounted for (Coulston, et al., 1984). Similarly Jenkins found that by expressing glycaemic results this way reduced inter-individual CV from 40 % to 10 %(Jenkins, et al., 1981).
Although expressing values as a percentage compared to response to a control food reduced inter-individual variation, the GI measurements of the same food have been seen to vary greatly between individuals. Although GI was calculated as stated above, the study by Matthan indicates that variability in GI values can still in part be explained by differences in age (Matthan, et al., 2010). Another study by Hollenbeck found that the GI values of lentils range between 23 and 70 for different subjects (Hollenbeck, et al., 1986). It is furthermore suggested that this variation in results obtained between individuals can be reduced when both the food to be tested and the control food are measured in triplicate by each panellist (Frost & Dornhurst, 2000; Wolever, et al., 1987). However, this is not done in practise, as the costs involved would be exponential.
In this study, as a high degree of variation was observed between individuals within the initial GI test at Laboratory B (SD > 20), it was prudently decided to repeat the analysis in both laboratories. However, including an additional 14 individuals in the second Laboratory 2 trial did not alter the GI of the test food in such a way as to change the GI category into which the food would be classified (Table 6 & Table 7).
During Laboratory A, trial 1, three NIDDM subjects were included in the test group. According to the ISO 26642 standard(International organization for Standardization, 2008), implemented in October 2010, only healthy subjects should be included in trials. Delport found that using a mixed group of subjects, including diabetic and non-diabetic individuals, did not result in greater variation in results, and less variability was found when using this mixed group (Delport, 2006). However, during trail 2, and since the acceptance of the ISO 26642 standard, Laboratory A has used only non-diabetic subjects for analyses. Laboratory B used only healthy subjects with
BMI’s ranging from normal to obese. No data was available on the individuals included in the
trials performed by the SUGIRS. Both laboratories each recruited a total of more than 20 individuals to determine the GI of the Almera cultivars, yet the GI results remained significantly different between the two laboratories. It is therefore possible that differences in methodologies used by the different laboratories may have resulted in the significant variation in the results.
www.ijaer.in Copyright © IJAER 2016, All right reserved Page 1598
Differences often exist between the methodologies used in different laboratories, e.g. size of the carbohydrate load, reference food, time of follow-up food, etc. Although it is believed that many of these differences do not influence the results significantly, it is important to emphasize that test subjects should be able to control lifestyle-confounding factors, in order to increase reliability and repeatability of test results. Clear guidelines to test subjects should be provided and adhered to, on when to participate or refrain from participation (Delport, 2006).
Number of subjects
According to the FAO/WHO Expert Consultation Report on Carbohydrates in Human Nutrition (1998) no less than seven subjects should be used in any one GI trial. Subjects should be studied on separated days in the morning after a ten to twelve hour fast. A standard drink of water, tea or coffee is allowed with each test meal (FAO/WHO, 1998).The ISO 26642 standard recommends that no less than ten subjects be included in each trial. In both laboratories more than ten subjects were included during each trial and a total number of more than 20 individuals volunteered and successfully completed the in vivo GI testing in each of the laboratories.
Amount of test food
The amount of test food administered should not affect GI tests, as long as the reference food is measured on the same food portion. Testing requires that both the reference food and test food contain the same amount of glycaemic carbohydrate, i.e. either 25g or 50g. According to the FAO/WHO Expert Consultation Report, the test portion should contain 50 g glycaemic (available) carbohydrate, while the ISO 26642 states that both 25 g or 50 g samples can be used, provided that the reference food dose corresponds to the amount of test food administered, especially if the portion of food to be tested is large, as was the case with the Almera potatoes.
One of the main differences of the methodology used by Laboratory A and Laboratory B was the amount of test sample included in each trial. Laboratory A included a test food sample representing 50 g glycaemic carbohydrate (528.5 g), whereas Laboratory B included a test food samples representing 25 g glycaemic carbohydrate (264 g) because a sample exceeding 500g was considered excessive for consumption. According to the ISO 26642, this should not have had an effect on GI, however, the time during which the reference food is consumed, vs. the time during which the test food is consumed, should be kept constant at between 12 to 15 minutes (International organization for Standardization, 2008).
www.ijaer.in Copyright © IJAER 2016, All right reserved Page 1599
carbohydrate had on postprandial glucose (Wolever & Bolognesi, 1996). They determined the effect which samples containing 0, 25, 50, 75 or 100 g glyceamic carbohydrate would have on blood glucose. Through regression analysis they found that the amount of carbohydrate administered was responsible for 47 to 57 % of the variation in the results. As mentioned,
calculating a food’s GI in terms of a comparison of the test food’s response to that of a control
food decreases the possible variability which the decrease in portion size could have. It is recommended that the possible effect which different portion sizes could have had on glycaemic response be further investigated.
Another possible difference between GI of the potatoes between Laboratory A and Laboratory B could be the size to which the potato samples were cut prior to boiling, as well as the duration of cooking. As there is no constant guideline for the cooking of potatoes, as with various other foods, this needs to be considered when determining GI of the cooked product.
Carbohydrate determination
According to Foster-Powell one of the main reasons why GI values for similar foods often vary is because of the method used for determining the carbohydrate content of the test foods. Composition tables are often used for determining the carbohydrate content of the test food portion, as opposed to direct analytical measurement of glycaemic carbohydrate (Foster-Powell, et al., 2002). All GI test portions, according to ISO 26642, need to be calculated on glycaemic carbohydrate content, and not on carbohydrates by difference, which was used in the past. The glycaemic carbohydrate should not include resistant starch. Although nutritional data were analysed and used to calculate the sample size of the test foods (and could thus not have caused the variation in results), carbohydrate by difference were used to calculate the glycaemic carbohydrate value. In future, as recommended by the ISO 26642, it will be considered compulsory to have a laboratory analytically determine total individual glycaemic carbohydrates (starches and sugars).
Reference food
www.ijaer.in Copyright © IJAER 2016, All right reserved Page 1600
need to be consumed over a time period of 12 to 15 minutes. Special care thus needs to be taken to ensure this in the case of glucose (which is usually dissolved in water) as the reference food, which might be easier to consume within two to five minutes, compared to a few slices of white bread, which naturally takes about 12 to 15 minutes to consume.
Previous meal and consumption time
The glycaemic response to the same food or meal may be influenced by the time, composition and GI of the previous meal (Arvidsson-Lenner, et al., 2004). Studies have shown that consuming a low GI food with a prolonged glycaemic response for breakfast results in improved glucose tolerance at lunch time. A similar tendency is seen with breakfast after a low GI supper
the night before. This effect has been termed the “second meal effect” (Wolever, et al., 1988). A
possible explanation of this effect might be that some low GI foods produce prolonged insulin responses, and provide sustained insulin levels during the next meal. Also the colonic fermentation of dietary fibre (decreasing the GI of a food), results in elevated short chain fatty acid serum levels. This in turn reduces serum-free fatty acid levels and glucose output from the liver (Arvidsson-Lenner, et al., 2004).
According to the test report of laboratory A, individuals received two information sheets containing information related to the code of conduct required to eliminate possible variations. All subjects were required to consume one of three prescribed pre-test meals on the evening before the tests as recommended by the draft regulations of the South African Department of Health pertaining to GI testing methodology. or a standard, balanced meal (International organization for Standardization, 2008). All individuals also recorded the specific meal consumed the previous night on the test form. No specifications regarding the meal which individuals in the test groups from Laboratory B consumed are stated in the reports. Further information was requested, however, no feedback was received.
www.ijaer.in Copyright © IJAER 2016, All right reserved Page 1601
The ISO 26642 states that subjects should consume the food portion in a period of 12 to 15 minutes, and consume a drink of one or two cups water, coffee or tea (sweetened with non-nutritive sweetener) in this same period. Laboratory A reported that participants consumed the samples within a 12 to 15 minute time frame and were allowed to consume one cup (250 ml) of water, black rooibos tea or black decaffeinated coffee (sweetened with artificial sweetener if desired). Furthermore, all subjects are required to rest during testing. Laboratory A reported that participants were required to refrain from physical activity and not smoke during the duration of the test. No specifications were reported in the test report from Laboratory B, however, as previously stated, they did note that they adhere to the recommendations of the ISO26642 standard (International organization for Standardization, 2008).
Analysis procedure and blood sampling
Blood glucose response is normally measured by drawing capillary whole blood, however in some cases venous blood is also drawn. An inter-laboratory trial involving seven experienced GI laboratories found that the five laboratories that used finger prick capillary blood sampling obtained similar GI values, with less inter-individual variation. Possibly the reason for this is that after food ingestion the glucose concentrations change to a greater degree in capillary blood than in venous blood, and could thus also be a more accurate reflector of glycaemic response after consumption of high GI foods (Wolever, et al., 2003; Foster-Powell, et al., 2002). Capillary blood is also preferred in the FAO/WHO Expert Consultation Report as it is easier to obtain and the rise in blood glucose is greater and less variable than in samples drawn from venous blood (FAO/WHO, 1998).
During the trials performed at both laboratories capillary blood was drawn. At Laboratory A, Trial 1, analysis ceased as soon as two blood glucose readings dropped to on or below the fasting level, but not longer than 2h in healthy subjects and not longer than 3h in diabetic subjects. Laboratory A, Trail 2, and laboratory B continued testing for a total period of two hours.
Methods used to calculate glycaemic index
www.ijaer.in Copyright © IJAER 2016, All right reserved Page 1602
In the method proposed by the FAO/WHO and ISO 26642 the net AUC over the baseline value at zero time is determined by adding positive trapezoids, in most cases ignoring the area beneath the fasting concentration baseline (when blood glucose falls below the baseline, only the area above the baseline is used in the calculations). Laboratory A indicated that they used the calculation recommended in the ISO 26642, and Laboratory B only stated that the international protocol was followed in the test reports supplied. Additional information requested from laboratory B was not made available at the time of submission of this thesis (International organization for Standardization, 2008; FAO/WHO, 1998).
CONCLUSIONS
The results from the rapid assessment method classified the Almera cultivar in the same category (low GI) as the first Laboratory A trial results (low GI), which used the same batch of potatoes and where samples were evaluated after cooking and cooling overnight, prior to consumption. The rapid assessment method results for the yoghurt also classified it within the same category (low GI), in a similar fashion to the results found by Laboratory A. These results provide persuasive evidence that the rapid assessment method can to a certain degree predict the GI of food products. Future testing of the accuracy of the rapid assessment method to predict GI of food products with a more complex food matrix (containing protein and carbohydrate) is recommended, as well as using fresh rather than frozen white bread, or at least not white bread that had been frozen for longer than 3 months.
Significant differences were found between the GI values and more specifically, GI categories (low, intermediate and high GI), obtained from the different laboratories executing in vivo analysis on the Almera potato cultivar. The laboratories indicated that they used the same methodology recommended in the ISO 26642.
RECOMMENDATIONS
www.ijaer.in Copyright © IJAER 2016, All right reserved Page 1603
Based on the high variability between the in vivo laboratories in South Africa determining the GI of the Almera potatoes, a workshop is proposed to align methodology, not only to comply with the ISO 26642, but also to eliminate additional seemingly negligible differences which might have caused the disparities, e.g. consumption time of the reference foods and sample preparation. In 2002, the Directorate of Food Control assembled a South African GI task force to standardise the GI methodology used in South Africa, so as to pave the way for GI labelling and consumer education. It is strongly recommended that this or similar task force be reassembled to discuss and examine the validity of the current methods used by the different laboratories in South Africa.
ACKNOWLEDGEMENTS
Sincere gratitude to Mrs Liesbet Delport from the Glycemic Index Foundation of South African (GIFSA), Mr Lourens van der Merwe and Fresh Produce Distributors, Ms Maryke van Zyl at Woolworths, Mr Frik Grobler and Ms Carien Jacobs at Dairy Gold SA (Pty) Ltd, Dr Beulah Pretorius from ARC-Irene Analytical Services and Ms Marie Smith for statistical analysis.
REFERENCES
Alldrick, A., 2006. Campden and Chorleywood Food Research Assocaition (CCFRA). [Online] Available at: http://www.campden.co.uk [Accessed 30 June 2007].
AOAC, 2000. Official method of analysis., (17th edition) Volume 1, Maryland, USA: Association of Official Analytical Chemists, Inc..
Arvidsson-Lenner, R. et al., 2004. Glycaemic Index – Relevance for health, dietary recommendations and food labelling. Scandinavian Journal of Nutrition, 48(2), pp. 84-94.
Brouns, F. et al., 2005. Glycemic Index Methodology. Nutrition Research, Volume 18, pp. 145-171.
Burton, P. & Lightowler, H. J., 2008. The impact of freezing and toasting on the glycaemic response of white bread. European Journal of Clinical Nutrition, 62(5), pp. 584-499.
Conn, J. W. & Newburgh, L. N., 1939. The glyceamic response to isoglucogenic quantities of protein and carbohydrate. Journal of Clinical Investigation, Volume 15, pp. 665-671.
www.ijaer.in Copyright © IJAER 2016, All right reserved Page 1604
with non-insulin dependent diabetes mellitus. American Journal of Clinical Nutrition, Volume 9, pp. 641-647.
Cummings, J. H. & Stephan, A. M., 2007. Carbohydrate terminology and classification. European Journal of Clinical Nutrition, 61(S1), pp. 5-18.
Delport, E., 2006. A comparison of the GI results obtained from two techniques on a group of healthy and a group of mixed subjects. Pretoria: University of Pretoria.
FAO/WHO, 1998. Carbohydrates in Human Nutrition, Rome: FAO.
Foster-Powell, K., Holt, S. A. & Brand-Miller, C., 2002. International table of glycemic index and glycemic load values:2002. American Journal of Clinical Nutrition, Volume 76, pp. 5-56. Frost, G. & Dornhurst, A., 2000. The relevance of the glycaemic index to our understanding of dietary carbohydrates. Diabetes Medical Journal, Volume 17, pp. 336-345.
Gibson, N., Schonfeldt, H. C. & Pretorius, B., 2011. Development of a rapid assessment method for the prediction of the glycemic index. Journal of Food Composition and Analysis, Volume 24, pp. 750-754.
Glycemic Index, 2010. Glycemic Index. [Online] Available at: http://www.glycemicindex.com/ [Accessed 10 December 2010].
Goni, I., Garcia-Alonso, A. & Saura-Calixto, F., 1997. A starch hydrolysis procedure to estimate glycemic index. Nutrition Research, Volume 17, pp. 427-437.
Greenfield, H. & Southgate, D. A., 2003. Food composition data. Rome: FAO Publishing Management Service.
Hollenbeck, C. B., Coulston, A. M. & Reaven, G. M., 1986. Glyceamic effects of carbohydrates: a different perspective. Diabetes Care, Volume 9, pp. 641-647.
www.ijaer.in Copyright © IJAER 2016, All right reserved Page 1605
Kaatinen, N. E., Simila, M. E., Pakkala, H. & Mannisto, S., 2010. Glycaemic index values in the Finnish food composition database: an approach to standardised value documentation. European Journal of Clinical Nutrition, Volume 64, pp. 68-72.
Kruger, M., Sayed, M., Langenhoven, M. & Holing, F., 1998. Composition of South African Foods: Vegetables and Fruit. Cape Town: UDMS.
Laville, M., 2004. Could glycemic index be the basis of simple nutritional recommendations?. British Journal of Nutrition, Volume 91, pp. 803-804.
Ludwig, D. S., 2007. Clinical Update: the low-glycaemic-index diet. The Lancet, Volume 369, pp. 890-892.
Matthan, N. R. et al., 2010. Age but not Body Mass Index (BMI) or Sex Affect Glycemic Response to a Single Food in Healthy Subjects. Circ, Volume 122, p. Abstract 19680.
Menezes, E. W., Giuntini, E. B. & Dan, F. M., 2009. New information on carbohydrates in the Brazilian Food Composition Database. Journal of Food Composition and Analysis, Volume 22, pp. 446-452.
Monro, J., 2005. Expressing the glyceamic potency of foods. Proceedings of the Nutrion Society, Volume 64, pp. 115-122.
Monro, M. S. & Shaw, J. A., 2008. Glycemic impact, glycemic glucose equivalent, glycemic index, and glycemic load: definitions, distinctions, and implications. American Journal of Clinical Nutrition, Volume 87, pp. 237-243.
Sajilata, M. G., Singhal, R. S. & Kulkarni, P. R., 2006. Resistant starch. Comprehensive Reviews of Food Science and Food Safety, Volume 5, pp. 1-16.
Steenkamp, G. & Delport, L., 2005. The South African Glycemic Index and Load Guide. 4th ed. Cape Town: GIFSA.
Vega-Lopez, S., Ausman, L. M., Jalbert, S. M. & Lichtenstein, A. H., 2006. Inter- and Intra-Individual Variability in Glycemic Index Values for White Bread Determined Using Standardized Procedures. CIRC, Volume 114, p. I900.
www.ijaer.in Copyright © IJAER 2016, All right reserved Page 1606
Wolever, T. M. & Jenkins, D. J., 1986. The use of the glycemic index in predicting blood glucose response to mixed meals. American Journal of Clinical Nutrition, Volume 43, pp. 167-172.
Wolever, T. M. et al., 1987. The glycemic index: similarity of values derived in insulin-dependent and non-insulin insulin-dependent diabetic patients. Journal of American College Nutrition, Volume 6, pp. 295-305.
Wolever, T. M. et al., 1988. Second-meal effect: Low-glycemic-index foods eaten at dinner improve subsequent breakfast glycemic responce. American Journal of Clinical Nutrition, Volume 48, pp. 1041-1047.