How to Feed tHe world’s
GrowinG Billions
UnderstandinG Fao world Food Projections and tHeir imPlications
STUDY
COMMISSIONED BY THE:
2011
STUDY
About this study
Publisher Heinrich Böll Stiftung (Heinrich Böll Foundation) and WWF Deutschland Publication date April 2011
Acknowledgements The authors are highly appreciative for the helpful comments on a draft version of this study provided by Franz Heidhues, Thordis Moeller, Stefan Tangermann, Detlef Virchow, Michael Hesse and Oliver Hensel. Of course, all mistakes and deficiencies in the study remain the full responsibility of the authors
Project coordination Christine Chemnitz (Heinrich Böll Stiftung), E-mail: [email protected] Matthias Meißner (WWF Deutschland), E-mail: [email protected]
Editor Thomas Köberich, WWF Germany; Lucais Sewell, Genial Translations Layout Thomas Schlembach, WWF Germany
Production Rainer Litty, Panda Fördergesellschaft
authors
Harald Grethe, assa dembélé, nuray duman
institute of agricultural Policy and markets
Food security center
Current postharvest loss levels are estimated at 20–50 %, with supply chain losses representing the dominant form of loss in developing countries and food waste at the retail and household levels dominating in industrialized countries. Inadequate infrastructure, such as of roads, transportation and storage facilities, is one important factor for postharvest losses in developing countries.
On 23 September 2009 the FAO released
the results of its food balance projections
until 2050. The main message of the FAO
press release was that agricultural production has to increase by
70 % to feed the world in 2050.
The impact of this message on the political and public debate about hunger and malnutrition was and remains impressive. Without further background information, this 70 % figure provides an excellent argument to all those who would seek to focus the hunger issue on the need to intensify agricultural production. Briefly scanning the debate, one finds the 70 % production increase as an argument against organic agriculture, as an argument in favour of intense GMO use, and even as evidence to justify the intensification of European agriculture within the debate on the Common Agriculture Policy beyond 2013. In all cases the 70 % production increase figure cited by the FAO is cited in an appeal to an underlying moral responsibility: the world needs to be feed in 2050.
Thus, although the FAO may not have intended it, by publishing the results of their food balance projections the FAO shifted the debate on hunger away from all aspects of social justice and ecological sustainability. In the current debate, numerous salient questions are now overlooked, including: Why are more than one billion people hungry in a world which has for decades produced enough food to feed every person on this planet? What are the main factors driving people into hunger and poverty? How do consumer behaviour and agricultural policy in industrialized countries af-fect hunger and rural poverty worldwide? Who is going to manage the use of natural resources in the future and what does a sustainable agriculture system look like in times of decreasing fossil resources? All of these relevant questions, which are based on considerations stemming from human rights, ecological sustainability and social equity, have been absent from recent discussions.
WWF Germany and the Heinrich Böll Foundation hope to widen the debate with this paper. Our goals are threefold: First, we aim to provide a better understanding of the FAO world food balance projections by explaining the design of the FAO model as well as by outlining which assumptions have been included in the projection and which have not. As a consequence we hope to show how the projections have to be assessed from a political point of view. Second, we want to outline how the weak link between increasing world agricultural production and hunger. Third, we aim to discuss other possibilities to ameliorate food challenges other than the intensification of agricul-tural production, and, in this way, provide arguments to all those who seek to discuss the world food situation in a socially and ecologically sound way.
Matthias Meissner Christine Chemnitz
WWF Germany Heinrich Böll Foundation
Preface
5
abstract
7
Key results
8
1
introduction
10
2
Understanding Fao world Food Projections
13
2.1 Introduction 13
2.2 Methodological Approach 15
2.3 Assumptions 16
2.3.1 Demand Factors 18
2.3.2 Supply Factors 21
2.4 Results of the FAO World Food Projections 23
2.5 Political Conclusions Drawn by FAO from the Results 27
2.6 Conclusions from the FAO World Food Projections 27
3
on the interdependencies of Global agricultural Production and Hunger
28
4
alternatives to improving the world Food Balance
31
4.1 Introduction 31
4.2 Reduction of Postharvest Losses 32
4.2.1 Introduction 32
4.2.2 Causes of Postharvest Losses 33
4.2.3 Current Extent of Postharvest Losses 35
4.2.4 Postharvest Losses in the Course of Economic Development 36
4.2.5 Potential for Loss and Waste Reduction 38
4.2.5.1 In Developing Countries 38
4.2.5.2 In Developed Countries 39
4.2.6 Conclusion 40
4.3 Changes in Consumption Patterns 42
4.3.1 Introduction 42
4.3.2 Past and Future Livestock Sector Developments 42
4.3.2.1 Consumption Trends 42
4.3.2.2 Production Trends 44
4.3.3 Competition between Food and Feed 44
4.3.4 Reduction of Meat Consumption in Developed Countries 45
4.3.4.1 Benefits from Reduced Meat Demand in Developed Countries 45
4.3.4.2 Taxing Meat Consumption? 48
4.3.5 Quantifying Effects of Lower Meat Consumption in Developed Countries on global food balances 49
4.3.5.1 Literature Review 49
4.3.5.2 Quantitative Analysis 50
4.3.6 Conclusions 54
5
conclusion
56
This study aims to clarify the methods
used and the assumptions made in the
FAO world food projections, which
fore-cast the need for a 70 % production increase between 2005/07
and 2050, as well as to discuss the implications of this figure.
We find that the FAO projections are based on solid analysis and
an enormous amount of expert knowledge and country specific
data, yet the assumptions and underlying methodology are poorly
documented.
Furthermore, the FAO’s strong focus on increasing production in contrast to other options for improving the world food balance, especially in the communication of the analysis to the public, is unbalanced. Alongside productivity increases, the reduction of political support for biofuel production, the reduction of postharvest losses and a less meat based diet in industrialized countries should be explored. Political support for first generation biofuels should be ended. This option could be easily implemented and would have direct and significant effects on the world food balance. A literature review suggests that there is significant scope and need for reducing postharvest losses in developing and developed countries. Current postharvest loss levels are estimated at 20–50 %, with supply chain losses the dominant form of loss in develop-ing countries and food waste at the retail and household levels dominatdevelop-ing in indus-trialized countries. Lowering meat demand in indusindus-trialized countries would have positive effects on human health and the environmental goods. Furthermore, it would result in lower climate gas emissions and ease the introduction of higher animal welfare standards. Finally, they would improve the world food balance and result in substantially lower meat prices but only slightly reduced cereal prices. Last but not least, it is important to note that the global availability of food is not the most relevant limitation in the reduction of undernourishment, but rather it is the persistence of poverty which causes undernourishment in a world which could feed 9 billion.
Chapter 2: Understanding FAO World Food Projections
» The increase in global agricultural production and demand by 70 % between 2005/07 and 2050 is not what the FAO considers as desirable, but it reflects the increase in global demand which the FAO considers most likely to happen in the future, and the required increase in production that the FAO considers necessary and feasible to meet this demand. The projections are based on the assumption that about 290 million would still be undernourished by 2050.
» The FAO projections are based on solid analysis and a high amount of expert knowledge and country specific data. Furthermore, they are roughly in line with projections made by other institutions.
» Due to intransparent presentation and insufficient documentation of assumptions and methodology, it is almost impossible to reconstruct the results in light of the assumptions made. In addition, as many of the assumptions are unknown to the reader, it is impossible to evaluate their validity compared to any alternatives. » Climate change is not included in the projections and is likely to put further
pres-sure on the world food balance by 2050.
» On the other hand, GDP growth is assumed to run at 2.4 % annually for the period between 2030 and 2050, which is about 0.2 percentage points higher than observed between 2000 and 2010 and about 0.8 % higher than in the two decades prior. A more conservative estimate of GDP growth would reduce the pressure on the world food balance.
» FAO projections of the need for a 70 % production increase do not justify the claim that global agriculture in general should be intensified.
» The strong focus on the relevance of global agricultural production for fight-ing malnutrition and hunger in the communication of the results is excessively one-sided. Increasing global agricultural production is one option among others to improve the world food balance. And it is poverty, not the global food balance, which is the main cause of hunger.
Chapter 3: On the Interdependencies of Global Agricultural Production and Hunger
» Increasing the global availability of food, whether through higher production, changes in consumption habits such as lower meat consumption, or lower posthar-vest losses, is a necessary but not a sufficient condition for decreasing hunger. » The most important factor for decreasing hunger is the reduction of poverty. The
effects of higher global food availability on the reduction of hunger are rather indirect.
» An increase in agricultural production is of importance mainly within the regions subject to food insecurity. Here it can have a double effect, lowering prices and increasing food availability for food purchasers while also generating additional
income for food producers. These regions should be the focus of investments in rural infrastructure and agricultural research, and efforts to improve governance systems and institutions which allow markets to work.
» What is needed most to fight undernourishment is poverty reduction by provid-ing the poor with better access to education, employment, land and other options for income generation, as well as to public services such as social safety nets and medical care.
Chapter 4: Alternatives to Improving the World Food Balance
» Demand for biomass for energy production has a strong impact on the world food balance.
» Demand for first generation biofuels in the EU, US and various other countries is driven by narrow political interests and contributes to high global prices for agricultural products. This causes substantial indirect land use changes, as crop land use intensifies and expands worldwide in response to the increasing demand for biofuels.
Chapter 4.2 Reduction of Postharvest Losses
» Current postharvest loss levels are estimated at 20–50%, with supply chain losses dominating in developing countries and food waste at the retail and household levels dominating in industrialized countries.
» There is a significant need and considerable opportunities for reducing supply chain losses and consumer food waste due to the sheer volume of such losses. In contrast, there is only little evidence for the successful reduction of such losses through policy measures.
» Regarding the food security objective, the focus should be on reducing postharvest losses in food insecure regions, which would increase food availability and gener-ate income along the supply chain at the same time.
» Without more systematic research on the extent of losses, measuring progress against any global reduction target is impossible. Despite this lack of reliable data, there are compelling arguments in favour of tackling postharvest losses.
Chapter 4.3 Changes in Consumption Patterns
Lowering meat demand in industrialized countries would improve the world food balance and result in substantially lower meat prices and slightly reduced cereal prices.
» The resulting effect of reduced meat consumption on food security, however, is likely to be small. This is because lowering meat consumption in industrialized countries leads to lower meat prices and causes more meat consumption else-where. The effect on basic staple food prices is therefore low.
» However, lowering meat demand in industrialized countries would have positive effects on human health and the environmental goods. Furthermore, it would result in lower greenhouse gas emissions, a less unequal per capita use of global resources, and ease the introduction of higher animal welfare standards.
Globally, undernourishment is a disturbingly persistent problem: Although a target was set at the 1996 World Food Summit to reduce the number of undernourished by 50 % by 2015, the prevalence of hunger has increased by 15 % since that time and, after peaking at more than a billion in 2009, was at 925 million in 2010 (Figure 1.1).
In addition to the high prevalence of hunger that has persisted for decades, the world experienced a situation of high peaks in agricultural world market prices in 2007 and 2008 and again in 2010 and 2011. These have translated into an increasing number of undernourished, and many believe that they mark a change in the historical trend of declining real agricultural prices, which has been in evidence since early indus-trialization. Reasons behind this trend change include increasingly scarce natural resources such as land and water, strongly evolving non-food demand for biomass, mainly for the production of bioenergy, a continued high population growth, a shift in consumption patterns towards higher value foods and increasing energy prices. Against this backdrop, projections regarding the world food balance are an important input for the political discussion on fighting undernourishment.
introduction
Figure 1.1:
Number of Undernourished 1990–2010 (in millions)
Sources: FAO (various issues).
Number of undernourished 1996 World Food Summit Reduction target
1
0 200 400 600 800 1000 1200
Number of undernourished
Reduction target World Food Summit 1996
0 200 400 600 800 1000 1200
Number of undernourished
Reduction target World Food Summit 1996
despite the goal of
halving the number
of hungry by 2015
the prevalence of
hunger has increased
by 15 % since 1996
In 2006, the FAO published its “FAO Interim Report” (FAO, 2006), an update of an earlier report titled “World Agriculture: Towards 2015/2030 – An FAO Perspective” (Bruinsma, 2003). This Interim Report and some minor updates (Bruinsma, 2009) constitute the basis for the FAO estimate that global agricultural production must increase by 70 % by 2050 to meet global demand, a finding which was circulated at the World Food Summit in 2009: “In order to feed this larger, more urban and richer population, food production (net of food used for biofuels) must increase by 70 percent” (FAO, 2009a: 2). This figure was widely cited by the international press. In addition, several interest groups have used this figure with very different objectives, often to suggest a close link between global production and hunger reduction:
» In claims for more funds for development aid, e.g. by FAO (Financial Times, 2008). » In claims for an intensification of agricultural production (AtlasFram Group, 2010). » Use of GMOs (e.g. Brabeck-Letmathe, 2009; Bridges, 2008).
» In claims for a more intensive agricultural production in the EU in order to ad-dress global food insecurity (EU COM 2010).
» In criticism of organic agriculture (Syngenta, 2009).
But the isolated “70% production increase” figure (designated as “70 % PI” through-out this text) is not very meaningful withthrough-out any accompanying information and inadequate to support the above mentioned claims. In particular, this figure does not justify the claim that global agriculture in general should be intensified. Furthermore, the excessively strong focus on the relevance of global agricultural production for fighting malnutrition and hunger is misleading.
Given this backdrop, this study has the following objectives:
» To clarify the methods used and the assumptions made in projecting the 70 % PI figure.
» To discuss the implications of the 70 % PI, especially whether and to what extent an increase of global agricultural production will contribute to reducing hunger. » To analyze the extent to which changes in other variables (composition of food
consumption, postharvest losses, use of biomass for energy production, etc.) – variables which are also subject to the impact of potential policies – may contribute to meeting the world wide increasing demand for food.
The study is organized as follows: Chapter 2 gives an overview of the background, methods used and assumptions made as well as the core results of the FAO projec-tions. Chapter 3 discusses the interdependencies between agricultural production and undernourishment. Chapter 4 discusses and analyzes alternative options for improv-ing the world food balance, in contrast to an isolated focus on increasimprov-ing agricultural production. Two factors are especially highlighted in Chapter 4: the potential to decrease postharvest losses and the impact of lower meat consumption in developed countries. Finally, Chapter 5 draws some conclusions.
Growth in agricultural production has often been coupled with the unsustainable exploitation of natural resources. Agrochemicals, if not adequately used, have severe effects on natural resources like biodiversity and water.
2.1 Introduction
Several conditions are essential for understanding the 70 % PI and putting it into perspective:
» An understanding of the definition of the 70 % PI figure, including the units of measurement (such as area, calories, cereal units, value).
» An understanding of the assumptions made and methods used in the projections. » A comparison of the results to those from other studies.
» An understanding of the political implications of the 70 % PI, especially with respect to its relevance for fighting world hunger. (Under which conditions are the 70 % PI valid? Why is the focus so much on 70 % PI instead of other options to improve the world food balance?)
Bruinsma (2009: 5) clearly defines what is meant by the 70 % PI: It is the increase in the value of global agricultural production in constant base period prices (1989–91 average world market prices in US$, FAO, 2006). This implies that the projected increase in global agricultural production has two components: (1) an increase in the absolute quantities of individual product categories (such as cereals by 49 %, meat by 85 %), (2) a change in the composition of product categories from low priced products (cereals, pulses, starchy tubers) to higher priced products (fruit and vegetables, animal products) (Bruinsma, 2009: 5). These two effects together are projected to lead to an increase in the value of global agricultural production by 70 %, equivalent to a 22 % per capita increase, taking into account population growth of 40 %, resulting in a world population slightly exceeding 9 billion by 2050. Expressed in calories the projected production increase in value would imply an average increase in per capita calorie consumption of 11 % by 2050 (ibid).
While 70 % appears on its face to be a clearly defined figure, it is difficult to know and understand the assumptions and methods that lie behind it. This is due to several problems:
» The 70 % PI is based on several studies which are drawn together in a somewhat intransparent manner.
» The documentation of assumptions and methodological approach is spread over various papers which date as far back as 1995. In addition, the assumptions and methodologies are often drawn from papers which are not of direct relevance for the projections.
» A substantial portion of the assumptions are not or only in very general terms documented.
Understanding Fao world Food
Projections
2
the projected 70 %
increase in
production would
imply an average
increase of per
capita calorie
consumption of 11 %
by 2050
the assumptions
underlying the
projected 70 %
production increase
are weakly
documented
It is therefore almost impossible to trace the results in light of the assumptions made and as many of the assumptions are unknown it is impossible to evaluate their valid-ity compared to any alternatives.
In order to ease the reader’s access to the original sources, Figure 2.1 displays a timeline of relevant publications (lower part of the figure) and events (upper part of the figure).
The FAO has been engaged in generating projections of the world food situation since its foundation and has regularly published reports in this regard. The 70 % PI figure is based on three studies which are outlined in some detail in the paragraphs below:
» The FAO report “World Agriculture: Towards 2015/30”, published in 2003 (Bruinsma, 2003).
» The FAO Interim Report “World Agriculture: Towards 2030/2050”, including some updates and published in 2006 (FAO, 2006).
» Further updates to the projections published by Bruinsma (2009).
In 2003, the report “World Agriculture: Towards 2015/30 an FAO Perspective” (Bruinsma, 2003) was published. The report is a comprehensive study that documents projections of global agricultural production and the world food situation until 2030 in chapters 1–5. It also addresses several topics related loosely or not at all to the projec-tions such as world forestry, globalization, agricultural trade liberalization, climate change and others. The methodology of the projections is described only rudimentarily in a short annex and reference is made to a publication by Alexandratos (1995), which adds little to providing a comprehensive documentation of the methodology used. The so-called Interim Report (FAO, 2006) updates the projections from Bruinsma (2003) and extends the projection horizon to 2050. Reasons given for this update include: (1) the corrections of the UN population projections from 9.3 billion (UN, 2001) in 2050 to 8.9 billion (UN, 2003), (2) significantly higher projections of global crude oil prices and (3) insufficient progress with regard to the target of halving the number of undernourished by 2015, as avowed at the World Food Summit in 1996. A core finding of the Interim Report is a forecast that global agricultural production (in terms of production value at constant prices) will increase by 87 % between the base period (average of the years 1999–2001) and the year 2050 (own calculations based on FAO, 2006: 33). This figure has been communicated by FAO (FAO, 2008) and cited by the press frequently as the need for “doubling agricultural production by 2050” (Financial Times, 2008).
Figure 2.1:
Timeline of the Important FAO Papers and Events
Source: Own composition.
2001 UN Population Prospects Assessment (UN, 2001).
(9.3 billion in 2050)
2001 2002 2003 2004 2005 2006 2007 2008 2009 2010 2011
2003 UN Population Prospects Assessment (UN, 2003).
(downward revision; 8.9 billion in 2050)
2008 UN Population Prospects Assessment (UN, 2008). (9.2 billion in 2050)
2010 High Level Expert Forum, 12–13 October, FAO, Rome 2009 Expert Meeting (How to Feed the
World in 2050), 24–26 June 2003 FAO Report: World Agriculture: Towards 2015/30 (Bruinsma, 2003) 2006 FAO Interim Report: Revision of the key
Chapters 2 and 3
2009 Various expert papers, e. g. Bruinsma (2009)
In preparation of the World Food Summit in 2009, projections were updated again. The most significant change was the consideration of new base data for agricultural production (2005–2007 instead of 1999–2001) (Bruinsma, 2009: 4). Therefore, the new projection period comprises 44 years (2005/07–2050) instead of 50 years (1999/2001–2050). Taking into account this difference in projection horizon, the new figures imply an almost identical annual increase in agricultural production as the former ones (in total 70 % instead of 87 %, with the projection horizon shortened by 6 years).
In the remainder of this chapter, Sections 2.2 and 2.3 present the methodological background of the most recent FAO projections underlying the 70 % PI and published by Bruinsma (2009), and the assumptions made to the extent that they could be extracted from the FAO sources. In order to ease the verification of FAO projections and underlying assumptions, Section 2.4 summarizes some key results, discusses the plausibility of their magnitude and compares them to those from other studies. Section 2.5 discusses the conclusions FAO draws from the 70 % PI, which are interest-ing especially in light of the strong political instrumentalization of this number shown above, and why the FAO puts such a strong weight on this figure in communicating the results of Bruinsma (2009) to the public. Finally, Section 2.6 draws some summa-rizing conclusions from the analysis of the projections.
2.2 Methodological Approach
FAO world food projections do not reflect what the FAO considers desirable to happen, but they reflect the increase in global demand that the FAO considers most likely to happen in the future, and the required increase in production that the FAO considers necessary and feasible to meet this demand. These projections thus do not imply a normative assessment of what should happen.
The projection of the world food balance is not based on the use of one quantitative economic simulation model, but rather consists of three subsequent steps, using an accounting framework and relying heavily on expert assessments. These steps are:
» Demand projections. » Supply projections.
» The reconciliation of demand and supply projections at the national and global levels in order to achieve a balanced world food situation and plausible trade flows. This process is not price driven: real prices are assumed to remain constant. 1) Demand projections are based on available information from various sources such as other models, expert estimates and best guesses. Most important determinants include population growth, income growth, changes in income distribution, and autonomous trends in consumption patterns. As a result, the increase in effective demand for food products between the base period and the year 2050 is estimated based on calculations, and implies certain production increases. This increase in effective demand is not what the FAO considers as desirable, but what the FAO considers to be most likely to happen in the future based on currently available information. Especially important in this context is that this increase does not reflect the abolishment of hunger, but rather reflects the decline in hunger which the FAO considers likely to happen (see below).
Fao world food
projections do not
reflect what the Fao
considers desirable
to happen, but most
likely to happen
2) Supply projections take into account the available resource base in the individ-ual countries (land reserves, water for irrigation), expectations on technical progress (e.g. in yields per ha or feed use per unit of animal product output), and change in management techniques such as changes in cropping intensity.
3) Reconciliation of supply and demand: Initially, the FAO projections of demand and supply are generated independently, i.e. they do not necessarily balance out. National increases in supply would not necessarily match national increases in demand, and even if one allows for changes in the net trade balances for the individ-ual countries, the aggregated increase in global supply would not necessarily match the aggregated increase in global demand. Therefore, as a next step in the projection process the global increase in supply is reconciled with the global increase in demand in an accountancy framework. This process of reconciliation is a rather resource intensive, technical and handmade procedure, involving per country modifications of supply and trade which is often based on the judgement of country and market experts. Important to mention is that this process does not involve the use of equi-librium models, which would allow for changes in relative prices in order to reconcile supply and demand changes, but rather assumes constant prices.
The approach chosen by FAO has the advantage of allowing the inclusion of an enormous amount of country specific information on the natural resource base as well as socioeconomic and cultural conditions. This means that the results are validated against their physical feasibility and plausibility. A disadvantage, however, is that this approach does not allow for the simulation of changes in relative prices and the resulting feedback mechanisms. Furthermore, due to the missing market clear-ing price mechanism, the development of a scenario with supply and demand beclear-ing balanced is enormously time consuming. As a consequence, the FAO produces only one “baseline projection” under a given set of assumptions and for a given projec-tion horizon, but not any addiprojec-tional scenarios which may result under sets of differ-ent assumptions (Bruinsma, 2003: 381–382). Compared to projections based on a quantitative equilibrium model which equates demand and supply using the price mechanism, and typically finds changes in relative prices, the approach pursued by FAO does not necessarily result in less valid results. Thus, while the inclusion of an enormous amount of knowledge on biophysical restrictions and expert knowledge is an asset, the inflexibility in running alternative scenarios with different assumptions and sensitivity analyses represents a key weakness in the approach.
In the following section, we provide a description of the specific assumptions made in the projections to the extent that it is possible to extract this information from the respective publications.
the Fao produces
only one “baseline
projection”, but
not any additional
scenarios which
may result under
sets of different
assumptions
2.3 Assumptions
A wide range of demand and supply factors are taken into account in the FAO projec-tions and presented and discussed in detail in Secprojec-tions 2.3.1 and 2.3.2. Table 2.1 gives an overview of these factors.
Price changes and climate change are not covered by the projections. Taking climate change into account would put even more pressure on the world food balance. It is very likely that climate change will negatively affect average global agricultural production in the future, and will likely lead to lower land productivity in tropical and subtropical climate zones and increased land productivity in temperate climate zones (Parry et al., 2004; Nelson et al., 2009; Moeller and Grethe, 2010; Fischer, 2009).
Table 2.1:
Demand and Supply Factors Considered in the FAO Projections
Source: Own composition.
Price changes and
climate change are
not included in the
projections
Demand Factors
Factors included in FAO projections Factors not included in FAO projections
Population growth Price changes
Income growth
Changes in food distribution (resulting from changes in income distribution)
Socio-cultural factors Postharvest losses
Improvement in feed conversion
Changes in seed use and in industrial use Bioenergy demand
Demand for fishery products
Supply Factors
Factors included in FAO projections Factors not included in FAO projections
Change in agricultural area Climate change
Increase in irrigated area Increase in cropping intensity Crop yield growth
Production constraints resulting from resource availability
Changes in animal numbers
Increase in animal productivity and inten-sification (feed conversion, off-take rates, carcass weights, etc.)
2.3.1 Demand Factors
The main factors determining food demand growth are increases in population and income as well as autonomous consumption trends:
» Population growth is based on the UN Population Prospects (UN, 2003), which predict world population to grow from 6.1 billion in the year 2000 to 8.9 billion by 2050, i.e. by 46 % (FAO, 2006: 16). As a result, population growth for the period for the latest projections between 2005/07 and 2050 would amount to 37 %. » Average world per capita income growth for the period 2000–2030 is based on
World Bank (2006) and amounts to a 2.1 % annual growth rate, and the FAO as-sumes a 2.7 % annual growth rate for 2030–2050 (FAO, 2006: 17). This leads to an income increase for the period of the latest projections between 2005/07 and 2050 of 180 %. Increases in income used in the FAO projections are country specific and the reaction of food demand to increases in income are also considered country-by-country. For example, FAO assumes the response in demand for meat products in India to income growth to be substantially lower than in many other countries with comparable income levels due to dietary preferences resulting from cultural and religious practices (FAO, 2006: 49). In the published FAO papers, projected income growth is reported by country group (e.g. Table 2.5 in FAO, 2006: 17), but not by country. The evidence on individual countries such as India is often anec-dotal. Moreover, the income elasticity used in the projections are not documented. » Changes in income distribution can have substantial effects on aggregate food
demand: a more equal distribution of income results in higher food demand, as poorer parts of the population tend to spend a larger share of their incomes on food than higher income groups. The FAO projections do not explicitly take into account changes in income distribution. Based on World Bank projections of declining poverty, however, FAO projections are based on the assumption that coefficients of variation in food demand within developing countries will decline from a level in the range of 0.21–0.36 in the base period to 0.20–0.295 by 2050 (FAO, 2006: 21).
» Country and product specific consumption trends which are not driven by stand-ard variables such as income or prices are often designated as “autonomous con-sumption trends”. Such trends may be driven by changes in consumers’ perception of food products, health issues and other factors. Such autonomous trends are sometimes taken into account in the FAO projections, but are not systematically documented in the reports.
» Increasing demand for fishery products is taken into account in the calcula-tions of total food availability, but the exact amount is not specified clearly. The 2003 report states that “the global average per capita consumption could grow to 19–20 kg by 2030, raising total food use of fish to 150–160 million tons (97 million tons in 1999)”, with the bulk of the increase coming from aquaculture (Bruinsma, 2003: 22).
» The handling of demand forecasts for biofuels is quite intransparent. Bruinsma (2009: 2) states that the projections do “not deal with additional demand for agricultural products used as feedstock in biofuel production”. But obviously this refers to any additional demand for biofuels, which would add to that already considered in the Interim Report.
» The biofuel demand for coarse grains, especially corn, is mentioned several times in the Interim Report. In the section where the results are described, it is mentioned that “consumption of coarse grains should continue to grow, mainly for non-food uses (essentially animal feed, though use for the production of biofuels may assume some importance in the future)” (FAO, 2006: 41). Yet it remains open to what extent this has been considered in the projections. » For vegetable oils, it is assumed that demand for non-food industrial uses will
grow by 3.2 % annually until 2050, compared to human demand growing by 1.5 % annually. As a result, about 42 % of vegetable oil demand will be for non-food industrial use by 2050 (FAO, 2006: 57).
» For cassava, the Interim Report states that “In our projections for non-food uses we made some allowance for increased demand originating in the biofuels sector” (FAO, 2006: 60). Yet it remains unclear to what extent this was done. » For sugar, it is assumed that demand for sugar in ethanol production will
increase strongly in Brazil, Peru, Colombia, Central America, India, Thailand, Australia, South Africa and Zimbabwe. As a result, it is projected that indus-trial use of sugar will grow by 4 % annually up to 2050 (FAO, 2006: 62–63). » The overall picture with regard to biofuels is unclear: the amount of
vegeta-ble oils and sugar use for biofuel production can be derived from the Interim Report, but this is not the case for cereals. The effect of biofuel demand on the global food balance is explicitly addressed in supplementary papers (e.g. Fischer, 2009).
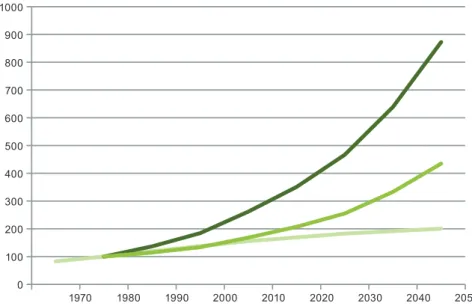
Figure 2.2 graphically depicts the development of the two most important variables impacting food consumption: population and income
Figure 2.2 shows that world population is expected to grow slower than in the past (annual growth rate 2030–2050 = 0.5 %). In contrast, the GDP and per capita GDP growth rates assumed by FAO (2.1 % until 2030; 2.7 % until 2050) are substantially above what has been observed in the past (2.2 % annually from 2000 to 2010 and about 1.4 % in the two decades prior).
Figure 2.2:
World Population and World Income (1970 = 100)
Sources: FAOSTAT (2011) for historical popula-tion data; IMF (2010) for historical GDP data, FAO (2006) for projections, own calculations.
0
100
200
300
400
500
600
700
800
900
1000
1970 1980 1990 2000 2010 2020 2030 2040 2050
Population
GDP
GDP/capita
1970 0 100 200 300 400 500 600 700 800 900 10001980 1990 2000 2010 2020 2030 2040 2050
GDP GDP/capita Population
the GdP growth
rates assumed by
Fao until 2050 are
substantially above
what has been
observed in the past
A quick back of the envelope calculation shows that the increase in population and income assumed by FAO alone would result in an increase in the value of consump-tion on the order of magnitude projected by FAO: Assuming an income elasticity of total food demand of about 0.21 and a population elasticity of total food demand of 1, the resulting increase in food consumption would be about 76 %. If, instead, per capita GDP growth rates observed between 1980 and 2000 are assumed to prevail in the future (i.e. 1.4 % annually), the resulting increase in food consumption would only be 50 % instead of 76 %.
A final factor which impacts the future of the global food balance is the posthar-vest losses that occur along the food supply chain and at the household level (see Section 4.2 below). In its projections, the FAO estimates of postharvest losses (called “waste” in the reports) exclude losses at the household level (FAO, 2006: 14), but the figures used for the base period and the projections are not published in the FAO reports. Based on published FAO statistics which are used in the projections (Supply Utilization Accounts; FAOSTAT, 2011), we can conclude that even if losses at the household level are neglected, losses used in the projections seem low compared to the estimates for losses along the supply chain reported in the literature, which are about 15 % for cereals in developing countries (see Section 4.2.4 below). This conclu-sion can be derived as follows:
» The updated projections of the Interim Report only include the categories “food” and “all uses”, whereby “all uses” minus “food” would include feed, industrial use, seed and waste (e.g. FAO, 2006: 40, Table 3.3).
» Figure 3.9 in the original FAO report (Bruinsma, 2003: 75) shows the development of “other uses” for cereals, including industrial use, seed use and waste, which declines from about 10.4 % in 1997/99 to 9.4 % by 2030.
» According to FAO commodity balances (FAOSTAT, 2011), waste accounted for 4.5 % of global cereal production in 1997/99, seed accounted for 3.6 % and indus-trial utilization for 2.3 %, yielding the 10.4 % figure found in Table 3.9 in Bruinsma (2003).
Thus, postharvest losses assumed in the studies are far below other estimates. Second, we can try to understand how FAO projects postharvest losses to develop until 2050:
» The FAO assumes a slight decline in the aggregate total for industrial use, seed use and waste of about one percentage point by 2030, yet one can only guess as to the composition of this decline.
» According to FAO data, seed use has declined substantially in the past, whereas waste has been quite stable. For this reason, it appears FAO projections for a de-cline in the aggregate are based on declining seed use instead of declining waste (see Figure 2.3).
1 An income elasticity of demand of 0.2 means that demand for the respective product increases by 0.2 % if
income increases by 1 %.
Postharvest losses
assumed in the Fao
studies are far below
other estimates
assuming a reduced
annual per capita
GdP growth rate of
1.4 % leads
projected growth
in food demand by
2050 to drop from
75 % to 50 %
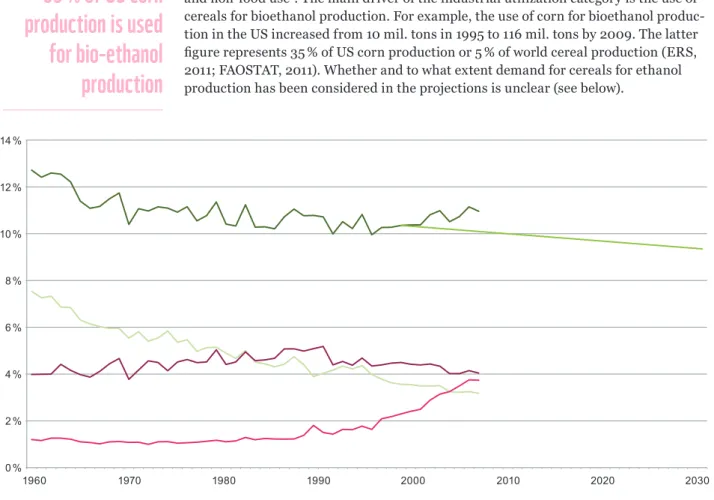
Figure 2.3 includes data on total non-feed and non-food use up to 2007, when these categories totalled at 11 %, as well as FAO projections of this aggregate up to 2030. This total includes seed use, industrial use and waste. In addition to showing a decline in seed use and stable food loss percentages, Figure 2.3 highlights the strong increase in the industrial utilization of cereals witnessed since the mid-90s. It seems that this use category has reversed the declining trend of the overall aggregate “non-feed and non-food use”. The main driver of the industrial utilization category is the use of cereals for bioethanol production. For example, the use of corn for bioethanol produc-tion in the US increased from 10 mil. tons in 1995 to 116 mil. tons by 2009. The latter figure represents 35 % of US corn production or 5 % of world cereal production (ERS, 2011; FAOSTAT, 2011). Whether and to what extent demand for cereals for ethanol production has been considered in the projections is unclear (see below).
2.3.2 Supply Factors
There are essentially two factors that can lead to higher crop yields: an increase in cultivated area and an increase in the productivity of land. Increases in the productiv-ity of land improved may stem from several factors, including enhanced complemen-tary inputs (irrigation, fertilizer), improvements due to crop breeding, or improved farming techniques. For the FAO projections the following assumptions are made about average global developments (Bruinsma, 2009: 2–6):
» Total arable land will increase by 5 %, reflecting a decline in industrialized coun-tries and an increase in developing councoun-tries.
» Irrigated land will increase by 17 % and land equipped for irrigation will increase by 11 % (all of this increase is forecasted to occur in developing countries). » Cropping intensity, which is defined as the frequency of harvests on a given land
unit, will increase by about 9 %.
» Average crop yields will increase by 42 %.
Figure 2.3:
Non-Feed/Non-Food Cereal Use as a % of Global Production
Sources: FAOSTAT (2011) for historical data; Bruinsma (2003) for
projec-tions, own calculations.
Total non-feed & non-food Total feed & non-food projections Seed Waste Industrial utilization
35 % of Us corn
production is used
for bio-ethanol
production
14 %12 %
10 %
8 %
6 %
4 % 2 %
0 %
For animal production, supply increases may be achieved with an increase in animal numbers or with productivity increases caused by factors such as shorter production cycles and higher carcass weight or milk and egg yields (Bruinsma, 2003: 164). Bruinsma (2003) presents information on the projected growth rates in meat produc-ing animal numbers between 1997/99 and 2030 (Bruinsma, 2003: 165, Table 5.3) as well as assumed developments in carcass weight. Information on other underlying productivity parameters is not specified in the report. Based on the increase in animal numbers (Bruinsma, 2003: 165, Table 5.3) and the projected increase in animal production (Bruinsma, 2003: 89, Table 3.11) between 1997/99 and 2030, the growth rates in animal productivity that underlie the assumptions in FAO projections to 2030 can be reconstructed:
» Beef production will increase by 1.3 % annually (= 51 % between 1998/99 and 2030) of which 0.6 % (21 %) can be ascribed to advances in productivity and 0.7 % (25 %) to increasing animal numbers;
» Pork production will increase by 1.1 % annually (42 % in total) of which 0.5 % (17 %) can be attributed to productivity improvements and 0.6 % (21 %) to the increase in animal numbers;
» Poultry production will increase by 2.7 % annually (135 % in total) of which 1.1 % (41 %) is attributed to productivity increases and 1.6 % (66 %) to the increase in animal numbers.
Moreover, feed demand for cereals for overall livestock is specified, but no informa-tion is published on changes in feed conversion rates. Total feed demand for cereals is expected to increase by 89 % between 1999/01 and 2050, which is equivalent to 1.28 % p.a. (1.6 % p.a. between 1999/01 and 2030 and 0.8 % between 2030 and 2050; up from 0.8 % p.a. in the 1990s).
This can be compared to an increase in the production of all livestock products (in-cluding meat, eggs and milk) of 1.6 % p.a. between 1999/01 and 2030 and of 0.9 % p.a. from 2030 to 2050, equivalent to a total increase of 92.6 % over the period 1999/01– 2050. Thus, total livestock production and total feed demand for cereals increase by about the same rate. From these figures, however, one cannot conclude that feed conversion rates remain constant, as they combine various effects: improvements in feed conversion, a changing composition between different livestock products, and changes in the composition of feed rations.
Figure 2.4:
Arable Area, Area Equipped for Irrigation and Crop Yield (1970 = 100)
Sources: FAOSTAT (2011) for historical data; FAO (2006) for projections, own calculations.
0 50 100 150 200 250 300
1970 1980 1990 2000 2010 2020 2030 2040 2050
Arable area Cereal yield Irrigated area
Arable area Cereal yield Irrigated area
Figure 2.4 graphically depicts trends in the most important variables impacting crop production: arable area, area equipped for irrigation and cereal yields.
Figure 2.4 shows the limited potential for increases in arable area, the strong decline in the absolute increases of irrigated area and the declining growth rates of cereal yields, which were above 2 % annually in 1970–1990, declining to 1.2 % in 1990–2010 and are projected to further decline to 0.6 % by 2050.
2.4 Results of the FAO World Food Projections
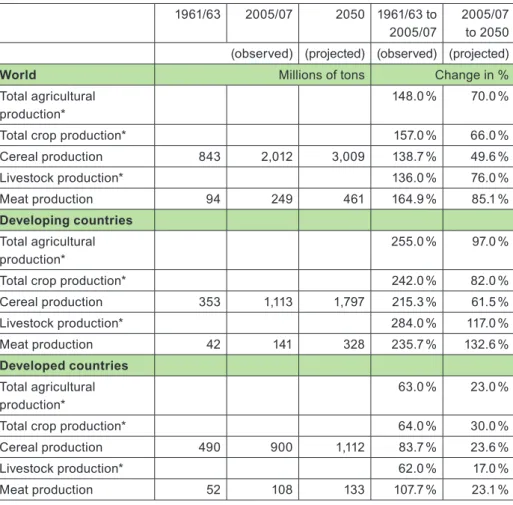
FAO projects agricultural production to increase by the percentages displayed in Table 2.2 over the 44 year period from 2005/07 to 2050. For product groups with a compa-rable value per quantity unit, such as cereals and meat, the increase is reported for the development of the total quantity. For other product groups, which comprise products with very different per unit values (such as “crops”), increases are expressed in terms of total production value at constant world market prices at constant 1989–91 world market prices in US $ (FAO, 2006: 31).
1961/63 2005/07 2050 1961/63 to
2005/07
2005/07 to 2050 (observed) (projected) (observed) (projected)
World Millions of tons Change in %
Total agricultural production*
148.0 % 70.0 %
Total crop production* 157.0 % 66.0 %
Cereal production 843 2,012 3,009 138.7 % 49.6 %
Livestock production* 136.0 % 76.0 %
Meat production 94 249 461 164.9 % 85.1 %
Developing countries
Total agricultural production*
255.0 % 97.0 %
Total crop production* 242.0 % 82.0 %
Cereal production 353 1,113 1,797 215.3 % 61.5 %
Livestock production* 284.0 % 117.0 %
Meat production 42 141 328 235.7 % 132.6 %
Developed countries
Total agricultural production*
63.0 % 23.0 %
Total crop production* 64.0 % 30.0 %
Cereal production 490 900 1,112 83.7 % 23.6 %
Livestock production* 62.0 % 17.0 %
Meat production 52 108 133 107.7 % 23.1 %
Table 2.2:
Increases in Agricultural Production * In value terms, aggre-gated with constant world market prices of the years 1989–91 in US $.
Sources: Bruinsma (2009: 5), own calculations.
Table 2.2 shows a total increase in agricultural production of 70 % in value terms, which results from a 97 % increase in developing and 23 % increase in developed countries. Globally, meat products experience the strongest growth (85 %), followed by the aggregate of livestock production (76 %), aggregate crop production (66 %) and cereal production (nearly 50 %). In developing countries, growth in total livestock products and meat production increase by a higher percentage than crop production. In developed countries, by contrast, the increase in animal production is lower than that in crop production.
The 70 % growth in total agricultural production results in a 22 % per capita increase when taking into account global population growth of 40 % to 9 billion by 2050. Expressed in calories, such an increase in value would imply an average increase in per capita calorie consumption of 11 % (Bruinsma, 2009: 5). Based on assumptions of a more equitable distribution of food within countries by 2050 (FAO, 2006: 21), the FAO estimates that the absolute prevalence of undernourishment in developing coun-tries will decrease from 813 million in 2000/2002 to 290 million by 2050, a decrease equivalent to 64 %.
In order to put the projected increases in agricultural production into perspective, Table 2.2 also presents the historical increases for an equally long 44 year period: 1961/63 to 2005/07. A comparison shows that for agriculture as a whole as well as for most product groups, the growth rates observed in the past are more than twice as high as those projected for the future, although they started from a much lower absolute level, of course. Looking more closely at the calculations underlying the projections described above, these declining growth rates reflect lower demand growth mainly due to weaker population growth (population has more than doubled during the historical 44 year period and is projected to increase by only 38 % over the forecast period). On the supply side, declining growth rates in arable area, irriga-tion and the productivity of land assumed, and are sufficient to satisfy the increase in demand. Furthermore, it should be taken into account that past growth rates in agricultural production was often accompanied by the unsustainable exploitation of natural resources (e.g. Bruinsma, 2003: Chapter 12).
Finally, the FAO projections can be put into perspective by comparing them to projections of the world food situation made by other institutions and author teams. Major alternative sources are projections published by the International Food Policy Research Institute (IFPRI) based on the partial equilibrium simulation model IMPACT. As discussed above, simulations based on such a model allow for the simula-tion of price changes and the straightforward formulasimula-tion of scenarios based on alter-native assumptions that can be analyzed quickly. A major IFPRI publication based on the IMPACT model is “Global Food Projections to 2020” (Rosegrant et al., 2001). Due to the relatively dated nature of these projections, however, we also compare the FAO projections to Msangi and Rosegrant (2009), who project the development of world food balances up to 2050.
Generally speaking, world food projections tend to be quite much in line, as Figures 2.5 and 2.6 show. These figures contain contain FAO projections (Bruinsma, 2003; FAO, 2006), IFPRI projections (Rosegrant et al., 2001) and different scenario results from the Millenium Ecosystem Assesment (MA) (2005), which are also based on the IMPACT model at IFPRI.
Growth rates
observed in the past
are more than twice
as high as those
projected for the
future
Past growth rates
in agricultural
production has often
been accompanied
by the unsustainable
exploitation of
natural resources
Corn is one of the most important staple foods worldwide. Adequate conservation and storage techniques are needed to reduce postharvest losses.
Figure 2.5:
World Cereal Production 1960–2050
Source: IAASTD (2009: 295).
Figure 2.6:
World Meat Production 1995–2050
Source: IAASTD (2009: 297).
Figure 2.5 and 2.6 show that deviations between the IFPRI and FAO projections are very small. Deviations among the MA scenarios are somewhat larger, especially for meat, which is because of strongly differing scenario assumptions, including sub-stantial differences in per capita income, which has greater impacts on meat than on cereal consumption.
More recent projections based on the IMPACT model foresee a total increase in cereal production between 2000 and 2050 by 48 % (own calculations based on Msangi and Rosegrant, 2009: 30, Figure 3), being equivalent to an annual growth rate of 0.79 %. This is a slightly more moderate estimate than FAO projections (Bruinsma, 2009), foreseeing an increase of cereal production by 49.6 % between 2005/07 and 2050, being equivalent to an annual growth rate of 0.88 %.
2.5 Political Conclusions Drawn by FAO from the Results
The FAO reports are quite modest with regard to policy conclusions. The initial report (Bruinsma, 2003), for example, has no chapter focussing on conclusions with policy relevance, and most conclusions formulated in the individual chapters on world food projections are rather technical. One conclusion with strong political implications is that it is very unlikely that the World Food Summit target of halving undernourish-ment by 2015 would be met, even by 2030 (FAO, 2006: 4).
Bruinsma (2009) contains more pronounced conclusions: he sees an improvement in the global food balance by 2050, and asserts that the world as a whole could produce enough food for all by that time. But he also hints at the remaining regional dispari-ties which will leave large population groups in many countries undernourished (Bruinsma, 2009: 3). Furthermore, Bruinsma highlights the importance of increasing agricultural production within food insecure countries in order to match local de-mand due to often limited import capacities (ibid: 29). It is also stressed that “the pro-jected increases in yields, land and irrigation expansion will not entirely come about spontaneously (i.e. driven by market forces), but require huge public intervention and investments, particularly in agricultural research and in preventing and mitigating environmental damage” (ibid: 3). Investment requirements have been quantified by Schmidhuber et al. (2009), who estimate that of the investments required to maintain the capital stock of the years 2005/2007, an additional 65 % will be needed by 2050 to reach the projected 70 % PI.
Despite the rather modest and technical policy conclusions made by the FAO, the projections have been used to argue for a tenfold increase in agricultural development aid by Jacques Diouf, Director General of the FAO (Financial Times, 2008), as well as to argue for more investment in agriculture. Moreover, the projections are often cited in the public debate over hunger reduction (e.g. FAO, 2009b).
Ultimately, it appears that the FAO may have taken the position of arguing for a 70 % increase in production as it seems to be a less controversial position than calls for alternate or additional measures to reduce hunger, and is likely to have few opponents and strong supporters. Other policy recommendations such as those for income re-distribution, better governance in countries with a high prevalence of food insecurity, changes in diets in industrialized countries, the reduction of postharvest losses or bioenergy subsidization would have been likely to raise more opposition.
2.6 Conclusions from the FAO World Food Projections
The FAO projections are based on solid analysis and an enormous amount of expert knowledge and country specific data. Furthermore, they are roughly in line with projec-tions by other instituprojec-tions. Due to the intransparent presentation and insufficient docu-mentation of assumptions and methodology, however, it is almost impossible to trace the results in light of the assumptions made. As many of the assumptions are unknown, it is impossible to evaluate their validity compared to any alternatives. For example, it is not clear to what extent FAO takes into account increasing demand for bioenergy. The assumed average global income growth rates for 2030 to 2050 are high compared to the past and may result in an overestimation of future demand. On the other hand, the effects of climate change are not yet considered in the projection of global supply. Climate change may put further pressure on the world food balance.
it is not clear to
what extent the Fao
takes into account
increasing demand
for bioenergy
FAO communications and media coverage surrounding the world food projections have strongly focused on the need to increase global agricultural production in order to assure world food security. In this study, however, we discuss other measures which could be implemented to increase global food availability: the reduction of postharvest losses, the limiting of policy support for bioenergy in industrialized countries and the lowering of meat consumption in industrialized countries. Such efforts would help to improve the global food balance and prevent global food prices from increasing to a level that would result in increasing food insecurity and poverty for people who spend a high share of their income on food.
But is the link between the global availability of food and undernourishment really that strong? Amartya Sen formulated the relevance of food availability for food secu-rity three decades ago as follows:
“Starvation is the characteristic of some people not having enough food to eat. It is not the characteristic of there being not enough food to eat. While the latter can be a cause of the former, it is but one of many possible causes” (Sen, 1981: 1).
This notion has become widely accepted and is reflected in mainstream access-based definitions of food security as “[a situation in which] all people, at all times, have physical, social and economic access to sufficient, safe and nutritious food that meets their dietary needs and food preferences for an active and healthy life” (FAO, 2010). This definition stands in sharp contrast to earlier definitions which focused on the availability of food, but not on individual access to food, with food security being de-fined as: “availability at all times of adequate world food supplies of basic foodstuffs to sustain a steady expansion of food consumption and to offset fluctuations in produc-tion and prices” (United Naproduc-tions, 1975).
In conclusion, undernourishment is not a problem of global food availability, but of access to food. And in the overwhelming majority of cases, it is the economic access to food that stands in the way of food security: Poverty is the main reason for food inse-curity. The following facts underline the observation that food availability at a global level is not the main problem at all, but rather that hunger is a problem of economic access to food, and thus of its distribution:
» Per capita food consumption was 2789 kcal/person/day in 1999/2001 (Bruinsma, 2009: 8) which was more than 50 % above the FAO estimated undernourishment threshold of 1840 kcal/person/day (ibid: 15).
» Per capita food consumption is projected to reach 3130 kcal/person/day by 2050 (Bruinsma, 2009: 8) which would be 64 % above the FAO estimated undernourish-ment threshold of 1913 kcal/person/day (ibid: 15).
» Periods of high “global availability” of food are reflected in low world market prices, as was seen, for example, in the mid-1980s and late 1990s. Yet even during such periods, hunger was not significantly reduced but the number of people suf-fering from hunger remained at a level above 750 million (FAO, 2010: 9).
on the interdependencies
of Global agricultural
Production and Hunger
3
daily per capita food
consumption was
at 2789 kcal
in 1999/2001 –
the Fao estimated
undernourishment
threshold is
1840 kcal
Undernourishment
is not a problem of
global food
availability, but
of access to food.
Poverty is the main
reason for food
insecurity
Thus, increasing agricultural production, reducing losses or decreasing demand in regions with a low prevalence of undernourishment would only have indirect and lim-ited impacts on the prevalence of hunger. Such measures lead to lower world market prices (provided the region concerned is integrated into world markets). This, in turn, lowers the import bill of net food importing countries and, if prices are transmitted to regions with a high prevalence of undernourishment, improves the food status of net food buying households. This assertion, however, needs to be qualified for several reasons:
» The overall effect is likely to be low. If, for example, cereal production in indus-trialized countries increased by 10 %, this would be equivalent to an increase in global production by 3.7 % (production shares as projected for 2050 in Bruinsma, 2009). Assuming an own price elasticity of global supply of 0.5 and of global de-mand of -0.2, the resulting decline in world market price would be about 11 %. This is a small price movement compared to the observed cereal price variations over the last few years, which have fluctuated between 90 US $/t and about 250 US $/t for wheat on an annual average (FAOSTAT, 2011).
» The relationship between international prices and prices at the household level in food insecure regions is often not very direct (see Winters, 2002, for a framework to analyze the linkages between international prices and poverty and Winters et al., 2002, for a summary of the empirical evidence). The transmission of world market prices to domestic prices and to remote regions within countries is in particular often far from perfect.
» It is not only that net food purchasing households are positively affected by lower prices, but also that net food selling households are negatively affected. Empirical evidence suggests that the majority of poor households are net food buyers, but this does not hold for all countries/regions (Ivanic and Martin, 2006; Aksoy and Isik-Dikmelik, 2008).
In conclusion, improving the global availability of food is only a very indirect means of reducing hunger. The main bottleneck to food security is instead the reduction of poverty. What is needed is investment in rural infrastructure, agricultural research and public services, as well as efforts to improve governance systems and institutions which allow markets to work within food insecure regions. Finally, efforts focussing on poverty reduction are most important, including improving the ability of the poor to access education, land, employment and other income sources as well as to public services such as social safety nets and medical care (von Braun, 2007; Heidhues, 2008).
An increase in agricultural production is of importance mainly within the regions subject to food insecurity and mainly among those affected by food insecurity – namely, agricultural smallholders.2 Here increasing production can have the dual
effect of lowering prices and increasing food availability for food purchasers, and of generating additional income for food producers. The relevance of food produc-tion within food insecure regions is also emphasized in the various FAO studies (e.g. Bruinsma, 2003: 45-50, Chapter 8). But even here the focus must be on poverty reduction: if higher incomes from agriculture accrue to only a few landowners with little trickle down effects, higher agricultural production may have little effect on reducing hunger.
increasing
agricul-tural production,
reducing losses or
decreasing demand
in regions with a
low prevalence of
undernourishment
has only indirect and
limited impacts on
the prevalence of
hunger
the main bottleneck
for food security
is the reduction of
poverty
These arguments hold not only for the effects of increasing agricultural production on hunger, but also for the effects of any measure affecting the global food balance. More specifically:
» A decline in postharvest losses in food secure regions (see Section 4.2) is likely to have only a modest and indirect effect on global undernourishment, just as a decline in meat consumption (Section 4.3) or a decline in bioenergy production (Section 4.1) in food secure regions.
» In contrast, the reduction of postharvest losses within food insecure regions is likely to have stronger effects on undernourishment: it increases food availability for food buyers as well as income for food sellers.
the reduction of
postharvest losses
in food insecure
regions increases
food availability for
food buyers as well
as income for
food sellers
Different crops have different postharvest characteristics: grains and pulses (durables) can have a storage life of several years, roots and tubers (semi-perishables) have a shelf life of weeks to several months. For fresh fruit and vegetables shelf life can be very short.
4.1 Introduction
There are two strong arguments in favor of searching for alternatives to increasing global agricultural produc-tion in the effort to improve the world food balance. First, exploring additional options will increase the overall potential for improving the world food balance. And second, increasingly scarce natural resources such as water, land, biodiversity, and fossil energy suggest that an exclusive focus on increasing agricultural production is problematic.
Many options to improve the world food balance exist, both on the demand and supply side. One option which could be easily implemented and would have direct and significant effects would be to abolish the policies to enhance demand for first generation liquid biofuels in the EU, US and other countries. Furthermore, other poli-cies that enhance the demand for biomass for energy production should be strongly narrow political interests. Moreover, indirect many cases policies which are currently in place are motivated by interests of vested lobbies and indirect effects on land use and the global food situation are not sufficiently taken into account. We do not discuss the reduction of biofuel subsidies in detail, as it has been addressed in many papers recently. Nevertheless, we consider the revision of bioenergy policies as a self-evident option for improving the global availability of food. The following points summarize key findings of recent literature:
» Demand for biomass for energy production has a strong impact on the world food balance. This impact is expected to increase, mainly due to ongoing political ef-forts to increase demand for biofuels.
» Increasing demand for biofuel has the potential to strongly contribute to higher global prices for agricultural products (Rosegrant, 2008; Banse et al., 2008; Banse and Grethe, 2008; OECD, 2006; Fischer 2009).
» Higher world market prices cause substantial indirect land use changes as crop lands expand around the world as a response to the increasing demand for bio-fuels (Fischer, 2009).
» It has been found that the production of certain forms of bioenergy such as liquid fuels in the US and EU could even increase global GHG emissions if direct land use effects are taken into account (Searchinger et al., 2008; WBGU, 2008). » Overwhelming scientific evidence suggests that the political support for first
gen-eration biofuels should be ended (Wissenschaftlicher Beirat beim BMELV, 2007; WBGU, 2008).
Furthermore, a more equitable distribution of food, which could be achieved with a more equitable distribution of income, has a high potential to decrease hunger. Bruinsma (2003) shows that at an average national consumption level of 2300 kcal/ person/day, a reduction in the coefficient of variation3 of food distribution from 0.3 (a
typical value for developing countries with high inequality) to 0.2 (a typical value for industrialized countries) has the same effect on the reduction of undernourishment as an increase in average national calorie availability by 14 % (own calculations based on Bruinsma [2003: 44]; coefficients of calorie distribution from FAOSTAT [2011]).
alternatives to improving the
world Food Balance
4
a more equitable
distribution of
income has a high
potential to
decrease hunger
3 The coefficient of variation is a dimensionless statistical measure which relates the standard