Executive summary.
Although defined-maturity bond funds (DMFs)
made up significantly less than 1% of the $3.3 trillion U.S. bond fund
market as of June 30, 2013,
1DMFs have experienced notable growth in
recent years. Investors who adopt DMFs may be provided an alternative
means to build bond portfolios by targeting specific maturities or creating
“ladders” of multiple DMFs.
DMFs combine key features of both individual bonds and bond funds.
Similar to individual bonds, DMFs have a known maturity date, and
they return proceeds akin to principal in the form of the final investment
value, while—like traditional bond funds—providing greater diversification
potential than individual bonds. In examining the potential role of DMFs
in investors’ fixed income portfolios, this paper incorporates the approach
of previous Vanguard research (Bennyhoff, Donaldson, and Tolani, 2012)
comparing individual bond portfolios and bond funds.
Vanguard research January 2014
1 Sources: Morningstar, Inc., and Bloomberg, as of June 30, 2013.
Defined-maturity
bond funds
Authors
Joel M. Dickson, Ph.D. John H. Escario, CFA Samantha S. Choa
Our basic conclusions about the role of DMFs are:
• Similar to individual bonds, DMFs may prove helpful to investors wanting
to “pre-fund” predictable future liabilities.
• A laddered portfolio of DMFs is likely to have characteristics similar to
that of a comparable traditional bond fund. However, a ladder’s interest
rate sensitivity may experience greater volatility, which could result in
opportunity costs and affect asset allocation.
• Relative to traditional bond funds, a DMF ladder exhibits more concentrated
reinvestment risk because maturity proceeds are typically reinvested all at
once in a new maturity rung.
• Investors purchase DMF exchange-traded funds (ETFs) at market price, but
receive net asset value (NAV) at maturity. The difference in these amounts
represents a sometimes unrecognized cost that investors may incur.
• Although currently available DMFs offer investors another way to manage
duration and maturity exposure, combining traditional bond funds may achieve
similar results while offering a wider range of maturity or duration targets.
Notes on risk: All investing is subject to risk, including possible loss of principal. Past performance does not guarantee future results. Bond funds are subject to interest rate risk, which is the chance bond prices overall will decline because of rising interest rates, and credit risk, which is the chance a bond issuer will fail to pay interest and principal in a timely manner or that negative perceptions of the issuer’s ability to make such payments will cause the price of that bond to decline. Diversification does not ensure a profit or protect against a loss. U.S. Treasury securities are guaranteed as to the timely payment of principal and interest. However, U.S. government backing of Treasury or agency securities held in a mutual fund applies only to the underlying securities and does not prevent share-price fluctuations. Some or all of the income from Treasury obligations held in a fund may be exempt from state or local taxes.
Defined-maturity funds (DMFs) have garnered substantial attention since early 2010, and their assets have grown accordingly. DMFs can be considered a cross between individual bonds and bond funds, and are viewed by some as an alternative product for building fixed income portfolios. This paper aims to guide investors
who are examining the trade-offs of using DMFs versus traditional bond funds in constructing portfolios. We identify key factors to consider when making this decision, including management of cash flow, portfolio characteristics, control, and cost.
2 Benham Group, now part of American Century Investments, launched a series of zero-coupon U.S. Treasury bond funds with target maturities in March 1985 (Klug, 1995).
3 Other monikers for DMFs include target-maturity, target-date, and bullet-bond funds.
4 We provide a general overview of the index methodology used by many defined-maturity bond funds. For more specifics, refer to Accretive Asset Management (2012a, 2012b) and S&P Dow Jones Indices (2012).
What is a defined-maturity bond fund?
Since their launching nearly 30 years ago in 1985,2 DMF mutual funds have existed as a small
subsegment of the mutual fund and, more recently, ETF landscapes. Current offerings target different areas of the bond market, including corporate, government, high-yield, and municipal securities. Whether in mutual fund or ETF form, these products are fixed income investments and should not be confused with asset allocation strategies such as target-maturity, target-date, or target-risk funds— despite names for DMFs that seem to overlap with these strategies.3
What is the investment strategy and how does it work?
DMFs attempt to combine in one product the perceived “best” features of individual bonds—such as known maturity date and return of principal in the form of final investment value—with the diversification
benefits associated with mutual funds and ETFs. Morningstar, the investment research firm, describes the strategy used by DMFs as a portfolio designed to have securities within maturities and/or durations that are highly concentrated at one point of the yield curve; colloquially, the approach is known as a “bullet” strategy.
Although DMFs share some similarities with both individual bonds and traditional bond funds, there are differences in their mechanics and behavior due to their hybrid construct. Figure 1 provides a high-level overview of a DMF over its life cycle (in this case, a hypothetical 5-year fund).4
A small, but growing subset of fixed income funds/ETFs
With total assets under management of $4.0 billion across mutual funds and ETFs, DMFs currently make up significantly less than 1% of the $3.3 trillion Figure 1. Life cycle of hypothetical DMF
6
Cash flows reinvested until maturity nears D u ra tion ( ye ar s) 0 1 2 3 4 5 DMF established1
Constituents change because of index reconstitutions and portfolio management
2
Duration declines over time
3
Income and capital gains periodically distributed
4
NAV fluctuates
5
Final NAV, income, and capital gains distributed
7
0 20 40 60 80 100% P er ce n ta g e c as h e xp o su re
0 6 12 18 24 30 36 42 48 54 60
Months
Notes: This figure’s hypothetical example does not adjust cash levels for the receipt of interest income, because we are assuming interest income would be paid out through monthly income distributions. However, in between distribution periods, interest income may lead to higher cash exposure. Note also that positive cash flows from investor activity and maturing bonds are generally reinvested into the DMF’s underlying securities. Once the DMF nears maturity, though, cash flows are typically no longer directed toward reinvestment but, rather, are held in cash equivalents.
U.S. bond fund market. However, assets in DMFs roughly quadrupled—to $4.0 billion—from January 1, 2010, through June 30, 2013 (see Figure 2a–c). Recent DMF growth has been almost exclusively driven by ETF products. As shown in the figure, ETFs represented 80% of total DMF assets as of June 30, 2013. Specifically since early 2010, investors generally targeted higher-yielding investment-grade corporate and high-yield-focused DMFs, which are currently only available in ETF form.
How are investors potentially using DMFs?
We explore three potential uses of DMFs often cited for investors. These approaches parallel the discussion of individual bonds versus bond funds by Bennyhoff et al. (2012).
Protect against rising interest rates. Investors worried about rising interest rates may believe that investing in individual bonds or DMFs protect them from loss through the return of principal. Indeed, individual bonds are commonly touted for this feature relative to bond funds. However, the benefit is more emotional in nature, rather than economic. If interest rates rise, the price of both individual bonds and DMFs will fall to a level at which their yields to maturity are at parity with those of a newly issued bond with similar characteristics.
Immunize a known future liability. When individual bonds and DMFs mature, they provide cash flow at a known point in time. Traditional bond funds do not have a fixed maturity date, so the value of the fund at a future point is uncertain. When an investor has a predetermined future spending need, and in particular if it is near-term, an individual bond with a maturity date that matches this liability may be preferable to a traditional bond fund. Alternatively, investors may “pre-fund” these known obligations using DMFs. There is some degree of variability in the amount that a DMF returns at maturity. However, in these cases, DMFs may provide better cost-effective access to a more diversified corporate, high-yield, or municipal bond portfolio than an investor could build on his or her own, assuming a risk spread over U.S. Treasuries is desired.
Construct a bond ladder in an alternative way.
Some investors build strategic fixed income allocations using series of individual bonds across different maturities and then reinvest maturing proceeds into additional bonds. They may believe that directly managing bond portfolios using strategies like bond ladders offers more control than using traditional bond funds. One drawback of this approach, as noted in Bennyhoff et al. (2012), is that diversification is often difficult to achieve without a very large asset pool. Such an approach could potentially be enhanced through the use of DMFs with broader asset bases to diversify across bonds in credit-sensitive areas of the fixed income market.
Key terms
Duration. A measure of the sensitivity of bond— and bond mutual fund—prices to interest rate movements. For example, if a bond has a duration of 2 years, its price would fall about 2% when interest rates rose 1 percentage point. On the other hand, the bond’s price would rise by about 2% when interest rates fell by 1 percentage point.
Yield to maturity. The rate of return an investor would receive on a bond or a bond fund if the fixed income securities were held to their maturity dates, assuming that coupon payments are reinvested at the same rate as their bonds’ current yields.
Yield to worst. The lowest possible yield that can be received on a bond or a fund’s bond holdings in the absence of default, this includes using worst-case scenarios if optional provisions were to be exercised by the issuer and resulted in the most conservative yield calculation.
DMF industry overview in United States: January 1, 2010–June 30, 2013 Figure 2.
a. DMFs are more concentrated in ETFs, the corporate sector, and short-term maturities
Assets under management
Number of products (AUM, $ billions)
ETFs Mutual funds Total ETFs Mutual funds Total
Total 24 8 32 $3.2 $0.8 $4.0
By sector
Corporate 12 0 12 $1.7 — $1.7
Government 0 3 3 — $0.6 $0.6
High-yield 6 0 6 $1.2 — $1.2
Municipal 6 5 11 $0.3 $0.2 $0.5
By maturity
Short-term (0–5 years) 20 3 23 $3.0 $0.3 $3.3
Intermediate-term (5–10 years) 4 4 8 $0.2 $0.3 $0.5
Long-term (10+ years) 0 1 1 — $0.2 $0.2
Fixed income mutual fund
as of June 30, 2013
Fixed income ETF
as of June 30, 2013
DMF
as of June 30, 2013
$3,046B AUM
99.97%
1.3%
0.03%
$251B AUM
98.7%
$4B AUM
19.6%
80.4% ex-DMF
DMF ETFMutual fund
ex-DMF DMF
b. DMFs represent a small portion of both fixed income mutual fund and ETF assets (in $ billions)
C
as
h fl
o
w (
$ b
ill
io
n
s)
ex-DMFs DMFs 0
100 200 300 $400
$258.5B
$171.1B
$371.2B
$63.8B
$0.3B $0.8B $1.0B $1.1B
2010 2011 2012 June 30, 2013
c. Cash flows into DMFs are small compared with those into traditional bond funds
Comparing a DMF bond ladder versus a traditional bond fund
To illustrate the key characteristics of DMF bond ladders versus traditional bond funds, we built and maintained a hypothetical DMF ladder over a forecasted five-year period. The DMF ladder was compared with the Barclays U.S. 1–5 Year Corporate Bond Index (hereafter, “Index”), which served as a proxy for a traditional corporate bond index fund. Using a starting date of June 30, 2013, we created an equally weighted, five-maturity-rung DMF ladder to provide an example akin to the initial characteristics of the Index. Each hypothetical DMF rung was formed using securities from the Barclays U.S. Corporate Bond Index (hereafter, “Universe”), and the DMF ladder was maintained by annually reinvesting maturing DMF rungs into the next rung five years
out.5 The Index is a subset of the Universe, which
provides the future rungs and securities that ultimately roll into the ladder strategy and the Index.6 Our
process reflects that the majority of DMFs are short-term, maturing within the subsequent five years.
Managing portfolio characteristics and cash flows
A comparison of the initial portfolios indicated that the DMF ladder and the Index (see Figure 3) shared similar characteristics across duration, yield, and credit quality. Differences in the number of securities were largely a result of maturity criteria and the number of rungs used. For example, the DMF ladder included all of the issues maturing in 2014, whereas the Index did not, because more than half of those bonds did not meet the Index’s minimum 12-month
5 An alternative way to view a fixed income index is as a bond ladder consisting of several rungs of maturities weighted by market capitalization. By conducting an analysis of corporate DMFs, we confirmed both our methodology and our belief that the Barclays U.S. 1–5 Year Corporate Index would offer a suitable comparison to the hypothetical DMF ladder; we found that the underlying holdings of the corporate DMFs were also largely constituents of the Index. For example, more than 96% of the security weightings held in Guggenheim BulletShares 2016 Corporate Bond ETF were found in the Index. Note that different DMF providers may vary in terms of when their respective product matures during the year; these differences should be accounted for when building a DMF ladder.
6 To facilitate our analysis, we simulated prices and characteristics over a five-year forward period for the constituents of the Barclays U.S. Corporate Index (the “Universe”) along with the bonds maturing in 2014 that had been removed from the Universe using a start date of June 30, 2013. The simulated data were derived using the terms of the underlying bond issues and their prices as of the start date as well as an assumed zero change in interest rates. We then built a series of hypothetical DMFs, each maturing sequentially by calendar year, from this dataset. In turn, the hypothetical DMFs were used to construct the DMF ladders referenced throughout this section. In addition, when comparing the DMF ladder with the Barclays U.S. 1–5 Year Corporate Bond Index (the “Index”), we used the Index for the initial June 30, 2013, period. For the forecasted, five-year comparison, we maintained the Index by rolling securities on a periodic basis to remove those with less than 1 year of maturity and add securities falling within the 5-year maturity limit.
DMF ladder Barclays U.S. 1–5 Year Corporate Index
Characteristics (five rungs based on five calendar years) (four rungs based on four-year rolling period)
Effective duration 2.7 years 2.9 years
Yield to worst 1.8% 1.9%
Credit rating A3 A3
Number of securities/full rungs 2,153 1,772
Subsector exposure (%)
Financial institutions 43.1% 44.9%
Industrial 49.3% 48.0%
Utility 7.6% 7.1%
Note: All data are as of June 30, 2013.
Sources: Vanguard, based on data from FactSet and Barclays. Index data are from Barclays Global Family of Indices. Copyright 2013, Barclays. All rights reserved.
The initial portfolio characteristics of an equal-weighted DMF ladder and Barclays U.S. 1–5 Year Corporate Bond Index are similar
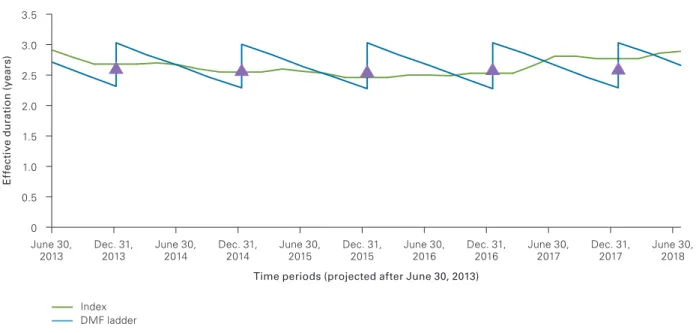
maturity requirement. Also, the DMF ladder had exposure to five rungs of calendar-year-based maturity, whereas the Index owned four rungs covering a four-year rolling window of maturity. Over time, though, certain characteristics of the DMF ladder may be less stable than the Index. In particular, although the DMF may have interest rate sensitivity, or duration, that is closer to that of the Index at inception, the DMF portfolio’s duration declines while the Index duration remains relatively stable (see Figure 4). As each DMF rung nears maturity, the ladder’s overall duration declines. In December of each year, when the liquidated assets of the maturing DMF rung are reinvested into the next rung of maturity five years out, the ladder’s duration rises above that of the Index.
Investors should consider the DMF’s declining duration profile against the broader context of its impact on the total portfolio’s level of interest rate sensitivity relative to the Index and asset allocation.
Traditional, index-based bond funds, for example, may remove bonds with less than 1 year of maturity and invest in new issuances across later maturities, thereby maintaining a more constant duration exposure, whereas DMFs typically hold their bonds to maturity. The declining duration profile of a DMF, however, may lead to lower duration stability in a DMF bond ladder and a higher cash allocation in the investor’s total portfolio relative to a traditional bond fund.
DMFs may also exhibit more concentrated reinvestment risk versus that of a traditional bond fund because the entire proceeds from a maturing DMF would need to be simultaneously reinvested into a new rung. In contrast, a traditional bond fund is effectively a packaged bond ladder in which the portfolio manager, rather than the investor, is responsible for these maintenance activities and is reinvesting the proceeds continually as holdings are sold or mature.
Figure 4. Duration profile of a DMF ladder may be less stable than that of Barclays U.S. 1–5 Year Corporate Bond Index
Comparison of portfolio duration
E
ff
ec
ti
ve
d
ur
at
io
n
(
ye
ar
s)
0 0.5 1.0 1.5 2.0 2.5 3.0 3.5
June 30,
2013 Dec. 31,2013 June 30,2014 Dec. 31,2014 June 30,2015 Dec. 31,2015 June 30,2016 Dec. 31,2016 June 30,2017 Dec. 31,2017 June 30,2018
Index DMF ladder
Time periods (projected after June 30, 2013)
▲
▲
▲
▲
▲
Note: All data are as of June 30, 2013, and forecasted five years forward.
Control
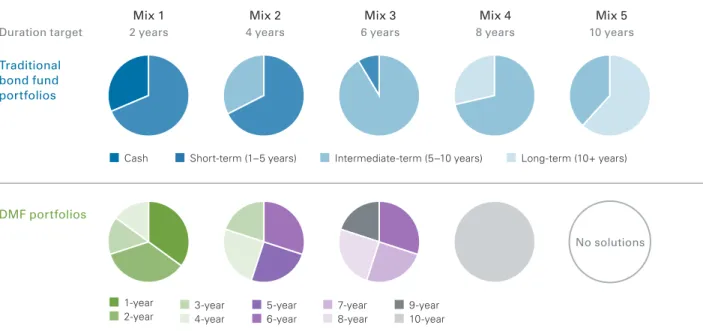
An investor may be able to customize maturity and duration exposures with either DMFs or traditional bond funds. Figure 5 illustrates how duration can be targeted using either approach. DMFs primarily cover short- to intermediate-term maturities (of 1–10 years) with concentration in the 0–5-year range; this underscores some of the limitations that investors may experience when trying to build a customized solution using DMFs, especially when targeting a longer duration.
Costs
The underlying investment strategy is similar for DMFs, regardless of the investment vehicle. However, the trading differences between mutual funds and ETFs result in different total
cost breakdowns, which need to be considered when conducting cross-comparisons. For instance, in addition to the expense ratio, ETF investors individually bear the full trading cost of their personal transactions, including bid-ask spreads and premiums/discounts. For mutual fund investors, similar costs are internally borne by the fund and all of the fund’s shareholders on a pro rata basis. Commissions may also be an additive cost component for ETFs; they also have a similar impact as the loads or purchase fees charged by some mutual funds. As a result, investors seeking to understand the cost implications of building bond portfolios using DMFs versus traditional bond funds should consider total costs, including the differences between mutual funds and ETFs.
Figure 5. Traditional bond funds may give investors greater control over key portfolio characteristics such as duration
1-year
2-year 3-year4-year 6-year
7-year 8-year
9-year 5-year
10-year
Cash Short-term (1–5 years) Intermediate-term (5–10 years) Long-term (10+ years)
Mix 1 Mix 2 Mix 3 Mix 4 Mix 5
Duration target 2 years 4 years 6 years 8 years 10 years
Traditional bond fund portfolios
DMF portfolios
No solutions
Notes: Using data as of June 30, 2013, the Barclays U.S. 1–5 Year, 5–10 Year, and 10+ Year Corporate Bond Indexes represent traditional short-, intermediate-, and long-term bond funds, respectively. To create each DMF portfolio, we initially equal-weighted a four-rung ladder. We then reweighted positions using 5-percentage-point increments starting with the earliest maturing and latest maturing rungs, then moving to the two rungs in the middle until the target duration was achieved. (See Bennyhoff and Zilbering [2010], for a more detailed discussion of duration).
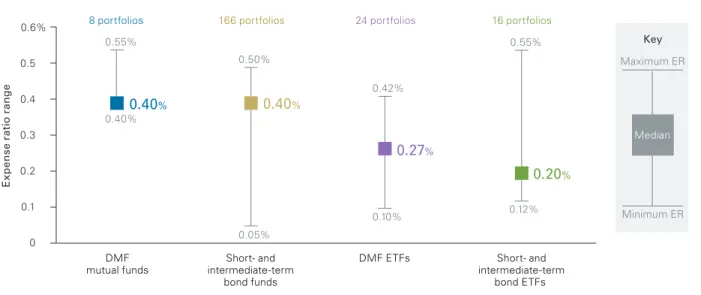
Expense ratios. Overall, DMFs have similar to slightly higher expense ratios relative to traditional bond funds. However, DMF mutual funds tend to have higher expense ratios than their ETF counterparts (see Figure 6). Currently, DMF mutual funds have a median expense ratio of 40 basis points, which matches that of traditional bond mutual funds. Traditional bond mutual funds, though, have a wider expense-ratio range and a lower minimum (that is, 5–50 basis points) relative to DMF mutual funds (40–55 basis points).7 DMF ETFs have a median
expense ratio of 27 basis points, which is higher than the 20-basis-point median for traditional bond ETFs. However, traditional bond ETFs have a wider range and a higher minimum (12–55 basis points) than DMF ETFs (10–42 basis points). Lower relative expense ratios and greater accessibility of ETFs to investors may have acted as tailwinds in the increased flow of assets into DMF ETFs versus DMF mutual funds as well as the greater proliferation of DMFs in the ETF structure.
Externalized ETF trading costs. Trading costs are incremental to expense ratios for ETFs and primarily comprise bid-ask spreads and premium/ discounts to NAV (net asset value). Bid-ask spreads reflect the compensation that market makers receive for creating a market for a trade. Key drivers of the bid-ask spread include liquidity of the ETF and its underlying securities. Premiums and discounts reflect the supply-demand dynamics of an ETF and its underlying holdings when a trade takes place. Bid-ask spreads are embedded in an ETF’s premium or discount to NAV in terms of the market price paid by an ETF investor. We assessed the premium/ discount behavior of DMF ETFs to measure their potential effect on total cost.
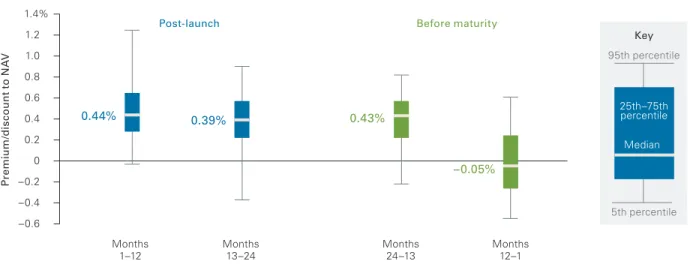
All DMF ETFs are purchased at market price, whereas final distributions at maturity are priced at NAV. We examined DMF ETF premium/discount behavior during two time periods: (1) the 24 months post-fund launch and (2) the 24 months pre-fund
7 As of June 30, 2013, there were only eight DMF mutual funds offered through two fund providers. Five of the funds had an expense ratio of 40 basis points, while three had an expense ratio of 55 basis points.
Figure 6. Median expense ratios for DMFs and comparable traditional bond funds
0 0.1 0.2 0.3 0.4 0.5 0.6%
DMF
mutual funds intermediate-termShort- and
bond funds
DMF ETFs Short- and
intermediate-term bond ETFs
0.40% 0.55%
0.40%
Maximum ER
Minimum ER
Median
Key
8 portfolios
0.40%
0.50%
0.05% 166 portfolios
0.27% 0.42%
0.10% 24 portfolios
0.20% 0.55%
0.12% 16 portfolios
E
xp
en
se
r
at
io
r
ange
Note: ER = expense ratio.
maturity. Figure 7 captures our analysis, indicating that DMF ETFs tended to trade at a premium to NAV during most of the periods when they typically are purchased by investors. However, their market prices tended to converge toward NAV in the final 12 months as they approached maturity. The
implication for investors is that DMF ETFs purchased at a premium can adversely affect overall returns, while those purchased at a discount may enhance returns if held to maturity. Premiums may reduce the returns for a DMF ETF ladder not only at portfolio implementation but also subsequently as cash flows from dividends, capital gains, and proceeds from maturing DMFs are reinvested.
Total impact of cost on returns
This subsection focuses on short-term DMFs, given the concentration of assets, products, and cash flows into this category. The expense ratio and premium/discount data (where applicable) of short-term DMFs served as the cost inputs as we quantified the trade-offs between a DMF ladder and a traditional bond fund by estimating the impact of total costs on investor returns.8
In addition to their expense ratios, DMF ETFs have trading costs that are amortized over the investment period, which can be quantified and aggregated to understand the net impact on the investor’s return. Figure 8 compares measures of expected returns and “all-in” costs for a DMF ladder with a short-term bond fund over a five-year
8 Although these data are a subset of the funds and ETFs from the previous subsection on costs, the median results are very similar to those for the entire population. To estimate representative costs for DMF mutual funds and ETFs and their respective traditional bond-fund peer groups, we included only short-term products from the appropriate categories. For ETFs, only those with fixed income maturities within the 0–5-year band were considered, so long as they had one year’s worth of trading history through June 30, 2013, and were not in their last year of maturity in the case of DMFs. The median expense ratio for the short-term DMF ETF was 30 basis points as of June 30, 2013, which was higher than the 20-basis-point median expense ratio for short-term traditional bond-fund ETFs as of the same date. The short-term DMF ETFs had a median premium of 34 basis points as of June 30, 2013, which exceeded the 21-basis-point premium for short-term traditional bond-fund ETFs. The median ETF premium-to-NAV was amortized over the period in which the ETFs were held.
Figure 7. Median DMF ETF premiums/discounts 24 months post-launch and before maturity
P
re
m
iu
m
/d
is
co
u
n
t t
o N
A
V 95th percentile
5th percentile
25th–75th percentile
Median
Key
Post-launch Before maturity
–0.6 –0.4 –0.2 0 0.2 0.4 0.6 0.8 1.0 1.2 1.4%
0.44% 0.39% 0.43%
–0.05%
Months
1–12 Months13–24 Months24–13 Months12–1
Notes: For the 24-month post-launch period, we calculated the median of the ETF premiums and discounts to NAV for all DMF ETFs launched from January 1, 2010, through June 30, 2013, by using the launch date as a common starting point and then aligning up to 24 months of daily data. For those DMF ETFs that matured, we used the maturity date as a common end point and then aligned daily data going 24 months back to calculate the median.
investment horizon. Although the before-cost returns for DMF mutual funds and ETFs as well as traditional bond mutual funds may be similar, the impact of total costs appears to be higher for a DMF ETF-based portfolio relative to a traditional bond ETF. Over a five-year investment horizon, the total cost for a DMF mutual fund bond ladder and traditional bond mutual funds was similar, at 40 basis points. However, the combined expense ratio and trading costs for DMF ETFs (41 basis points) was higher than for traditional bond ETFs (24 basis points).
The maintenance of a DMF ETF bond ladder includes the cost of continuously reinvesting maturity proceeds (at NAV from the maturing fund) into a new DMF rung. If a premium-to-NAV persists (that is, the market price exceeds that of NAV) for both DMF and traditional bond ETFs, the impact of the premium becomes a perpetual cost component for
the DMF ladder for investors seeking to maintain their bond exposure. In aggregate, the premiums paid may result in higher effective costs for investors relative to a traditional bond index ETF because of the additional market-based transaction costs. When the reinvestment of proceeds from maturing DMFs occurs, paying a premium-to-NAV would reduce the net amount reinvested. In contrast, a buy-and-hold investor pays the premium-to-NAV for a traditional bond ETF only once, and so the impact of the premium declines over time. Figure 8 indicates that the amortized premium impact for the DMF ladder is 10 basis points, versus 4 basis points for the traditional bond ETF, for a five-year holding period. If this period were extended to ten years, the DMF ladder would still experience an 11-basis point reduction in returns, but the traditional bond ETF’s premium impact would fall to 2 basis points. Figure 8. “All-in” costs for a DMF bond ladder are often higher than those for a traditional bond ETF
N
et a
cq
u
is
it
io
n y
ie
ld a
n
d c
o
st
s
0 0.5 1.0 1.5 2.0%
DMF bond ladder—
Mutual funds Index—Mutual funds ladder—ETFsDMF bond Index—ETFs
Net acquisition yield Expense ratio
Amortized premium impact
Notes: Median expense ratios and amortized median trading-cost estimates (for ETFs) were calculated for the DMF and traditional bond-fund peer groups by product structure over a five-year investment horizon. Using the gross yield to worst of the DMF ladder as of June 30, 2013, as a common starting point, we then deducted these costs to illustrate the impact on net acquisition yield. The impact of commissions was not included in our analysis.
Sources: Vanguard calculations, based on data from Bloomberg, Morningstar, Inc., FactSet, and Barclays. Index data are from Barclays Global Family of Indices. Copyright 2013, Barclays. All rights reserved.
The negative impacts of paying a premium-to-NAV would also apply to income reinvestment. Although both DMF and traditional bond ETFs may be affected by premium/discounts when income distributions are reinvested, a DMF ladder may face additional cost hurdles when these positions mature and are rolled into new rungs. Interest-on-interest compounding generally represents the largest component of a bond portfolio’s total return (Bennyhoff et al., 2012); thus, minimizing reinvestment costs is an important consideration.
Conclusions
Whether DMFs serve a role in a bond portfolio depends on an investor’s objectives and preferences. DMFs may suit the needs of investors who prefer to directly manage their fixed income portfolios, but there are trade-offs. In addition to potentially higher drag on return in the form of trading costs, DMF ladders exhibit more volatile portfolio characteristics because of their larger cash investments and less consistent duration exposures. DMF ladders also have more concentrated reinvestment risk because maturity proceeds are typically reinvested all at once, rather than being staggered. Investors specifically seeking control over duration and maturity
characteristics in their fixed income portfolios may also be able to achieve these objectives using traditional bond funds. In fact, different portfolio combinations of traditional bond funds may offer investors a broader set of options for managing the maturity profile of their fixed income portfolios and more enduring portfolio characteristics relative to using DMFs.
Although DMFs may be helpful to investors who have highly predictable, near-term liabilities that they wish to pre-fund, traditional bond funds generally provide cost and structural advantages for investors implementing and maintaining fixed income exposure in their asset allocation approaches.
Net acquisition yield. A measure of a DMF’s expected return at the time of investment if held to maturity; calculated as the weighted average yield to worst or yield to maturity of a bond portfolio net of the expense ratio and all transaction costs. Specifically:
NAY = YW – ER – ((1+ PD365/DM) – 1) –
((1 + TC365/DM) – 1)
Where:
NAY = Estimated net acquired yield;
YW = DMF’s yield to worst for its underlying portfolio (if unavailable, use yield to maturity); ER = Expense ratio;
PD = Percentage premium/Discount or (Purchase price – Closing day NAV)/ Closing day NAV;
TC = Percentage transaction costs or commission cost/Purchase amount; DM = Number of days until maturity or: Expected maturity date – Purchase date.
References
Accretive Asset Management, 2012a. BulletShares USD Corporate Bond Indices Methodology. Naperville, Ill.: Accretive Asset Management; available at http://accretiveasset.com/Rule%20Book.pdf. Accretive Asset Management, 2012b. BulletShares USD High Yield Corporate Bond Indices Methodology. Naperville, Ill.: Accretive Asset Management; available at http://accretiveasset.com/hyRule%20 Book.pdf.
Bennyhoff, Donald G., 2009. Municipal Bond Funds and Individual Bonds. Valley Forge, Pa.: The Vanguard Group.
Bennyhoff, Donald G., and Yan Zilbering, 2010. Distinguishing Duration from Convexity. Valley Forge, Pa.: The Vanguard Group.
Bennyhoff, Donald G., Scott J. Donaldson, and Ravi G. Tolani, 2012. A Topic of Current Interest: Bonds or Bond Funds? Valley Forge, Pa.: The Vanguard Group. Donaldson, Scott J., 2009. Taxable Bond Investing: Bond Funds or Individual Bonds? Valley Forge, Pa.: The Vanguard Group.
Klug, Lisa Alcay, 1995. Mutual Maestro. San Francisco Chronicle (March 12); available at http://www.sfgate. com/business/article/Mutual-maestro-3157987.php. S&P Dow Jones Indices, 2012. S&P Dow Jones Indices: S&P AMT-Free Municipal Series Methodology. New York: S&P Dow Jones Indices; available at http://www.spindices.com/documents/methodologies/ methodology-sp-amt-free-municipal-series.pdf.
Vanguard research >
Vanguard Center for Retirement Research Vanguard Investment Strategy Group
E-mail > [email protected]
For more information about Vanguard funds, visit vanguard.com or call 800-662-2739 to obtain a prospectus. Investment objectives, risks, charges, expenses, and other important information about a fund are contained in the prospectus; read and consider it carefully before investing.
CFA® is a trademark owned by CFA Institute.
P.O. Box 2600
Valley Forge, PA 19482-2600
© 2014 The Vanguard Group, Inc. All rights reserved.