Department of Civil Engineering
B.TECH – 5
THSEM
Lecture Notes on
STRUCTURAL DESIGN
Disclaimer
This document does not claim any originality and cannot be used as a substitute for prescribed textbooks. The information presented here is merely a collection by the committee members for their respective teaching assignments. We would like to acknowledge various sources like freely available materials from internet particularly NPTEL course material from which the lecture note was prepared. The ownership of the information lies with the respective authors or institutions. Further, this document is not intended to be used for commercial purpose and the committee members are not accountable for any issues, legal or otherwise, arising out of use of this document. The committee members make no representations or warranties with respect to the accuracy or completeness of the contents of this document and specifically disclaim any implied warranties of merchantability or fitness for a particular purpose.
Syllabus
Module-I
Properties of concrete and reinforcing steel, Philosophy, concept and methods of reinforced concrete design, Introduction to limit state method: Limit state of collapse and limit state of serviceability. Application of Limit state method to rectangular beams for flexure, shear, bond and torsion.
Module-II
Design of doubly reinforced beams. Design of T-and L-beams. Design of one way and two way slabs, Design of staircases.
Module-III
Design of short and long columns with axial and eccentric loading, design of isolated column footing.
Module-IV
Design principle of masonry structures: Brick and stone masonry. Design of masonry short and long walls, columns and retaining walls.
Reference Books:
1. Limit state design of reinforced concrete by P.C. Verghese, PHI 2. Reinforced concrete: Limit state by A.K. Jain
3. Reinforced concrete by B.C. Punmia, A.K. Jain and A.K. Jain 4. SP-16 and SP-32.
Introduction
Reinforced concrete, as a composite material, has occupied a special place in the modern construction of different types of structures due to its several advantages. Due to its flexibilit y in form and superiority in performance, it has replaced, to a large extent, the earlier materials like stone, timber and steel. Further, architect's scope and imaginations have widened to a great extent due to its mouldability and monolithicity. Thus, it has helped the architects and engineers to build several attractive shell forms and other curved structures. However, its role in several straight line structural forms like multistoried frames, bridges, foundations etc. is enormous.
Concrete
Concrete is a product obtained artificially by hardening of the mixture of cement, sand, gravel and water in predetermined proportions.
Depending on the quality and proportions of the ingredients used in the mix the properties of concrete vary almost as widely as different kinds of stones.
Concrete has enough strength in compression, but has little strength in tension. Due to this, concrete is weak in bending, shear and torsion. Hence the use of plain concrete is limited applications where great compressive strength and weight are the principal requirements and where tensile stresses are either totally absent or are extremely low.
Properties of Concrete
The important properties of concrete, which govern the design of concrete mix are as follows (i) Weight
The unit weights of plain concrete and reinforced concrete made with sand, gravel of crushed natural stone aggregate may be taken as 24 KN/m3 and 25 KN/m3 respectively.
(ii) Compressive Strength
With given properties of aggregate the compressive strength of concrete depends primarily on age, cement content and the water cement ratio are given Table 2 of IS 456:2000. Characteristic strength are based on the strength at 28 days. The strength at 7 days is about two-thirds of that at 28 days with ordinary portland cement and generally good indicator of strength likely to be obtained.
There is normally gain of strength beyond 28 days. The quantum of increase depends upon the grade and type of cement curing and environmental conditions etc.
(iv) Tensile strength of concrete
The flexure and split tensile strengths of various concrete are given in IS 516:1959 and IS 5816:1970 respectively when the designer wishes to use an estimate of the tensile strength from compressive strength, the following formula can be used
Flexural strength, fcr=0.7√fck N/mm2 (v) Elastic Deformation
The modulus of elasticity is primarily influenced by the elastic properties of the aggregate and to lesser extent on the conditions of curing and age of the concrete, the mix proportions and the type of cement. The modulus of elasticity is normally related to the compressive characteristic strength of concrete
Ec=5000√fck N/mm2
Where Ec= the short-term static modulus of elasticity in N/mm2 fck=characteristic cube strength of concrete in N/mm2
(vi) Shrinkage of concrete
Shrinkage is the time dependent deformation, generally compressive in nature. The constituents of concrete, size of the member and environmental conditions are the factors on which the total shrinkage of concrete depends. However, the total shrinkage of concrete is most influenced by the total amount of water present in the concrete at the time of mixing for a given humidity and temperature. The cement content, however, influences the total shrinkage of concrete to a lesser extent. The approximate value of the total shrinkage strain for design is taken as 0.0003 in the absence of test data (cl. 6.2.4.1).
Figure1.1: Stress-strain curve of concrete
Creep is another time dependent deformation of concrete by which it continues to deform, usually under compressive stress. The creep strains recover partly when the stresses are released. Figure 1.2.2 shows the creep recovery in two parts. The elastic recovery is immediate and the creep recovery is slow in nature.
Thus, the long term deflection will be added to the short term deflection to get the total deflection of the structure. Accordingly, the long term modulus E
ce or the effective modulus of concrete will be needed to include the effect of creep due to permanent loads. The relationship between E
ce and Ec is obtained as follows:
/
c fc Ec
Where, c=short term strain at the age of loading at a stress value of fc θ=creep co-efficient = cr
c
cr
=ultimate creep strain The values of θ on 7th, 28
th
and 365
th
day of loading are 2.2, 1.6 and 1.1 respectively.
Then the total strain= c cr c
ce f E Where, E
ce = effective modulus of concrete.
1 c c c ce c cr c cr f E E
The effective modulus of E
ce of concrete is used only in the calculation of creep deflection.
It is seen that the value of creep coefficient θ is reducing with the age of concrete at loading. It may also be noted that the ultimate creep strain crdoes not include short term strainc. The creep of concrete is influenced by
• Properties of concrete • Water/cement ratio
• Humidity and temperature of curing • Humidity during the period of use • Age of concrete at first loading • Magnitude of stress and its duration • Surface-volume ratio of the member (f) Thermal expansion of concrete
The knowledge of thermal expansion of concrete is very important as it is prepared and remains in service at a wide range of temperature in different countries having very hot or cold climates. Moreover, concrete will be having its effect of high temperature during fire. The coefficient of thermal expansion depends on the nature of cement, aggregate, cement content, relative humidity and size of the section. IS 456 stipulates (cl. 6.2.6) the values of coefficient of thermal expansion for concrete /
o
C for different types of aggregate. Workability and Durability of Concrete
Workability and durability of concrete are important properties to be considered. The relevant issues are discussed in the following:
The workability of a concrete mix gives a measure of the ease with which fresh concrete can be placed and compacted. The concrete should flow readily into the form and go around and cover the reinforcement, the mix should retain its consistency and the aggregates should not segregate. A mix with high workability is needed where sections are thin and/or reinforcement is complicated and congested. The main factor affecting workability is the water content of the mix. Admixtures will increase workability but may reduce strength. The
size of aggregate, its grading and shape, the ratio of coarse to fine aggregate and the aggregate-to-cement ratio also affect workability to some degree.
Measurement of workability (a) Slump test
The fresh concrete is tamped into a standard cone which is lifted off after filling and the slump is measured. The slump is 25–50 mm for low workability, 50–100 mm for medium workability and 100–175 mm for high workability. Normal reinforced concrete requires fresh concrete of medium workability. The slump test is the usual workability test specified.
(b) Compacting factor test
The degree of compaction achieved by a standard amount of work is measured. The apparatus consists of two conical hoppers placed over one another and over a cylinder. The upper hopper is filled with fresh concrete which is then dropped into the second hopper and into the cylinder which is struck off flush. The compacting factor is the ratio of the weight of concrete in the cylinder to the weight of an equal volume of fully compacted concrete. The compacting factor for concrete of medium workability is about 0.9.
Durability of concrete
A durable concrete performs satisfactorily in the working environment during its anticipated exposure conditions during service. The durable concrete should have low permeability with adequate cement content, sufficient low free water/cement ratio and ensured complete compaction of concrete by adequate curing. For more information, please refer to cl. 8 of IS 456.
Design mix and nominal mix concrete
In design mix, the proportions of cement, aggregates (sand and gravel), water and mineral admixtures, if any, are actually designed, while in nominal mix, the proportions are nominally adopted. The design mix concrete is preferred to the nominal mix as the former results in the grade of concrete having the specified workability and characteristic strength (vide cl. 9 of IS 456).
Batching
Mass and volume are the two types of batching for measuring cement, sand, coarse aggregates, admixtures and water. Coarse aggregates may be gravel, grade stone chips or other man made aggregates. The quantities of cement, sand, coarse aggregates and solid admixtures shall be measured by mass. Liquid admixtures and water are measured either by volume or by mass (cl. 10 of IS 456).
Steel reinforcement used in reinforced concrete may be of the following types (a) 1. Mild steel bars conforming to IS 432 (part-I)
2. Hot rolled mild steel conforming to IS 1139
(b) 1. Medium tensile steel conforming to IS 432 (part-I) 2. Hot rolled medium tensile steel.
(c) 1. Hot rolled High Yield Strength Deformed (HYSD) steel conforming to IS 1139. 2. Cold-worked steel HYSD bars steel conforming to IS 1786.
(d) 1. Hard drawn steel wire fabric conforming to IS 1566. 2. Rolled steel made from structural steel conforming to Is 226.
1. the most important characteristic of a reinforcing bar is its stress strain curve and the important property yield stress or 0.2% proof stress, as the case may be.
2. The modules of elasticity E for these steel is 2x10⁵ N/mn2.
3. Mild steel bars have yield strength of 250 N/mm2 and hence it is known as Fe 250.
4. HYSD bars may be hot rolled high yield strength bars or cold rooked steel high strength deformed bars. The latter are also known as cold twisted deformed bars or Tor steel and are available in different grades
i) Fe 415 ii) 500 iii) Fe 550 having 0.2% proof stress as 415N/mm2, 500N/mm2 and 550 N/mm2
5. The reinforcing bars should have sufficient % of elongation.
6. Its coefficients of thermal expansion should be more or less equal to the cement concrete. Stress-strain curves for reinforcement
Figure1.2: Stress-strain curve for Mild steel (idealised) (Fe 250) with definite yield point
Figure1.3: Stress-strain curve for cold worked deform bar
Figures 1.2 and 1.3 show the representative stress-strain curves for steel having definite yield point and not having definite yield point, respectively. The characteristic yield strength f
y of steel is assumed as the minimum yield stress or 0.2 per cent of proof stress for steel having no definite yield point. The modulus of elasticity of steel is taken to be 200000 N/mm
2 .
For mild steel, the stress is proportional to the strain up to the yield point. Thereafter, post yield strain increases faster while the stress is assumed to remain at constant value of f
For cold-worked bars (Fig. 1.3), the stress is proportional to the strain up to a stress of 0.8 f y. Thereafter, the inelastic curve is defined as given below:
Stress Inelastic strain
0.80 f y Nil 0.85 fy 0.0001 0.90 fy 0.0003 0.95 fy 0.0007 0.975 fy 0.0010 1.00 fy 0.0020
Linear interpolation is to be done for intermediate values. The two grades of cold-worked bars used as steel reinforcement are Fe 415 and Fe 500 with the values of fy as 415 N/mm2 and 500 N/mm2, respectively.
Method of RCC design
A reinforced concrete structure should be designed to satisfy the following criteria- i) Adequate safety, in items stiffness and durability
iii) Reasonable economy.
The following design methods are used for the design of RCC Structures. a) The working stress method (WSM)
b) The ultimate load method (ULM) c) The limit state method (LSM) Working Stress Method (WSM)
This method is based on linear elastic theory or the classical elastic theory. This method ensured adequate safety by suitably restricting the stress in the materials (i.e. concrete and steel) induced by the expected working leads on the structures. The assumption of linear elastic behaviour considered justifiable since the specified permissible stresses are kept well below the ultimate strength of the material. The ratio of yield stress of the steel reinforcement or the cube strength of the concrete to the corresponding permissible or working stress is usually called factor of safety.
The WSM uses a factor of safety of about 3 with respect to the cube strength of concrete and a factor of safety of about 1.8 with respect to the yield strength of steel.
The method is based on the ultimate strength of reinforced concrete at ultimate load is obtained by enhancing the service load by some factor called as load factor for giving a desired margin of safety .Hence the method is also referred to as the load factor method or the ultimate strength method.
In the ULM, stress condition at the state of in pending collapse of the structure is analysed, thus using, the non-linear stress – strain curves of concrete and steel. The safely measure in the design is obtained by the use of proper load factor. The satisfactory strength performance at ultimate loads does not guarantee satisfactory strength performance at ultimate loads does not guarantee satisfactory serviceability performance at normal service loads.
Limit state method (LSM)
Limit states are the acceptable limits for the safety and serviceability requirements of the structure before failure occurs. The design of structures by this method will thus ensure that they will not reach limit states and will not become unfit for the use for which they are intended. It is worth mentioning that structures will not just fail or collapse by violating (exceeding) the limit states. Failure, therefore, implies that clearly defined limit states of structural usefulness has been exceeded.
Limit state are two types i) Limit state of collapse ii) Limit state of serviceability. Limit states of collapse
The limit state of collapse of the structure or part of the structure could be assessed from rupture of one or more critical sections and from bucking due to elastic bending, shear, torsion and axial loads at every section shall not be less than the appropriate value at that section produced by the probable most unfavourable combination of loads on the structure using the appropriate factor of safely.
Limit state of serviceability
Limit state of serviceability deals with deflection and crocking of structures under service loads, durability under working environment during their anticipated exposure conditions during service, stability of structures as a whole, fire resistance etc.
1. Characteristic strength of materials.
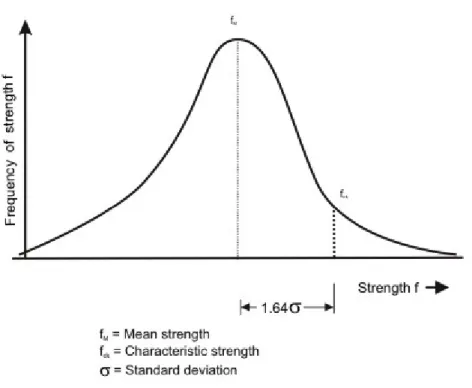
The term ‗characteristic strength‘ means that value of the strength of material below which not more than minimum acceptable percentage of test results are expected to fall. IS 456:2000 have accepted the minimum acceptable percentage as 5% for reinforced concrete structures. This means that there is 5% for probability or chance of the actual strength being less than the characteristic strength.
Figure 1.4: Frequency distribution curve for strength
Figure shows frequency distribution curve of strength material (concrete or steel). The value of K corresponding to 5% area of the curve is 1.65.
The design strength should be lower than the mean strength (fm) Characteristic strength = Mean strength –K x standard deviation or fk=fm-KSd
Where, fk=characteristic strength of the material fm=mean strength
K=constant =1.65
Sd=standard deviation for a set of test results. The value of standard deviation (Sd) is given by
2 1 d S n
Where, δ=deviation of the individual test strength from the average or mean strength of n samples.
n= number of test results.
IS 456:2000 has recommended minimum value of n=30. Characteristic strength of concrete
Characteristic strength of concrete is denoted by fck (N/mm2) and its value is different for different grades of concrete e.g. M 15, M25 etc. In the symbol ‗M‘ used for designation of concrete mix, refers to the mix and the number refers to the specified characteristic compressive strength of 150 mm size cube at 28 days expressed in N/mm2
Characteristic strength of steel
Until the relevant Indian Standard specification for reinforcing steel are modified to include the concept of characteristic strength, the characteristic value shall be assumed as the minimum yield stress or 0.2% proof stress specified in the relevant Indian Standard specification. The characteristic strength of steel designated by symbol fy (N/mm2)
Characteristic loads
The term ‗Characteristic load‘ means that values of load which has a 95% probability of not being exceeded during that life of the structure.
Figure 1.5: Frequency distribution curve for load
The design load should be more than average load obtained from statistic, we have Fk=Fm+KSd
Where, Fk=characteristic load; Fm= mean load
K=constant=2.65;
Sd=standard deviation for the load.
Since data are not available to express loads in statistical terms, for the purpose of this standard, dead loads given in IS 875(Part-1), imposed loads given in IS 875(Part-2), wind loads. Given in IS 875 (Part-3), snow load as given in IS 875(Part-4) and seismic forces given in IS 1893 shall be assumed as the characteristic loads.
Design strength of materials
The design strength of materials (fd) is given by k d m f f
Where, fk=characteristic strength of material.
m =partial safety factor appropriate to the material and the limit state being considered
Design loads
The design load ( Fd) is given by. Fd=Fk.f
f
=partial safety factor appropriate to the nature of loading and the limit state being considered.
The design load obtained by multi plying the characteristic load by the partial safety factor for load is also known as factored load.
Partial safety factor ( m) for materials
When assessing the strength of a structure or structural member for the limit state of collapse, the values of partial safety factor, m should be taken as 1.15 for steel.
Thus, in the limit state method , the design stress for steel reinforcement is given by fy / ms = fy/1.15=0.87fy.
According to IS 456:2000 for design purpose the compressive strength of concrete in the structure shall be assumed to be 0.67 times the characteristic strength of concrete in cube and partial safety factor mc =1.5 shall be applied in addition to this. Thus, the design stress in concrete is given by
0.67fck /mc 0.67fck /1.50.446fck Partial safety factor for loads
The partial safety factors for loads, as per IS 456:2000 are given in table below Load
combination
Limit State of collapse Limit State of Serviceability
DL LL WL/EL DL LL WL/EL
DL+IL 1.5 1.5 - 1.0 1.0 -
DL+WL 1.5 or 0.9* - 1.5 1.0 - 1.0
DL+IL+WL 1.2 1.2 1.2 1.0 0.8 0.8
(* This value is to be considered when stability against overturning or stress reversal is critical)
Limit state of collapse in flexure
The behaviour of reinforced concrete beam sections at ultimate loads has been explained in detail in previous section. The basic assumptions involved in the analysis at the ultimate limit state of flexure (Cl. 38.1 of the Code) are listed here.
a) Plane sections normal to the beam axis remain plane after bending, i.e., in an initially straight beam, strain varies linearly over the depth of the section.
b) The maximum compressive strain in concrete (at the outermost fibre) cu shall be taken as 0.0035 in bending.
c) The relationship between the compressive stress distribution in concrete and the strain in concrete may be assumed to be rectangle, trapezoid, parabola or any other shape which results in prediction of strength in substantial agreement with the results of test. An acceptable stress-strain curve is given below in figure 1.6. For design purposes, the compressive strength of concrete in the structure shall be assumed to be 0.67 times the characteristic strength. The partial safety factor y, = 1.5 shall be applied in addition to this.
Figure 1.6 Stress-strain curve for concrete d) The tensile strength of the concrete is ignored.
e) The stresses in the reinforcement are derived from representative stress-strain curve for the type of steel used. Typical curves are given in figure 1.3. For design purposes the partial safety factor m equal to 1.15 shall be applied.
f) The maximum strain in the tension reinforcement in the section at failure shall not be less
than: 0.002 1.15 y s f E
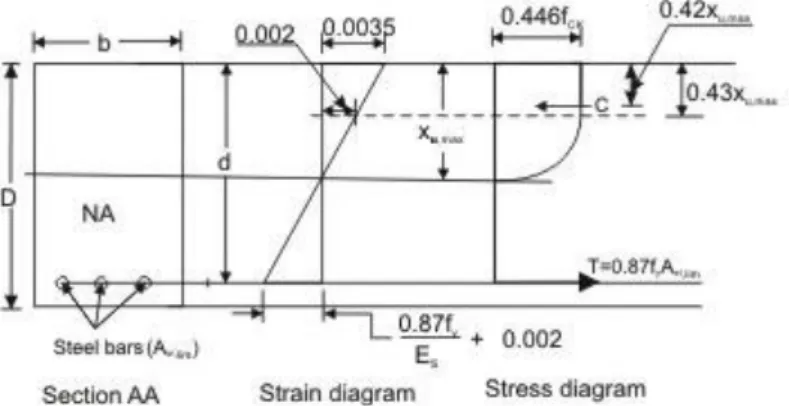
Limiting Depth of Neutral Axis
Figure 1.8 Rectangular beam under flexure xu xu,max
Based on the assumption given above, an expression for the depth of the neutral axis at the ultimate limit state,xu, can be easily obtained from the strain diagram in Fig. 1.8. Considering similar triangles,
0.0035 0.87 0.0035 0.002 u y s x f d E (1)
According to IS 456:2000 cl no 38.1 (f) ,when the maximum strain in tension reinforcement is equal to 0.87 y 0.002
s f
E , then the value of neutral axis will be xu,max.
Therefore, ,max 0.0035 0.87 0.0035 0.002 u y s x f d E (2) The values of xu,max for different grades of steel, obtained by applying Eq. (2), are listed in table.
Table 1 Limiting depth of neutral axis for different grades of steel
Steel Grade Fe 250 Fe 415 Fe 500
,max / u
x d 0.5313 0.4791 0.4791
The limiting depth of neutral axis xu,maxcorresponds to the so-called balanced section, i.e., a section that is expected to result in a ‗balanced‘ failure at the ultimate limit state in flexure. If the neutral axis depth xu is less thanxu,max, then the section is under-reinforced (resulting in a ‗tension‘ failure); whereas if xu exceedsxu,max, it is over-reinforced (resulting in a ‗compression‘ failure).
Analysis of Singly Reinforced Rectangular Sections
Analysis of a given reinforced concrete section at the ultimate limit state of flexure implies the determination of the ultimate moment MuR of resistance of the section. This is easily obtained from the couple resulting from the flexural stresses (Fig 1.9).
Fig. 1.9 Concrete stress-block parameters in compression
. .
uR u u
M C zT z (3) where Cuand Tuare the resultant (ultimate) forces in compression and tension respectively, and z is the lever arm.
.
u st st
T f A (4)
Where fst 0.87fy for xu xu,max
and the line of action of Tu corresponds to the level of the centroid of the tension steel.
Concrete Stress Block in Compression
In order to determine the magnitude of Cu and its line of action, it is necessary to analyse the concrete stress block in compression. As ultimate failure of a reinforced concrete beam in flexure occurs by the crushing of concrete, for both under- and over-reinforced beams, the shape of the compressive stress distribution (‗stress block‘) at failure will be, in both cases, as shown in Fig. 1.9. The value of Cu can be computed knowing that the compressive stress in concrete is uniform at 0.447 f
ck for a depth of 3xu / 7, and below this it varies parabolically over a depth of 4x
u / 7 to zero at the neutral axis [Fig. 1.9]. For a rectangular section of width b,
3 2 4 0.447 b 7 3 7 u u u ck x x C f x Therefore, Cu 0.361f bxck u (5)
Also, the line of action of Cu is determined by the centroid of the stress block, located at a distance x from the concrete fibres subjected to the maximum compressive strain. Accordingly, considering moments of compressive forces C
u, C1 and C2 [Fig. 1.9] about the maximum compressive strain location,
1.5 4 3 2 4 5 (0.362 ) x (0.447 ) x x 7 7 3 7 8 7 u u ck u ck u u x x f bx x f bx x Solving x 0.416xu (6) Depth of Neutral Axis
For any given section, the depth of the neutral axis should be such that Cu Tu, satisfying equilibrium of forces. EquatingCu Tu, with expressions for Cuand Tugiven by Eq. (5) and Eq. (4) respectively. 0.87 0.361 y st u ck f A x f b
, valid only if resulting xu xu,max (7)
Ultimate Moment of Resistance
The ultimate moment of resistance M
uR of a given beam section is obtainable from Eq. (3). The lever arm z, for the case of the singly reinforced rectangular section [Fig. 1.8, Fig. 1.9] is given by
0.416 u
z d x (8) Accordingly, in terms of the concrete compressive strength,
0.361 (d 0.416 x )
uR ck u u u
M f bx for all x (9) Alternatively, in terms of the steel tensile stress,
A (d 0.416 x )
uR st st u u
M f for all x (10) With fst=0.87fy for xu xu,max
Limiting Moment of Resistance
The limiting moment of resistance of a given (singly reinforced, rectangular) section, according to the Code (Cl. G−1.1), corresponds to the condition, defined by Eq. (2). From Eq. (9), it follows that:
,lim 0.361 ,max(d 0.416 x ,max)
u ck u u M f bx (11) ,max ,max 2 ,lim 0.416 x 0.361 u 1 u u ck x M f bd d d (11a)
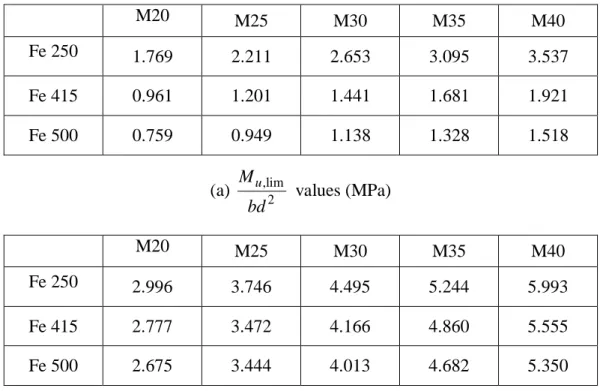
Corresponding to the limiting moment of resistanceMu,lim, there is a limiting percentage tensile steelpt,lim100xAst,lim/bd. An expression for pt,limis obtainable from Eq. (7) with:
,max u u x x . ,max 0.87 ,lim x 0.361 100 y u t ck f x p d f ,max ,lim 41.61 u ck t y x f p f d (12)
The values of pt,limand
2 u
M
bd (in MPa units) for, different combinations of steel and
concrete grades are listed in Table 2. These values correspond to the so-called ‗balanced‘ section for a singly reinforced rectangular section.
Table 2 Limiting values of pt,limand
2 u
M
bd for singly reinforced rectangular beam sections for
various grades of steel and concrete.
(a) pt,lim values
M20 M25 M30 M35 M40 Fe 250 1.769 2.211 2.653 3.095 3.537 Fe 415 0.961 1.201 1.441 1.681 1.921 Fe 500 0.759 0.949 1.138 1.328 1.518 (a) ,lim 2 u M bd values (MPa) M20 M25 M30 M35 M40 Fe 250 2.996 3.746 4.495 5.244 5.993 Fe 415 2.777 3.472 4.166 4.860 5.555 Fe 500 2.675 3.444 4.013 4.682 5.350
Safety at Ultimate Limit State in Flexure
The bending moment expected at a beam section at the ultimate limit state due to the factored loads is called the factored moment M
loads (dead loads, live loads, wind loads, etc.), appropriate load factors should be applied to the specified ‗characteristic‘ loads, and the factored moment M
u is determined by structural analysis.
The beam section will be considered to be ‗safe‘, according to the Code, if its ultimate moment of resistance M
uR is greater than or equal to the factored moment Mu. In other words, for such a design, the probability of failure is acceptably low. It is also the intention of the Code to ensure that at ultimate failure in flexure, the type of failure should be a tension (ductile) failure. For this reason, the Code requires the designer to ensure that xu xu,max, whereby it follows that, for a singly reinforced rectangular section, the tensile reinforcement percentage p
t should not exceed pt,limand the ultimate moment of resistance MuR should not exceed Mu,lim.
Modes of failure: Types of section
A reinforced concrete member is considered to have failed when the strain of concrete in extreme compression fibre reaches its ultimate value of 0.0035. At this stage, the actual strain in steel can have the following values:
(a) Equal to failure strain of steel (0.87 y 0.002 s
f
E ) corresponding to balanced section. (b) More than failure strain, corresponding to under reinforced section.
(c) Less than failure strain corresponding to over reinforced section. Thus for a given section, the actual value of xu
d can be determined from Eq. (7). Three cases may arise.
Case-1: xu
d equal to the limiting value
,max u
x
d : Balanced section.
Case-2: xu
d less than limiting value: under-reinforced section. Case-3: xu
In balanced section, the strain in steel and strain in concrete reach their maximum values simultaneously. The percentage of steel in this section is known as critical or limiting steel percentage. The depth of neutral axis (NA) is xu xu,max.
Under-reinforced section
An under-reinforced section is the one in which steel percentage (pt) is less than critical or limiting percentage (pt,lim). Due to this the actual NA is above the balanced NA and
,max
u u
x x .
Over-reinforced section
In the over reinforced section the steel percentage is more than limiting percentage due to which NA falls below the balanced NA and xu xu,max. Because of higher percentage of steel, yield does not take place in steel and failure occurs when the strain in extreme fibres in concrete reaches its ultimate value.
Computation of Mu
M
u can be obtained by multiplying the tensile force T or the compressive force C with the lever arm. The expressions of C, lever arm and T are given in Eqs. (4) and (3) respectively. Previous section discusses that there are three possible cases depending on the location of x
u. The corresponding expressions of M
u are given below for the three cases: (i) When x
u < xu, max
In this case the concrete reaches 0.0035, steel has started flowing showing ductility (Strain > 0.87
0.002 y
s f
E ). So, the computation of Mu is to be done using the tensile force of steel in this case.
Therefore, M
u = T (lever arm) = 0.87 fy Ast (d - 0.42 xu) (ii) When x
u = xu, max
In this case steel just reaches the value of 0.87 y 0.002 s
f
E and concrete also reaches its maximum value. The strain of steel can further increase but the reaching of limiting strain of concrete should be taken into consideration to determine the limiting M
u as Mu, lim here. So, we have
M
u, lim = C (lever arm)
Substituting the expressions of C
,max ,max 2 ,lim 0.36 1 0.42 u u u ck x x M f bd d d (iii) When x u > xu, max
In this case, concrete reaches the strain of 0.0035, tensile strain of steel is much less than ( 0.87
0.002 y
s f
E ) and any further increase of strain of steel will mean failure of concrete, which is to be avoided. On the other hand, when steel reaches 0.87 y 0.002
s f
E , the strain of concrete far exceeds 0.0035. Hence, it is not possible. Therefore, such design is avoided and the section should be redesigned.
However, in case of any existing reinforced concrete beam where x
u > xu, max, the moment of resistance M
u for such existing beam is calculated by restricting xu to xu, max only and the corresponding M
u will be as per the case when xu= xu, max.
Numerical Problem
Find the moment of resistance of a singly reinforced concrete beam of 200 mm width 400mm effective depth, reinforced with 3-16 mm diameter bars of Fe 415 steel. Take M20 grade of concrete. Solution 2 2 3 (16) 603.19 4 603.19 % 100 0.754% 200 400 st t A x mm p x x 0.754 415 2.417 2.417 0.378 100 20 y u t ck f x p x x d f
Now for Fe 415 grade of steel, xu,max 0.479
d
Hence the beam is under-reinforced. The moment of resistance is given by
0.87 1 y st u y st ck f A M f A d f bd 0.87 415 603.19 400 1 415 603.19 20 200 400 x x x x x x =73.48 KN-m.
Design Type of Problems
The designer has to make preliminary plan lay out including location of the beam, its span and spacing, estimate the imposed and other loads from the given functional requirement of the structure. The dead loads of the beam are estimated assuming the dimensions b and d initially. The bending moment, shear force and axial thrust are determined after estimating the different loads. In this illustrative problem, let us assume that the imposed and other loads are given. Therefore, the problem is such that the designer has to start with some initial dimensions and subsequently revise them, if needed. The following guidelines are helpful to assume the design parameters initially.
(i) Selection of breadth of the beam b
Normally, the breadth of the beam b is governed by: (i) proper housing of reinforcing bars and (ii) architectural considerations. It is desirable that the width of the beam should be less than or equal to the width of its supporting structure like column width, or width of the wall etc. Practical aspects should also be kept in mind. It has been found that most of the requirements are satisfied with b as 150, 200, 230, 250 and 300 mm. Again, width to overall depth ratio is normally kept between 0.5 and 0.67.
(ii) Selection of depths of the beam d and D
The effective depth has the major role to play in satisfying (i) the strength requirements of bending moment and shear force, and (ii) deflection of the beam. The initial effective depth of the beam, however, is assumed to satisfy the deflection requirement depending on the span and type of the reinforcement. IS 456 stipulates the basic ratios of span to effective depth of beams for span up to 10 m as (Clause 23.2.1)
Cantilever 7
Simply supported 20 Continuous 26
For spans above 10 m, the above values may be multiplied with 10/span in metres, except for cantilevers where the deflection calculations should be made. Further, these ratios are to be
multiplied with the modification factor depending on reinforcement percentage and type. Figures 4 and 5 of IS 456 give the different values of modification factors. The total depth D can be determined by adding 40 to 80 mm to the effective depth.
(iii) Selection of the amount of steel reinforcement A
st
The amount of steel reinforcement should provide the required tensile force T to resist the factored moment M
u of the beam. Further, it should satisfy the minimum and maximum percentages of reinforcement requirements also. The minimum reinforcement A
s is provided for creep, shrinkage, thermal and other environmental requirements irrespective of the strength requirement. The minimum reinforcement A
s to be provided in a beam depends on the f
y of steel and it follows the relation: (cl. 26.5.1.1a of IS 456) 0.85
s
y A
bd f
The maximum tension reinforcement should not exceed 0.04 bD (cl. 26.5.1.1b of IS 456), where D is the total depth.
Besides satisfying the minimum and maximum reinforcement, the amount of reinforcement of the singly reinforced beam should normally be 75 to 80% of p
t, lim. This will ensure that strain in steel will be more than (0.87 y 0.002
s f
E ) as the design stress in steel will be 0.87 fy. Moreover, in many cases, the depth required for deflection becomes more than the limiting depth required to resist M
u, lim. Thus, it is almost obligatory to provide more depth. Providing more depth also helps in the amount of the steel which is less than that required for M
u, lim. This helps to ensure ductile failure. Such beams are designated as under-reinforced beams. (iv) Selection of diameters of bar of tension reinforcement
Reinforcement bars are available in different diameters such as 6, 8, 10, 12, 14, 16, 18, 20, 22, 25, 28, 30, 32, 36 and 40 mm. Some of these bars are less available. The selection of the diameter of bars depends on its availability, minimum stiffness to resist while persons walk over them during construction, bond requirement etc. Normally, the diameters of main tensile bars are chosen from 12, 16, 20, 22, 25 and 32 mm.
Besides strength and deflection, durability is a major factor to decide on the grade of concrete. Table 5 of IS 456 recommends M 20 as the minimum grade under mild environmental exposure and other grades of concrete under different environmental exposures also.
(vi) Selection of grade of steel
Normally, Fe 250, 415 and 500 are in used in reinforced concrete work. Mild steel (Fe 250) is more ductile and is preferred for structures in earthquake zones or where there are possibilities of vibration, impact, blast etc.
Failure Modes due to Shear
Figure 1.10 (a) Web shear progress along dotted lines
Figure 1.10 (b) Flexural tension
Figure 1.10 (b) Flexural compression
Bending in reinforced concrete beams is usually accompanied by shear, the exact analysis of which is very complex. However, experimental studies confirmed the following three different modes of failure due to possible combinations of shear force and bending moment at a given section:
(i) Web shear (Fig. 1.10a)
(ii) Flexural tension shear (Fig. 1.10b) (iii) Flexural compression shear (Fig. 1.10c)
Web shear causes cracks which progress along the dotted line shown in Fig. 1.10a. Steel yields in flexural tension shear as shown in Fig. 1.10b, while concrete crushes in compression due to flexural compression shear as shown in Fig. 1.10c. An in-depth presentation of the
three types of failure modes is beyond the scope here. Only the salient points needed for the routine design of beams in shear are presented here.
Shear Stress
The distribution of shear stress in reinforced concrete rectangular, T and L-beams of uniform and varying depths depends on the distribution of the normal stress. However, for the sake of simplicity the nominal shear stress τ
v is considered which is calculated as follows (IS 456, cls. 40.1 and 40.1.1):
Figure 1.11: Distribution of shear stress and average shear stress
(i) In beams of uniform depth (Figs. 1.11a and b):
u v V bd (13) where V
u = shear force due to design loads,
b = breadth of rectangular beams and breadth of the web b
d = effective depth.
(ii) In beams of varying depth:
tan u u v M V d bd (14)
where ηv, Vu, b or bw and d are the same as in (i), Mu = bending moment at the section, and
β = angle between the top and the bottom edges.
The positive sign is applicable when the bending moment M
u decreases numerically in the same direction as the effective depth increases, and the negative sign is applicable when the bending moment M
u increases numerically in the same direction as the effective depth increases.
Design Shear Strength of Reinforced Concrete
Recent laboratory experiments confirmed that reinforced concrete in beams has shear strength even without any shear reinforcement. This shear strength (τ
c) depends on the grade of concrete
and the percentage of tension steel in beams. On the other hand, the shear strength of reinforced concrete with the reinforcement is restricted to some maximum value τ
cmax depending on the
grade of concrete. These minimum and maximum shear strengths of reinforced concrete (IS 456, cls. 40.2.1 and 40.2.3, respectively) are given below:
Design shear strength without shear reinforcement (IS 456, cl. 40.2.1)
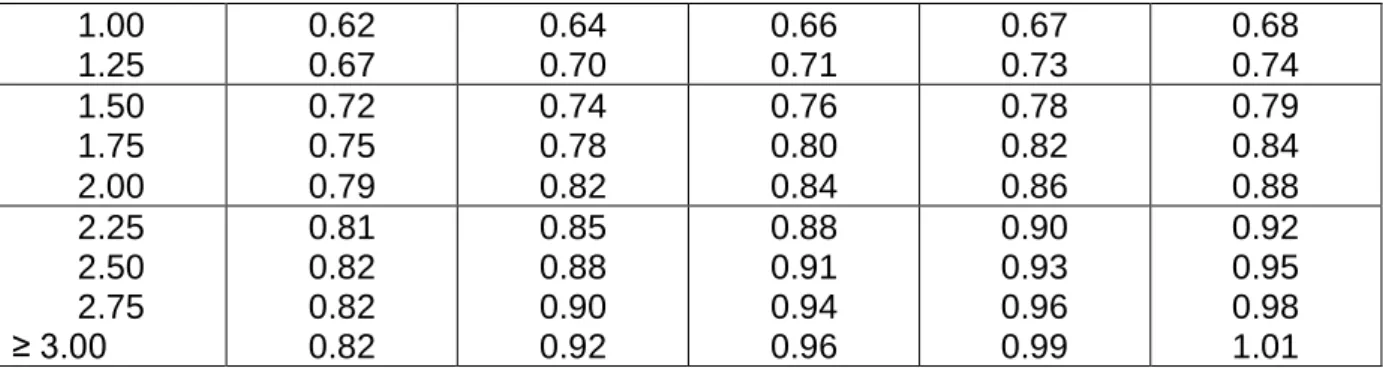
Table 19 of IS 456 stipulates the design shear strength of concrete τ
c for different grades of concrete with a wide range of percentages of positive tensile steel reinforcement. It is worth mentioning that the reinforced concrete beams must be provided with the minimum shear reinforcement as per cl. 40.3 even when τ
v is less than τc given in Table 3. Table 3 Design shear strength of concrete, τ
c in N/mm 2 100As/bd Grade of concrete M 20 M 25 M 30 M 35 M40 and above ≤ 0.15 0.25 0.50 0.28 0.36 0.48 0.29 0.36 0.49 0.29 0.37 0.50 0.29 0.37 0.50 0.30 0.38 0.51 0.75 0.56 0.57 0.59 0.59 0.60
1.00 1.25 0.62 0.67 0.64 0.70 0.66 0.71 0.67 0.73 0.68 0.74 1.50 1.75 2.00 0.72 0.75 0.79 0.74 0.78 0.82 0.76 0.80 0.84 0.78 0.82 0.86 0.79 0.84 0.88 2.25 2.50 2.75 ≥ 3.00 0.81 0.82 0.82 0.82 0.85 0.88 0.90 0.92 0.88 0.91 0.94 0.96 0.90 0.93 0.96 0.99 0.92 0.95 0.98 1.01 In Table 3, A
s is the area of longitudinal tension reinforcement which continues at least one effective depth beyond the section considered except at support where the full area of tension reinforcement may be used provided the detailing is as per IS 456, cls. 26.2.2 and 26.2.3. Maximum shear stress τ
cmax with shear reinforcement (cls. 40.2.3, 40.5.1 and 41.3.1) Table 20 of IS 456 stipulates the maximum shear stress of reinforced concrete in beams τ
cmax as given below in Table 6.2. Under no circumstances, the nominal shear stress in beams τ
v shall exceed τ
cmax given in Table 6.2 for different grades of concrete.
Table 4 Maximum shear stress, τ
cmax in N/mm 2 Grade of concrete M 20 M 25 M 30 M 35 M 40 and above ,max c N/mm2 2.8 3.1 3.5 3.7 4.0
Critical Section for Shear
Clauses 22.6.2 and 22.6.2.1 stipulate the critical section for shear and are as follows:
For beams generally subjected to uniformly distributed loads or where the principal load is located further than 2d from the face of the support, where d is the effective depth of the beam, the critical sections depend on the conditions of supports as shown in Figs. 1.12 a, b and c and are mentioned below.
(i) When the reaction in the direction of the applied shear introduces tension (Fig. 1.12a) into the end region of the member, the shear force is to be computed at the face of the support of the member at that section.
(ii) When the reaction in the direction of the applied shear introduces compression into the end region of the member (Figs. 1.12b and c), the shear force computed at a distance d from the face of the support is to be used for the design of sections located at a distance less than d from the face of the support. The enhanced shear strength of sections close to supports, however, may be considered as discussed in the following section.
Minimum Shear Reinforcement (cls. 40.3, 26.5.1.5 and 26.5.1.6 of IS 456) Minimum shear reinforcement has to be provided even when τ
v is less than τc given in Table 3 as recommended in cl. 40.3 of IS 456. The amount of minimum shear reinforcement, as given in cl. 26.5.1.6, is given below.
The minimum shear reinforcement in the form of stirrups shall be provided such that: 0.4 0.87 sv v y A bs f (15) where A
sv = total cross-sectional area of stirrup legs effective in shear, s
v = stirrup spacing along the length of the member,
b = breadth of the beam or breadth of the web of the web of flanged beam b
w, and f
y = characteristic strength of the stirrup reinforcement in N/mm 2
which shall not be taken greater than 415 N/mm2.
The above provision is not applicable for members of minor structural importance such as lintels where the maximum shear stress calculated is less than half the permissible value. The minimum shear reinforcement is provided for the following:
(i) Any sudden failure of beams is prevented if concrete cover bursts and the bond to the tension steel is lost.
(ii) Brittle shear failure is arrested which would have occurred without shear reinforcement.
(iii) Tension failure is prevented which would have occurred due to shrinkage, thermal stresses and internal cracking in beams.
(iv) To hold the reinforcement in place when concrete is poured.
(v) Section becomes effective with the tie effect of the compression steel.
Further, cl. 26.5.1.5 of IS 456 stipulates that the maximum spacing of shear reinforcement measured along the axis of the member shall not be more than 0.75 d for vertical stirrups and d for inclined stirrups at 45
o
, where d is the effective depth of the section. However, the spacing shall not exceed 300 mm in any case.
Design of Shear Reinforcement (cl. 40.4 of IS 456)
When τ
v is more than τc given in Table 6.1, shear reinforcement shall be provided in any of the three following forms:
(a) Vertical stirrups,
(b) Bent-up bars along with stirrups, and (c) Inclined stirrups.
In the case of bent-up bars, it is to be seen that the contribution towards shear resistance of bent-up bars should not be more than fifty per cent of that of the total shear reinforcement. The amount of shear reinforcement to be provided is determined to carry a shear force V
us equal to
us u c
V V bd (16) where b is the breadth of rectangular beams or b
w in the case of flanged beams. The strengths of shear reinforcement V
us for the three types of shear reinforcement are as follows:
(a) Vertical stirrups: 0.87 y sv us v f A d V s (17) (b) For inclined stirrups or a series of bars bent-up at different cross-sections:
0.87 (sin cos ) y sv us v f A d V s (18) (c) For single bar or single group of parallel bars, all bent-up at the same cross-section:
0.87 sin
us y sv
where A
sv = total cross-sectional area of stirrup legs or bent-up bars within a distance sv, s
v = spacing of stirrups or bent-up bars along the length of the member, η
v = nominal shear stress, η
c = design shear strength of concrete,
b = breadth of the member which for the flanged beams shall be taken as the breadth of the web b
w, f
y = characteristic strength of the stirrup or bent-up reinforcement which shall not be taken greater than 415 N/mm
2 ,
α = angle between the inclined stirrup or bent-up bar and the axis of the member, not less than 45
o , and d = effective depth.
The following two points are to be noted:
(i) The total shear resistance shall be computed as the sum of the resistance for the various types separately where more than one type of shear reinforcement is used.
(ii) The area of stirrups shall not be less than the minimum specified in cl. 26.5.1.6. Curtailment of Tension Reinforcement in Flexural Members (cl. 26.2.3.2 of IS 456) Curtailment of tension reinforcement is done to provide the required reduced area of steel with the reduction of the bending moment. However, shear force increases with the reduction of bending moment. Therefore, it is necessary to satisfy any one of following three conditions while terminating the flexural reinforcement in tension zone:
(i) The shear stress η
v at the cut-off point should not exceed two-thirds of the permitted value which includes the shear strength of the web reinforcement. Accordingly,
(2 / 3)( / ) (1.5 ) v c us us v c V bd or V bd
(ii) For each of the terminated bars, additional stirrup area should be provided over a distance of three-fourth of effective depth from the cut-off point. The additional stirrup area shall not be less than 0.4 b s/f
y, where b is the breadth of rectangular beams and is replaced by bw, the breadth of the web for flanged beams, s = spacing of additional stirrups and f
y is the characteristic strength of stirrup reinforcement in N/mm2. The value of s shall not exceed d/(8
β
b), where βb is the ratio of area of bars cut-off to the total area of bars at that section, and d is the effective depth.
(iii) For bars of diameters 36 mm and smaller, the continuing bars provide double the area required for flexure at the cut-off point. The shear stress should not exceed three-fourths that permitted. Accordingly, (3 / 4)( / ) (1.33 ) v c us us v c V bd or V bd
In the above expression b is the breadth of the rectangular beams which will be b
w in the case of flanged beams.
Bond
The bond between steel and concrete is very important and essential so that they can act together without any slip in a loaded structure. With the perfect bond between them, the plane section of a beam remains plane even after bending. The length of a member required to develop the full bond is called the anchorage length. The bond is measured by bond stress. The local bond stress varies along a member with the variation of bending moment.
Thus, a tensile member has to be anchored properly by providing additional length on either side of the point of maximum tension, which is known as ‗Development length in tension‘. Similarly, for compression members also, we have ‗Development length L
d in compression‘. Accordingly, IS 456, cl. 26.2 stipulates the requirements of proper anchorage of reinforcement in terms of development length L
d only employing design bond stress ηbd. Design bond stress – values
The average bond stress is still used in the working stress method and IS 456 has mentioned about it in cl. B-2.1.2. However, in the limit state method of design, the average bond stress has been designated as design bond stress η
bd and the values are given in cl. 26.2.1.1. The same is given below as a ready reference.
Table 5: η
bd for plain bars in tension
Grade of concrete M 20 M 25 M 30 M 35 M 40 and
above Design Bond Stress
τbd in N/mm2
1.2 1.4 1.5 1.7 1.9
For deformed bars conforming to IS 1786, these values shall be increased by 60 per cent. For bars in compression, the values of bond stress in tension shall be increased by 25 per cent.
Development Length
Figure 1.13 Development length of bar
Figure 1.13 shows the free body diagram of the segment AB of the bar. At B, the tensile force T
trying to pull out the bar is of the value T = (π θ
2
ζ
s /4), where θ is the nominal diameter of the bar
and ζ
s is the tensile stress in bar at the section considered at design loads. It is necessary to have
the resistance force to be developed by η
bd for the length Ld to overcome the tensile force. The
resistance force = π θ (L
d) (ηbd). Equating the two, we get
π θ (L
d) (ηbd) = (π θ 2
ζ
s /4) (19) Equation (19), thus gives
4 s d bd L (20) The above equation is given in cl. 26.2.1 of IS 456 to determine the development length of bars.
The example taken above considers round bar in tension. Similarly, other sections of the bar should have the required L
d as determined for such sections. For bars in compression, the development length is reduced by 25 per cent as the design bond stress in compression η
bd is 25 per cent more than that in tension (see the last lines below Table 6.4). Following the same logic, the development length of deformed bars is reduced by 60 per cent of that needed for the plain round bars. Tables 64 to 66 of SP-16 present the development lengths of fully stressed plain and deformed bars (when ζ
s = 0.87 fy) both under tension and compression. It is to be noted that the consequence of stress concentration at the lugs of deformed bars has not been taken into consideration.
Checking of Development Lengths of Bars in Tension The following are the stipulation of cl. 26.2.3.3 of IS 456.
(i) At least one-third of the positive moment reinforcement in simple members and one-fourth of the positive moment reinforcement in continuous members shall be extended along the same face of the member into the support, to a length equal to L
(ii) Such reinforcements of (i) above shall also be anchored to develop its design stress in tension at the face of the support, when such member is part of the primary lateral load resisting system.
(iii) The diameter of the positive moment reinforcement shall be limited to a diameter such that the L
d computed for ζs = fd in Eq. (20) does not exceed the following: 1 0 ( ) s d d when f M L L V (21)
where M1 = moment of resistance of the section assuming all reinforcement at the section to be stressed to fd,
fd = 0.87 fy,
V = shear force at the section due to design loads, L
o = sum of the anchorage beyond the centre of the support and the equivalent anchorage value of any hook or mechanical anchorage at simple support. At a point of inflection, L
o is limited to the effective depth of the member or 12θ, whichever is greater, and
θ = diameter of bar.
It has been further stipulated that M
1/V in the above expression may be increased by 30 per cent when the ends of the reinforcement are confined by a compressive reaction.
Numerical problem of design of singly reinforced beam
A reinforced concrete beam is supported on two walls 250mm thick, spaced at a clear distance of 6m. The beam carries a super-imposed load of 9.8 KN/m. design the beam using M20 concrete and HYSD bars of Fe 415 grade.
Solution
The minimum depth of beam is based on limit state of serviceability requirements.
As per IS 456:2000 cl no 23.2.1 (a), for simply supported beam l/d=20 and for balanced section, pt,lim 0.96%
Also for Fe 415 steel, fs=0.58x415=240 N/mm2
As per IS 456:2000 cl no 23.2.1(c) and fig 4 of IS 456:2000 modification factor=1. Therefore, l/d=20x1; d l/ 206000 / 20300
Now from experience, assume d=l/15=400mm
Therefore, overall depth= effective depth+ clear cover + diameter of stirrup +0.5(diameter of main reinforcement)
=400+25+8+0.5x20=443mm 450mm Assume b=250mm
Therefore, try a trial section of dimension 250x450. Load Calculation
Self-weight of beam (DL)= 0.25x0.45x1x25=2.8125 KN/m Super-imposed load (LL)= 9.8 KN/m
Therefore, total load,w =(DL+LL)=(2.8125+9.8)=12.6125 KN/m Design load, wu=1.5xw=18.9187 KN/m
Calculation of effective span
As per IS 456:2000, cl no 22.2 (a), the effective span of a simply supported beam is lesser of the following two.
Clear span+ the effective depth of beam or slab Or centre to centre distance between supports. Clear span =6m
Effective depth of beam, d=450-25-8-0.5x20=407mm
Therefore, clear span + effective depth of beam=(6+0.407)m=6.407m Centre to centre distance between support=(6+0.25/2+0.25/2)m=6.25m Lesser of two=6.25m
Therefore, effective span =6.25m Calculation of BM and SF Maximum BM = 2 2 18.9187 6.25 92.376 8 8 u w l x KN m Maximum SF= 18.9187 6.25 59.12 2 2 u w l x KN
Computation of effective depth, d
For M20 grade of concrete and Fe 415 grade of steel
2 0.138 u ck M f bd Therefore, d= 6 92.376 10 365.89 0.138 20 250 x mm x x
Now assumed depth was =407mm Therefore, required< assumed
So, the section assumed is safe from bending moment point of view.
Since the available depth (407mm) is greater than required depth (365.89mm). So the section is under reinforced.
Calculation of steel reinforcement
The reinforcement for an under-reinforced section is given by Ast= 6 2 2 0.5 4.6 0.5 20 4.6 92.376 10 1 1 1 1 (250 407) 415 20 250 407 ck u y ck f M x x x bd x f f bd x x Ast=740.88mm2 %pt=100 740.88 0.728% 250 407x <pt,lim
Therefore, using 20 mm dia, no of bars required =740.88 2.35 3. (20)
4
Provide 3nos 20 diameter bar. Shear Reinforcement
As per IS 456:2000 Cl. No. 22.6.2, the critical section for shear is at a distance of ‗d‘ from the face of the support.
So, shear force at that distance, Vu =59.12-18.9187(0.25/2+0.407) = 49.05 KN. Nominal shear stress,
3 2 49.05 10 0.482 / 250 407 u v V x N mm bd x
% pt at support = 2 3 (20) 4 100 0.926% 250 407 x x x
As per IS 456:2000, table 19, the design shear strength of concrete, c for %pt=0.926 and M20 grade of concrete, c 0.61N mm/ 2
Since v c , no shear reinforcement is necessary. However, minimum shear reinforcement as per cl no 26.5.1.6 of IS 456:2000 should be provided.
2.175 0.4 0.87 sv y sv v v y A f A S bS f b
As per cl no 26.5.1.5 of IS 456:2000, maximum spacing of shear reinforcement least of the following
(a) 0.75d or (b) 300mm
Hence provide 2L-8 mm diameter @ 300mm c/c throughout the length of the beam. Check for Development length
As per cl no 26.2.1 of IS 456:2000, the development length Ld is given by
4 s d bd L bd
=1.2 N/mm2 for M20 grade of concrete.
For deformed bars conforming to Is 1786 these values shall be increased by 60%. 20 0.87 415 940.23 (4 ) 1.6 4 1.2 1.6 s d bd x x L mm x x x
Now as per cl no 26.2.3.3 (c) of IS 456:2000, at a simple support and at points of inflection, positive moment tension reinforcement shall be limited to a diameter such that Ld computed for fd does not exceed
1 0 M L V The value of M1
V in the above expression may be increased by 30% when the ends of the reinforcement are confined by a compressive reaction.
1 0 1.3 d M L L V
3 bars are available at supports.
.87 0.87 415 (3 314.15) 189 0.36 0.36 20 250 y st u ck o f A x x x x mm f b x x 1 0.87 ( 0.416 ) 0.87 415 (3 314.15)(407 0.416 189) 111.73 y st u M f A d x x x x x KN m V=59.12 KN
L0= greatest of effective depth of member or 12 =407mm 1 0 1.3M L 2.863m V Therefore,Ld 1.3M1 L0 V Reinforcement Detailing 6 m 3-20 2-10 450mm 2-10 2L-8 @ 300c/c 2L-8 @ 300c/c
One-way and Two-way Slabs
Figure 2.1(a) One-way slab (ly/lx>2)
Figure 2.1(b) Two-way slab (ly/lx<=2)
Figures 2.1a and b explain the share of loads on beams supporting solid slabs along four edges when vertical loads are uniformly distributed. It is evident from the figures that the share of loads on beams in two perpendicular directions depends upon the aspect ratio l
y /lx of the slab, l
x being the shorter span. For large values of ly, the triangular area is much less than the trapezoidal area (Fig. 2.1a). Hence, the share of loads on beams along shorter span will gradually reduce with increasing ratio of l
y /lx. In such cases, it may be said that the loads are primarily taken by beams along longer span. The deflection profiles of the slab along both directions are also shown in the figure. The deflection profile is found to be constant along the longer span except near the edges for the slab panel of Fig. 2.1a. These slabs are designated as one-way slabs as they span in one direction (shorter one) only for a large part of the slab when l
y /lx > 2.
On the other hand, for square slabs of l
y /lx = 1 and rectangular slabs of ly /lx up to 2, the deflection profiles in the two directions are parabolic (Fig. 2.1b). Thus, they are spanning in