Developing a GIS-based water poverty and rainwater harvesting
1suitability maps for domestic use in the Dead Sea region (West Bank,
2Palestine)
3Sameer M. Shadeed
1, Tariq G. Judeh
1, Mohammad N. Almasri
24
1Water and Environmental Studies Institute, An-Najah National University, Nablus, West Bank, Palestine 5
2Civil Engineering Department, An-Najah National University, Nablus, West Bank, Palestine 6
Correspondence to: Sameer M. Shadeed ([email protected]) 7
Abstract. In Dead Sea region as arid to semi-arid regions, water shortage and the inability to satisfy the increasing domestic 8
water demand have been threatening the sustainable development. In such situations, domestic rainwater harvesting is 9
considered an efficient management option to combat water poverty. This paper aims to develop a domestic water poverty 10
(DWP) and domestic rainwater harvesting suitability (DRWHS) maps for the West Bank, Palestine (5860 km2). The 11
Analytical Hierarchy Process (AHP) together with the GIS-based weighted overly summation process (WOSP) was utilized 12
in the development of these maps. A total of 12 and four different assessing criteria were used in the development of DWP 13
and DRWHS maps, respectively. Results of DWP map indicate that about 57 % of the West Bank is under high to very high 14
domestic water poverty. On the other hand, the DRWHS map indicates that about 60 % of the West Bank can be classified 15
as high to very high suitable areas for domestic rainwater harvesting. Furthermore, DWP and DRWHS maps intersection 16
indicates that around 31 % of the West Bank areas could be classified as high potential locations for adopting rainwater 17
harvesting techniques for domestic purposes. Finally, the developed maps are of high value for different stakeholders to 18
realize the importance of promoting rainwater harvesting for a self-sustaining and self-reliant domestic water supply in high 19
water poverty areas in the Dead Sea region generally and in the West Bank particularly. 20
Keywords: Water poverty mapping, rainwater harvesting suitability mapping, domestic water supply, water resources 21
management, AHP, GIS, Dead Sea, West Bank (Palestine). 22
1 Introduction 23
Water is the most influential and key limiting factor for sustainable development. In the 21st century, the most serious 24
challenge for millions of people, worldwide, is the lack of access to safe and clean water for domestic purposes (Worm and 25
Hattum, 2006). 26
In Dead Sea region, among which the West Bank (Palestine), water shortage is a dominant problem jeopardizing the 27
sustainability of water resources for different uses (PWA, 2011). This situation became worst further due to the population 28
growth and climate change that imposed a tremendous stress on the conventional water supplies (PWA, 2011). Furthermore, 29
the existing political situation controls the Palestinian accessibility to their water resources (Judeh et al., 2017). In 2015, the 30
estimated annual water supply-demand gap for domestic purposes for the entire West Bank is about 32 million cubic meters 31
(MCM) (PWA, 2015). However, the gap will increase unless the Palestinians gain access to their available surface and 32
ground water resources. 33
DWP map is a simple, straightforward and efficient tool to visualize and represent the spatial variation of domestic water 34
poverty index (DWPI) at governorate and country levels (Thakur et al., 2014). DWP map has several pros; it gives a better 35
understanding of the relationship between the physical availability of water, its quality and suitability for domestic use and 36
its accessibility. It also forms a tool for monitoring programs in the water sector and it helps in improving the situation of 37
communities that suffer from water poverty (van der Vyver and Jordaan, 2011). 38
The different areas within a governorate can be defined as water poor or water rich using water poverty index (WPI) approach. 39
WPI is not only limited to the physical availability of water, it also considers the social, economic, political and environmental 40
factors associated with water poverty (Coppin and Richards, 1990; Sullivan et al., 2003; Neupane et al., 2015). This approach 41
has been applied in the analysis of water stresses in many countries all over the world such as; United State of America 42
(James et al., 2007), India (Kher et al., 2012), South Africa, Tanzania and Sri Lanka (Mlote et al., 2002), Nepal (Thakur et 43
al., 2014), and West Bank (Palestine) (Isaac et al., 2008). 44
Generally, water-poor areas should lock for new, safe, sustainable and unconventional sources of water. For instance, 45
rainwater harvesting (RWH) has deemed as a viable alternative compared with other conventional water supply options 46
(Abdulrazzak, 2003). 47
RWH is the process of collecting and storing rainwater in order to be used afterwards for different uses among which the 48
domestic one (Siegert, 1994; Gould and Nissen-Petersen, 1999). It is considered an ancient technology that can be dated back 49
to biblical times (Evenari et al., 1971; Critchley et al., 1991). In Palestine and Greece, RWH had been extensively used 4000 50
years ago (Evenari et al., 1971; Critchley et al., 1991). 51
Adopting RWH will potentially enhance the economic, environmental and social development especially in arid and semi-52
arid regions under uncertainty of water supply (UNEP, 2009). The use of RWH for domestic purposes entails that water 53
quality is sufficiently good and within the allowable permissible limits of drinking water quality standards. Mostly, the 54
quality of harvested water can be controlled by proper practices (e.g. cleaning of collecting surface (roofs) and the flush away 55
of first storm) and simple disinfections techniques if needed (African Development Bank, 2010; Meera and Ahammed, 2018). 56
In arid and semi-arid regions, domestic water productivity was enhanced by adopting RWH for many years (Boers et al., 57
1986; Bruins et al., 1986; Critchley et al., 1991; Abu-Awwad and Shatanawi, 1997; van Wesemael et al., 1998; Oweis et al., 58
1999; Li et al., 2000; Li and Gong, 2002; Rosegrant et al., 2002; Ngigi et al., 2005; Ngigi, 2006; Oweis and Hachum, 2006; 59
Rockström and Barron, 2007; Mwenge Kahinda et al., 2007; Campisano et al., 2017; Singh and Turkiya, 2017; Tamaddun 60
et al., 2018). In the West Bank (Palestine), RWH is widely used at household level in rural areas (Shadeed, 2011). Shadeed 61
2011 found that approximately 40 % and 11 % of the West Bank areas are suitable and highly suitable for RWH for the 62
different uses, respectively. Shadeed and Lange 2010 have confirmed the possibility of RWH to bridge the deficiencies in 63
water supply in the Faria catchment located in the northeastern part of the West Bank. 64
This research aims at mapping the DWP and DRWHS maps for the entire West Bank. Thus, an integrated approach using 65
GIS-based MCDA was adopted. The MCDA approach entails that the choice is built on a predetermined and limited number 66
of decision variables (criteria) described by their attributes. Hence, the most influential criteria (layers) driving both DWP 67
and DRWHS mapping were identified, weighted and scored using AHP. GIS-based WOSP was then used to develop both 68
the DWP and DRWHS maps. 69
This paper is of high value as the spatial intersection between DWP and DRWHS maps were studied for the first time in the 70
West Bank. This in turn can help decision makers to enhance the sustainable management of the water resources in the high 71
domestic water poverty yet high rainwater harvesting suitable areas by adopting proper RWH techniques. 72
2 Study Area 73
West Bank (Palestine) is located to the west of the Dead Sea in the Middle East. It has an area of about 5,860 km2. 74
Administratively, it is divided into 11 governorates with a total population of approximately 2.9 million (PCBS, 2017) (see 75
Figure 1). 76
77
Figure 1: Regional Location of the West Bank 78
Water supply for different uses in the West Bank is very limited and does not enough to satisfy the increasing water demand. 79
Furthermore, the existing political situation adds another constraint on the availability and accessibility of water resources 80
for Palestinians. Water supply is being available either from local groundwater wells and springs or purchased from Israeli 81
Water Company (Mekorot). In 2015, the domestic water supply-demand gap in the West Bank was 32 MCM, whereas the 82
required domestic supply-demand gap (including losses) was about 65 MCM (PWA, 2015). In 2015, on ground RWH 83
techniques (e.g. cisterns, ponds and small scale dams) contribute to about 4 MCM for the domestic use and 3 MCM for the 84
agricultural use in the West Bank (PWA, 2016). According to PWA water strategy of 2018, 10 MCM is potentially collected 85
from adoption of different domestic and agriculture RWH techniques (PWA, 2016). 86
The West Bank can be classified as hot and dry during summer and cool and wet in winter (UNEP, 2003). Rainfall shows 87
high spatial and temporal variation, with long-term annual average rainfall of 450 mm, which is equivalent to rainfall volume 88
of about 2500 MCM (PWA, 2013). However, most of the annual rainfall (about 80 %) is usually occurred in winter (Shadeed, 89
2012). Under dry conditions, West Bank has a runoff curve number ranged from 21 to 74 with an average value of about 50 90
(Shadeed and Almasri, 2010). This is an indication of the high runoff potential in the country which should be utilized through 91
implementation of proper RWH techniques. 92
The land use map of the West Bank is classified into four main classes; rough grazing (62 %), agricultural practices (32 %), 93
built-up areas (5 %) and Israeli settlements (1 %) (MoA, 2017). Moreover, the West Bank is characterized by different soil 94
textures such as; clay, clay loam, loamy, sandy loam and bare rock covering 47, 31, 9, 8 and 5 % of the study area respectively 95
(MoA, 2017). The elevations in the study area ranges from 375 meter below mean sea level in the vicinity of the Dead Sea 96
in Jericho to 1000 meter above mean sea level in the mountains of Hebron (MoP, 1997). 97
3 Materials and Methods 98
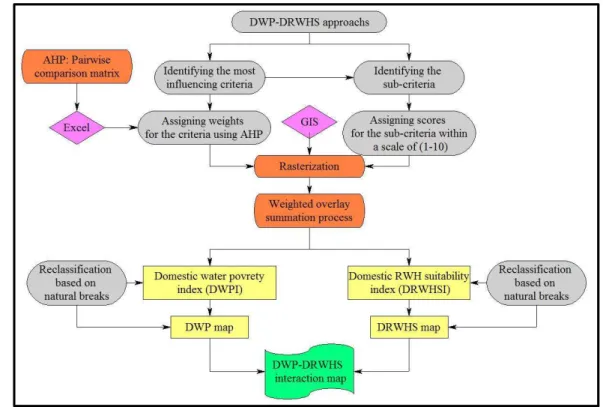
The overall methodological framework used in this research for developing both DWP and DRWHS maps for the entire 99
West Bank is illustrated in Figure 2. 100
101
Figure 2: methodological framework 102
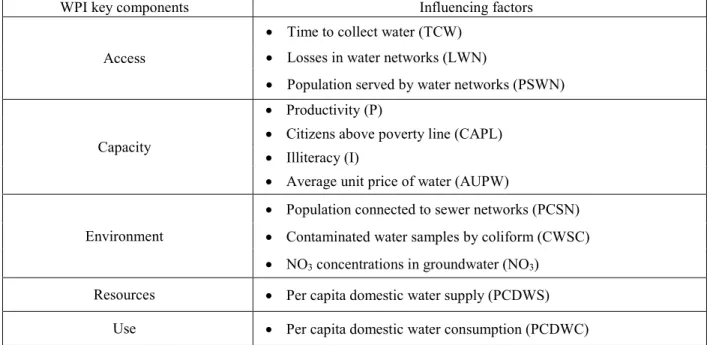
WPI explains water poverty in view of five key components; access, capacity, environment, resource and use (Gould and 103
Nissen-Petersen, 1999). In this study, the five key components were objectively represented by twelve influencing factors 104
(criteria) that affect the WPI in the West Bank (see Table 1). For these criteria, data were collected from different sources 105
which include; Palestinian Water Authority (PWA), Palestinian Central Bureau of Statistics (PCBS) and water departments 106
at municipalities. 107
The most influencing criteria on the DRWHS map in the West Bank were identified. These criteria are: rainfall depth 108
(RD), curve number (CN), surface slope (SS) and land use (LU). The spatial extent of the long term average annual RD 109
was obtained from the records of the existing rain-gauges using the inverse distance weighting method (IDW). The CN 110
map was developed for the entire West Bank (Shadeed and Almasri, 2010). The digital elevation model (DEM) was 111
processed to determine the SS layer. The LU map available at the Ministry of Agriculture (MoA) database was used. 112
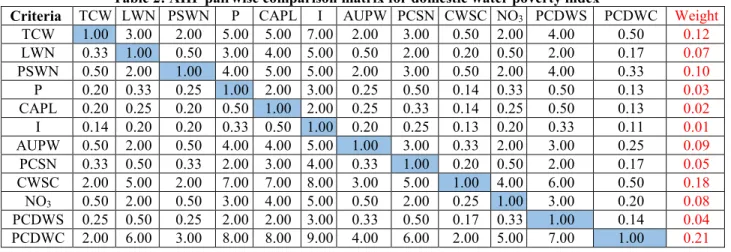
Different weights were assigned for the different criteria used in each map by conducting the AHP pairwise comparison 113
matrix. The matrices were filled using a scoring system (preference values) from (1 to 9) in order to reflect the preference 114
and importance of the used criteria (Saaty, 1980) (See Table 2 and Table 3). 115
Once the pairwise comparison matrices were completed by different preference values, the AHP provides researchers the 116
opportunity to check and enhance the matrices consistency. However, matrices consistency was measured by estimating the 117
consistency ratio using the following formulas (Saaty, 1980): 118 CR = 119
CI
=
120 Where, 121 CR consistency ratio 122 CI consistency index 123
RI random consistency index 124
λ normalized principal eigenvector 125
n number of constraints (criteria). 126
The matrix could be considered a consistent one if the CR valueis smaller or equal to 0.1. Otherwise, it is considered 127
inconsistent and needs to be revised (Saaty, 1996, 2000). According to the different preference values used in the pairwise 128
comparison matrices shown in Table 2 and Table 3, the CR values for DWP and DRWHS matrices were equal to 0.04 and 129
0.01 respectively. So, both of them are consistent. 130
Each of the criteria used in DWP and DRWHS maps were divided into five sub-criteria, each of them were assigned a score 131
from 1 to 10 (see Table 4 and Table 5). However, DWP and DRWHS increased as the score closed to 10. Thereafter, 132
rasterization (cell size of 100 m by 100 m) of the different criteria based on their sub-criteria scores were manipulated by 133
GIS (see Figure 3 and Figure 4). 134
135
Figure 3: The scored rasters of the 12 DWP criteria for the West Bank 136
137
Figure 4: The scored rasters of the four DRWHS criteria for the West Bank 138
GIS is used to estimate DWPI and DRWHSI through the application of WOSP for the different layers (criteria) used. WOSP 139
method applies a weighted linear formula in decision-making analysis (Store and Jokimäki, 2003). It combines the different 140
layers based on two main parameters; the scores for the different sub-criteria for each layer and the weight of the layer itself. 141
However, DWPI and DRWHSI were estimated using the following formula (Malczewski, 1999): 142
(DWPI or DRWHSI)i = ∑ Sij ∗ Wj 143
Where, 144
(DWPI or DRWHSI)i: the final DWP or DRWHS index for each cell i 145
Sij: the DWP or DRWHS score for each cell i in each layer j 146
Wj: the normalized weight for each layer j used in DWP or DRWHS maps. 147
4 Results and Discussion 148
4.1 DWP Map 149
Based on the methodological framework of the DWP mapping, and after performing the WOSP, the DWP map was 150
developed for the entire West Bank (see Figure 5). The map was classified into five water poverty categories (very low, 151
low, moderate, high, and very high) by natural breaks approach. 152
153
Figure 5: DWP map for the West Bank 154
Figure 5 shows that the governorates characterized by very high DWP are found to the very southern (Hebron) and very 155
northern parts (Jenin) of the West Bank which have about 36 % of the total West Bank population (PCBS, 2017). Bethlehem, 156
Nablus and Tubas governorates suffers from high DWP conditions. In contrast, the results indicate that Qalqiliya 157
governorate has the lowest DWP. Whereas low to medium DWP are prevailing in the other governorates. However, the area 158
percentages of the different DWP classes in the West Bank were estimated and illustrated in Figure 6. 159
160
Figure 6: Area percentages of the different DWP classes in the West Bank 161
Generally, the results presented in the previous figure summarize the domestic water shortage in the West Bank. The high 162
to very high DWP classes form the largest area in the West Bank (approximately 57 %), and includes around 59 % of the 163
total West Bank population. The areas characterized by moderate DWP conditions occupy about 24 % of the total West 164
Bank area, and includes around 21 % of the total West Bank population. However, low to very low DWP accounts for 19 165
% of the total West Bank area wherein 20 % of population are living. 166
4.2 DRWHS Map 167
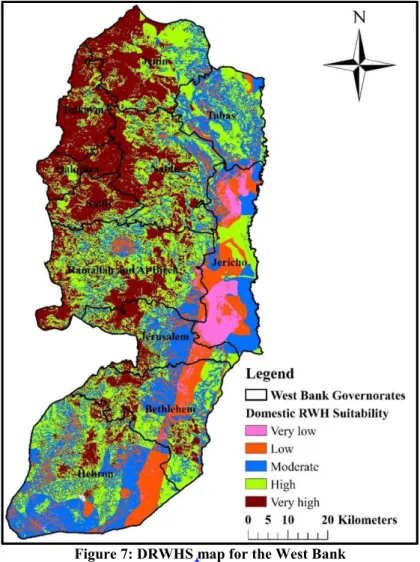
According to the methodological framework of the DRWHS mapping, and after performing the WOSP, the DWWHS map 168
was developed for the entire West Bank (see Figure 7). The map was classified into five suitability categories (very low, 169
low, moderate, high, and very high) by natural breaks approach. 170
171
Figure 7: DRWHS map for the West Bank 172
The developed DRWHS map indicates that the area characterized by very high suitable areas are distributed across the 173
north-western part of the West Bank, except for small portions that are located in the middle and southern mountains. In 174
contrast, the eastern part of the West Bank is classified as very low to low suitable areas. It is clear that the developed 175
DRWHS map is highly influenced by both RD and CN criteria. Where, the trend for rainfall and runoff potential increased 176
north-west and decreased south-east. 177
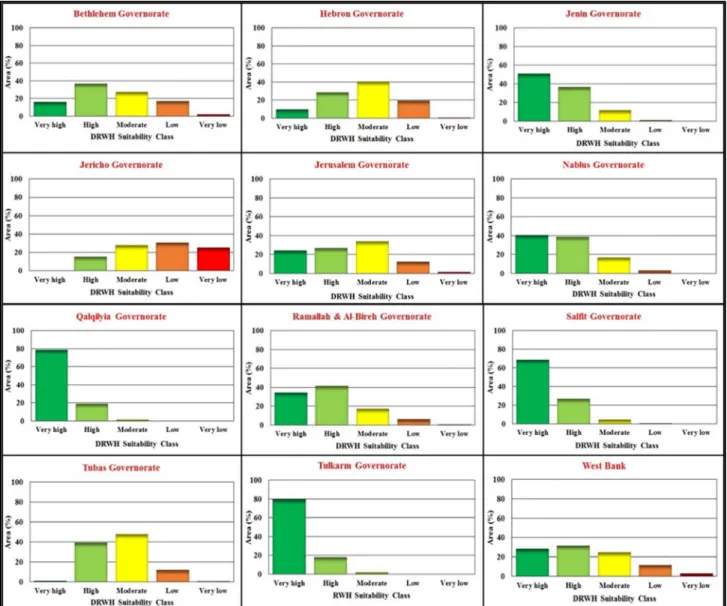
Generally, the area percentages of the different DRWHS classes in the different West Bank governorates are illustrated in 178
Figure 8. 179
180 181
182
Figure 8: Area percentages of the different DRWHS classes in the different West Bank governorates 183
It’s obvious that the high to very high DRWHS areas are dominant (75 %-95 %) in Qalqilyia, Tulkarm, Salfit, Jenin, Nablus 184
and Ramallah & Al-Bireh governorates. In general, about 60 % of the total West Bank areas are classified as high to very 185
high suitable for DRWH. This in turn indicates the high potential of adopting DRWH techniques in trying to bridge the 186
ongoing domestic supply-demand gap in the West Bank. 187
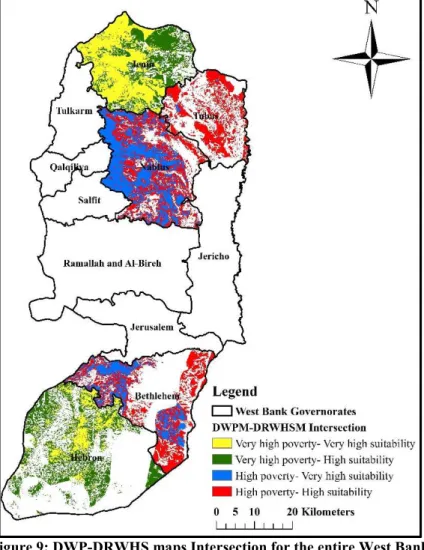
4.3 DWPM-DRWHSM Intersection 188
The developed DWP and DRWHS maps urged the need to identify high domestic water poverty areas yet highly suitable for 189
DRWH. Accordingly, spatial Intersection between both maps were conducted under the GIS environment with a special 190
focus on areas characterized by high to very high water poverty yet high to very high suitable for DRWH purposes. Results 191
are illustrated in Figure 9. 192
193
Figure 9: DWP-DRWHS maps Intersection for the entire West Bank 194
It is noticed that high to very high water poverty and rainwater suitability areas are located mostly in the northern and 195
southern parts of the West Bank which accounts for more than 30 % of the total West Bank area. 196
5 Conclusions 197
This paper came up to develop DWP and DRWHS mapping in the West Bank based on governorate scale by adopting an 198
integrated approach using GIS-based MCDA. Research results emphasize that the GIS-based MCDA can be used to provide 199
planners with a coherent and informative spatial DWP and DRWHS data. The use of MCDA for various influencing factors 200
is recognized to be valuable in the mapping of the DWP and DRWHS in the West Bank. Twelve and four criteria were 201
investigated to delineate DWP and DRWHS areas in the West Bank governorates respectively. The selection of these criteria 202
was affected by their impacts on DWP and DRWHS, and their availability. The AHP pairwise comparison matrix approach 203
was adopted to assign different criteria weights. It should be noticed that the obtained results have been subjective to the 204
uncertainty of the given data. Thus, it is essential to conduct a sensitivity analysis by changing the criteria weights and 205
criterion scores in order to quantify the severity of each one and to provide insights into the generated DWP and DRWHS 206
maps. The results of DWP map indicate that the high to very high DWP classes form approximately 75 % of the total West 207
Bank area. It is noticed that the spatial variations of DWP over different West Bank governorates are reliable and go in line 208
with PWA expectation. The DRWHS map indicates that there is high potential to adopt RWH especially in north-western 209
parts of the West Bank. Finally, although the available data are limited, the work provides an overall valuable picture about 210
the DWP and DRWHS in different West Bank governorates. This in turn indicates that even under data scarce regions and 211
limited resources yet much can be performed to assist the decision makers through providing of essential information to 212
mapping DWP and DRWHS areas, and thus to formulate proper strategies including the development of efficient and 213
comprehensive water resources management options in trying to bridge the increasing water supply-demand gap for 214
domestic purposes in the West Bank. The obtained results are promising to be regionalized for the entire Dead Sea region 215
which are facing a series water shortage challenges. 216
Acknowledgements 217
This work was performed within the framework of the Palestinian Dutch Academic Cooperation Program on Water 218
(PADUCO 2), funded by the Netherlands Representative Office (NRO) in Ramallah, Palestine. The financial support is 219
gratefully acknowledged. 220
References 221
Abu-Awwad, A. M., and Shatanawi, M. R. (1997). Water harvesting and infiltration in arid areas affected by surface crust: 222
Examples from Jordan. Journal of Arid Environments, 37(3), 443-452. [doi:10.1006/jare.1997.0301] 223
African Development Bank. (2010). Assessment of Best Practices and Experience in Water Harvesting: Rainwater 224
Harvesting Handbook. 225
Boers, T. M., Zondervan, K., and Ben-Asher, J. (1986). Micro-catchment-water-harvesting (MCWH) for arid zone 226
development. Agricultural Water Management, 12(1-2), 21-39. [doi:10.1016/0378-3774(86) 90003-X] 227
Bruins, H. J., Evenari, M., and Nessler, U. (1986). Rainwater-harvesting agriculture for food production in arid zones: The 228
challenge of the African famine. Applied Geography, 6(1), 13-32. [doi:10.1016/01 43-6228(86)90026-3] 229
Campisano, A., D'Amico, G., and Modica, C. (2017). Water Saving and Cost Analysis of Large-Scale Implementation of 230
Domestic Rain Water Harvesting in Minor Mediterranean Islands. Water MDPI AG, Basel, Switzerland. 231
Coppin, N.J., and Richards, I.G. (1990). Use of Vegetation in Civil Engineering. Construction Industry Research and 232
Information Association, London. 233
Critchley, W., Siegert, K., Chapman, C., and Finkel, M. (1991). Water harvesting: A Manual for the Design and 234
Construction of Water Harvesting Schemes for Plant Production. Rome: Food and Agriculture Organization of the 235
United Nations. 236
Evenari, M., Shanan, L., and Tadmor, N. (1971). The Negev: The Challenge of a Desert. Cambridge, Massachusetts: 237
Harvard University Press. 238
Gould, J., and Nissen-Petersen, E. (1999). Rainwater Catchment Systems for Domestic Supply: Design, Construction and 239
Implementation. London: Intermediate Technology Publications. 240
Isaac,J., Gigliol, I., and Hilal,J. (2008). Domestic Water Vulnerability Mapping in the West Bank /Occupied Palestinian 241
Territory. Applied Research Institute, Jerusalem. 242
James, W., Lisa, H., and Rebecca,T. (2007). Water and Poverty in the United States. Geoforum. 38. 801-814. 243
10.1016/j.geoforum.2006.08.007. 244
Judeh, T., Haddad, M., and Özerol, G. (2017). Assessment of water governance in the West Bank, Palestine. International
245
journal of global environmental issues, 16(1-3), 119-134. [DOI: 10.1504/IJGENVI.2017.083426] 246
Kher, J., Aggarwal,S., and Punhani, G. (2012). Climate Change and Water Poverty: The Indian Scenario. Indian Research 247
Journal of Extension Education, Special Issue (Volume II). 248
Li, F. R., Cook, S., Geballe, G. T., and Burch, W. R. (2000). Rainwater harvesting agriculture: An integrated system for 249
water management on rainfed land in China’s semiarid areas. AMBIO, 29(8), 477-483. 250
Li, X. Y., and Gong, J. D. (2002). Compacted microcatchments with local earth materials for rainwater harvesting in the 251
semiarid region of China. Journal of Hydrology, 257(1-4), 134-144. [doi:10.1016/S0022-1694(01)00550-9] 252
Malczewski, J. (1999). GIS and Multicriteria Decision Analysis. John Wiley & Sons, Inc. New York, 392pp. 253
Meera, V., and Ahammed, M. (2018). Factors Affecting the Quality of Roof-Harvested Rainwater. In: Sarma, A., Singh, 254
V., Bhattacharjya, R., and Kartha S. (eds) Urban Ecology, Water Quality and Climate Change. Water Science and 255
Technology Library, vol 84. Springer, Cham. 256
Ministry of Agriculture (MoA). (2017). GIS based data based. 257
Ministry of Planning (MoP). (1997). MoP Database. Open Files and Personal Communications. Ramallah, Palestine. 258
Mlote, S., Sullivan, C., and Meigh, J. (2002). Water poverty index: a tool for integrated water management. 259
Mwenge Kahinda, J., Taigbenu, A.E., and Boroto, R.J. (2007). Domestic rainwater harvesting to improve water supply in 260
rural South Africa. J. Phys. Chem. Earth 32, 1050–1057. 261
Neupane, M., and Bhatta, M.R., et al. (2015). GIS supported Water Use Master Plan: a planning tool for Integrated Water 262
Resources Management in Nepal. In: Srivastava, P.K., Pandey, P.C., Kumar, P., Raghubanshi, A.S., Han, D. (Eds.), 263
Geospatial Technology for Water Resource Development. Taylor and Francis. 264
Ngigi, S. N., Savenije, H. H. G., Rockström, J., and Gachene, C. K. (2005). Hydro-economic evaluation of rainwater 265
harvesting and management technologies: Farmers’ investment options and risks in semi-arid Laikipia district of 266
Kenya. Physics and Chemistry of the Earth, Parts A/B/C, 30(11-16), 772-782. [doi: 10.1016/j.pce.2005.08.020] 267
Ngigi, S.N. (2006). Hydrological impacts of land use changes on water resources management and socio-economic 268
development of upper Ewaso Ng’iro river basin in Kenya. PhD Dissertation, UNESCO-IHE/Technical University 269
of Delft, Netherlands. AA Balkema Publishers, The Hague. 270
Oweis, T., and Hachum, A. (2006). Water harvesting and supplemental irrigation for improved water productivity of dry 271
farming systems in West Asia and North Africa. Agr. Water Manage. 80, 57–73. 272
Oweis, T., Hachum, A., and Kijne, J. (1999). Water Harvesting and Supplemental Irrigation for Improved Water Use 273
Efficiency in Dry Areas. Colombo, Sri Lanka: International Water Management Institute. 274
Palestinian Central Bureau of Statistics (2017). Population. Retrieved March 25, 2018, from 275
http://www.pcbs.gov.ps/Downloads/book2364.pdf 276
PWA (2011). Annual Status Report on Water Resources, Water Supply, and Wastewater in the Occupied State of Palestine. 277
PWA (2013). Palestinian Water Sector: Status report of water resources in the occupied state of Palestine. 278
PWA (2015). Unpublished Water Supply Report. 279
PWA (2016). Water Authority Strategic Plan 2016-2018. 280
Rockström, J., and Barron, J. (2007). Water productivity in rainfed systems: overview of challenges and analysis of 281
opportunities in water scarcity prone savannahs. Irrigation Sci. 25 (3), 299–311. 282
Rosegrant, M.W., Cai, X., and Cline, S.A. (2002). World Water and Food to 2025: Dealing with Scarcity. International 283
Food Policy Research Institute (IFPRI), Washington, DC. 284
Saaty, T.L. (1980) The Analytic Hierarchy Process: Planning, Priority Setting, Resource Allocation, McGraw-Hill 285
Saaty, T.L. (1996) Decision Making for Leaders: The Analytic Hierarchy Process for Decisions in a Complex World, RWS 287
Publication, Pittsburgh, PA. 288
Saaty, T.L. (2000) Fundamentals of Decision Making with the Analytic Hierarchy Process, RWS Publications, Pittsburgh, 289
PA. 290
Shadeed, S. (2011). Developing a GIS-based Suitability Map for Rainwater Harvesting in the West Bank, Palestine. 291
Professional Environmental Education for Sustainable Development: Plugging the Hole. International Conference. 292
Birzeit University, Palestine, November 2011. 293
Shadeed, S. (2012). Spatio-temporal Drought Analysis in Arid and Semi-arid Regions: A Case Study from Palestine. The 294
Arabian Journal for Science and Engineering. 38: 2303. 295
Shadeed, S., and Almasri, M. (2010). Application of GIS-based SCS-CN method in West Bank catchments, Palestine. Water 296
Science and Engineering, 2010, 3(1): 1-13.[doi:10.3882/j.issn.1674-2370.2010.01.001] 297
Shadeed, S., and Lange, J. (2010). Rainwater Harvesting to Alleviate Water Scarcity under Dry Conditions: a Case Study 298
in Faria Catchment, Palestine. Water Science and Engineering, 3(2): 132-143. [doi:10.3882/j.issn.1674-299
2370.2010.02.002]. 300
Siegert, K. (1994). Introduction to water harvesting: Some basic principles for planning, design and monitoring. Water 301
harvesting for improved agricultural production. Proceedings of the FAO Expert Consultation. Cairo, Egypt. 302
Singh, O., and Turkiya, S. (2017). Assessing Potential for Rooftop Rainwater Harvesting: An Option for Sustainable Rural 303
Domestic Water Supply in Arid Region of Haryana. Journal of Rural Development. 36. 49-60. 304
10.25175/jrd/2017/v36/i1/112701. 305
Store, R., and Jokimäki, J. (2003). ‘A GIS-based multi-scale approach to habitat suitability modeling’, Ecological 306
Modelling, Vol. 169, No. 1, pp.1–15. 307
Sullivan, C., Meigh, J., Giacomello, A., Fediw, T., Lawrence, P., Samad, M., Mlote, S., Hutton, C., Allan, J., Schulze, R., 308
Dlamini, D., Cosgrove, W., Priscoli, J., Gleick, J., Smout, I., Cobbing, J., Calow, R., Hunt, C., Hussain, A., 309
Acreman, M., King, J., Malomo, S., Tate, E., O'Regan, D., Milner, S., and Steyl, I. (2003). The Water Poverty Index: 310
Development and application at the community scale. Caroline A Sullivan. [DOI: 27. 10.1111/1477-8947.00054] 311
Tamaddun, K., Kalra, A., and Ahmad, S. (2018). Potential of rooftop rainwater harvesting to meet outdoor water demand 312
in arid regions. Journal of Arid Land. 10. 68-83. 10.1007/s40333-017-0110-7. 313
Thakur, J., Mahesh, N., and Mohanan, A. (2017). Water poverty in upper Bagmati River Basin in Nepal. Water Science. 314
31. 10.1016/j.wsj.2016.12.001. 315
United Nations Environment Programme (UNEP). (2003). Desk Study on the Environment in the Occupied Palestinian 316
Territories. Nairobi. 317
United Nations Environment Programme (UNEP). (2009). Rainwater Harvesting: A Lifeline for Human Well-Being. 318
Stockholm, Sweden: Stockholm Environment Institute. 319
van der Vyver, C., and Jordaan, D. (2011). Water Poverty Mapping and its Role in Assisting Water Management. 320
Communications of the IBIMA [DOI: 10.5171/2011.941217]. 321
van Wesemael, B., Poesen, J., Benet, A. S., Barrionuevo, L. C., and Puigdefábregas, J. (1998). Collection and storage of 322
runoff from hillslopes in a semi-arid environment: Geomorphic and hydrologic aspects of the aljibe system in 323
Almeria Province, Spain. Journal of Arid Environments, 40(1), 1-14. [doi: 10.1006/jare.1998.0429] 324
Worm, J., and Hattum, V. (2006). Rainwater harvesting for domestic use. Wageningen: Agromisa Foundation and CTA. 325
Table 1: WPI components and the associated influencing factors 326
WPI key components Influencing factors
Access
• Time to collect water (TCW)
• Losses in water networks (LWN)
• Population served by water networks (PSWN)
Capacity
• Productivity (P)
• Citizens above poverty line (CAPL)
• Illiteracy (I)
• Average unit price of water (AUPW)
Environment
• Population connected to sewer networks (PCSN)
• Contaminated water samples by coliform (CWSC)
• NO3 concentrations in groundwater (NO3) Resources • Per capita domestic water supply (PCDWS)
Use • Per capita domestic water consumption (PCDWC) 327
Table 2: AHP pairwise comparison matrix for domestic water poverty index 328
Criteria TCW LWN PSWN P CAPL I AUPW PCSN CWSC NO3 PCDWS PCDWC Weight
TCW 1.00 3.00 2.00 5.00 5.00 7.00 2.00 3.00 0.50 2.00 4.00 0.50 0.12 LWN 0.33 1.00 0.50 3.00 4.00 5.00 0.50 2.00 0.20 0.50 2.00 0.17 0.07 PSWN 0.50 2.00 1.00 4.00 5.00 5.00 2.00 3.00 0.50 2.00 4.00 0.33 0.10 P 0.20 0.33 0.25 1.00 2.00 3.00 0.25 0.50 0.14 0.33 0.50 0.13 0.03 CAPL 0.20 0.25 0.20 0.50 1.00 2.00 0.25 0.33 0.14 0.25 0.50 0.13 0.02 I 0.14 0.20 0.20 0.33 0.50 1.00 0.20 0.25 0.13 0.20 0.33 0.11 0.01 AUPW 0.50 2.00 0.50 4.00 4.00 5.00 1.00 3.00 0.33 2.00 3.00 0.25 0.09 PCSN 0.33 0.50 0.33 2.00 3.00 4.00 0.33 1.00 0.20 0.50 2.00 0.17 0.05 CWSC 2.00 5.00 2.00 7.00 7.00 8.00 3.00 5.00 1.00 4.00 6.00 0.50 0.18 NO3 0.50 2.00 0.50 3.00 4.00 5.00 0.50 2.00 0.25 1.00 3.00 0.20 0.08 PCDWS 0.25 0.50 0.25 2.00 2.00 3.00 0.33 0.50 0.17 0.33 1.00 0.14 0.04 PCDWC 2.00 6.00 3.00 8.00 8.00 9.00 4.00 6.00 2.00 5.00 7.00 1.00 0.21 329
Table 3: The AHP pairwise comparison matrix for domestic rainwater harvesting suitability index 330 Criteria RD CN SS LU Weight RD 1.00 1.50 1.50 2.50 0.35 CN 0.67 1.00 1.50 2.50 0.31 SS 0.67 0.67 1.00 1.50 0.21 LU 0.40 0.40 0.67 1.00 0.13 331
Table 4: DWP scoring assigned for the sub-criteria 332
# Criteria Sub-criteria Score # Criteria Sub-criteria Score
1 TCW <6 (days/month) 10 7 AUPW >5.2 (NIS/m3) 9 6-12 8 4.6-5.2 7 13-19 6 3.9-4.5 5 20-26 4 3.2-3.8 3 >26 2 <3.2 1 2 LWN ≥36 (%) 8 8 PCSN ≤20 (%) 10 31-35.9 7 21-30 9 26-30.9 5 31-40 8 21-25.9 4 41-50 7 <21 2 >50 5 3 PSWN 76-80 (%) 6 9 CWSC 26-30 (%) 10 81-85 5 21-25 8 86-90 4 16-20 6 91-95 3 11-15 4 96-100 1 6-10 2 4 P <1 (Emp/1000 c) 9 10 NO3 ≥80 (mg/l) 10 1.0-1.4 7 60-79 8 1.5-1.9 5 40-59 6 2.0-2.4 3 20-39 3 ≥2.5 1 <20 1 5 CAPL 65.1-72 (%) 9 11 PCDWS <80 10 72.1-79 7 80-119 8 79.1-86 5 120-159 7 86.1-93 3 160-199 5 93.1-100 1 ≥200 2 6 I 4.5-5.0 (%) 6 12 PCDWC <40 10 3.9-4.4 5 40-79 8 3.3-3.8 4 80-119 6 2.7-3.2 3 120-159 4 2.1-2.6 2 ≥160 2 333
Table 5: The domestic rainwater harvesting suitability scoring assigned for the sub-criteria 334
# Criteria Sub-criteria Score # Criteria Sub-criteria Score
1 RD 153.0-262.1 (mm) 1 3 SS ≥24.0 1 262.2-371.3 3 18-23.9 3 371.4-480.5 5 12-17.9 5 480.6-589.7 7 6-11.9 7 589.8-699.0 9 ≤5.9 9 2 CN ≤50 1 4 LU Israeli settlements 1
51-60 3 Forest and rough
grazing 3
61-70 5 Permanent crops and
irrigated farming 3
71-80 7 Arable land 3
>80 9 Built-up areas 7