TECHNICAL EFFICIENCY AND ITS
DETERMINANTS: A PANEL DATA ANALYSIS OF
INDIAN PUBLIC AND PRIVATE SECTOR BANKS
Dharmendra Singh* and Garima Malik
Abstract
Research aim: The purpose of this paper is to measure the performance of Indian public and private sector banks by estimating their technical efficiency scores and further to investigate the factors affecting technical efficiency of Indian banks. This paper also investigates the ownership effect on the technical efficiency of the banks.
Design/ Methodology/ Approach: Data envelopment analysis (DEA), CCR model was used to estimate relative efficiency scores of 39 banks using annual data for the time period 2012 to 2016. Further Pooled regression model was used to examine the determinants of bank efficiency and one-way ANOVA to
investigate the ownership effect on bank’s technical efficiency.
Research finding: The results showed a significant difference between the efficiencies of the public and private sector banks. During the sample period the average efficiency score of Indian banks has been improving from 0.78 in 2012 to 0.81 in 2016. Further, the new private sector banks turned out to be more efficient than public and old private sector banks. The regression results show that profitability and staff productivity are the only significant variables affecting efficiency. Bank size and GDP are found to be insignificant at 5 per cent.
Theoretical contribution/ Originality: The paper considers a much broader approach to investigating the technical efficiency of Indian banks. This is the first study that examines and compares the efficiency of Indian commercial into three bank categories; public sector banks, new private sector banks and old private sector banks.
Practitioner/ Policy implication: The findings of this study are expected to provide useful insights to the Reserve Bank of India (RBI) for policy making, in general, for all the banks. RBI needs to closely monitor the working and performance of inefficient public sector banks in India. Indian government perhaps can consider to merge these inefficient banks in order to make them more competitive.
Research limitation/ Implication: Future work could extend this study by working on efficiency and the degree of competition among Indian banks.
*Corresponding Author: Dharmendra Singh, PhD is an Assistant Professor, Modern College of Business and Science, Muscat, Oman. Email: [email protected]
There is also a scope of doing research on impact of service quality dimensions on technical efficiency of banks in India.
Keywords: Commercial Banks, DEA, Indian Banking Sector, Regression, Technical Efficiency
Type of article: Research paper JEL Classification: G21, C24
1. Introduction
India has experienced an exemplary shift in the world economy; slowly and gradually it is becoming a destination for investors from across the world. Recently, the Indian government introduced a constructive road map for the robust growth path of the Indian economy, which would lead to the inflow of foreign capital in the Indian capital market and a steady growth rate in GDP. The banking sector of India was found to be strong during the phenomenal US sub-prime crisis. The banking sector in India has become one of the most growth-oriented sectors in recent times with the opening of a large number of private and foreign banks in the country. The contribution of the Indian banking sector to the GDP is about 7.7 per cent.
A sound financial system is crucial and indispensable for stability and growth to the various sectors of the Indian economy. In order to test the soundness of the banking system, bank management can validate the suitability of their policies and strategies or can even revise them by measuring the bank efficiency at regular intervals. The efficiency of banks is directly linked to the productivity of the economy (Kumar & Gulati, 2008). Therefore, for the smooth functioning of an economy, a robust and efficient banking system is a prerequisite. Hence, the measurement of banking efficiency studies in any economy is vital for operational as well as academic purposes (Berger & Humphery, 1997). The relative efficiency of banks is always meaningful as efficient banks are in a better position to compete and to deliver better services and satisfaction to their customers at a rational price. Customer satisfaction is a key to succeed in this business, and, therefore, bank efficiency is always a serious subject for all the stakeholders of a bank.
developments largely depends on the performance of Indian banks. Another important development was seen in the import payments. According to the Economic Times, (22 February 2016) the import payments for India contracted by 15.0 per cent to US$ 381.0 billion in 2015-16; the prime reason being a sharp decline in the international price of crude oil, which declined by about 45 per cent during the year. After the formation of a new government at the centre, the Indian economy has shown signs of revival after a decade long slump.
India is an important country at the world level, in which the banking sector is of significant size and has a considerable impact on the economy. According to a joint report of KPMG and the Confederation of Indian Industries (CII), the banking sector of India is set to become the fifth largest sector of the economy by 2020. According to the report, bank credit is also likely to grow at a compounded annual growth rate of 17 percent in future.
2. Literature Review
In the existing literature, DEA has been applied to various studies across the globe to measure the performance of the banking industry. The Luther Committee (1977) was the first work on bank efficiency in India followed by studies on technical efficiency by Bhattacharya et al. (1997), Das (2000), Chakrabarti and Chawla (2005), Ray (2007) and so on. Bhattacharya et al. (1997) examined the productive efficiency of 70 Indian commercial banks by calculating their technical efficiency scores during 1986-1991. The results indicated that government banks were more efficient than foreign banks and that the least efficient were the domestic private owned banks. Rakesh Arrawatia (2015) measured the relationship between competition and the efficiency of Indian banks using DEA. The outcomes presented an increase in competition for the period 1996 to 2004, and, after that, there was a fall in the degree of competition. Wozniewska (2008) analysed the efficiency of the banks operating in Poland from 2000–2007 where two methods were used to measure efficiency; a classical method based on the balance sheet and DEA. It was discovered that both methods gave similar results, and it was therefore concluded that DEA is a valuable non-parametric technique for measuring the efficiency of banks.
In another study (Alrafadi, Kamaruddin, & Yusuf, 2015), DEA was used to measure the technical efficiency and its determinants in Libyan banks from 2004 to 2010. In the second stage analysis, identification of the determinants of the efficiency was done using the Tobit regression model and the results exhibited a positive relationship between efficiency and ROA, and capital adequacy and bank size. Singh and Fida (2015) conducted DEA as a first stage and Tobit as a second stage analysis on domestic commercial banks in Oman for 2009 to 2015. They concluded that liquidity, capital adequacy, and profitability were the significant positive determinants of bank technical efficiency. Bank size proved to be an insignificant determinant of bank efficiency.
model. The observation from the study was that banks with a larger workforce were relatively more inefficient.
In a more recent study, Batir, Volkman and Gungor (2017) examined the technical, allocative, and cost efficiency of two groups of banks in Turkey using the DEA method. The intermediation approach was used to select the input and output variables for measuring the efficiency. They found that loan quality and expenses were significant variables that had a positive relation with the efficiency of the participation banks and a negative relation with the efficiency of conventional banks. There was no significant association between bank deposits and efficiency for the participation banks; however, in the conventional banks there was a significant negative association. Yüksel, Mukhtarov and Mammadov (2016) examined the technical efficiency of Turkish and Azerbaijani banks using the DEA method during 2010 to 2014. They found the Turkish banks to be more efficient than the Azerbaijani banks.
efficiency whereas the public sector banks showed a significant decrease in their OTE scores. Improper size and resource allocation were the main reasons for inefficiency in the Indian banks.
Various studies on bank efficiency arrived at diverse conclusions because of the different timing of the studies and the use of dissimilar variables. There is evidently a state of indecisiveness concerning the comparison of the efficiency of private versus public sector banks, as a few researchers, like Bhattacharyya et al. (1997), and Das and Ghosh (2006) concluded that private sector banks are less efficient than public sector banks, while authors like Chakrabarti and Chawla (2005), and Chatterjee and Sinha (2006) commented that private banks are comparatively better. Das (1997) used cross-sectional data of 65 commercial banks using non-parametric frontier methodology to measure efficiency. The results indicated that banks in India were suffering from the improper allocation of resources.
Berger and Humphrey (1997) pointed out that the representation of efficiency studies from developing countries was about 5 per cent whereas about 75 per cent focused on the US and the developed economies of the world. A close look at the available literature on bank efficiency indicates that very few studies cover all the banks in India, and, above all, the impact of ownership on the efficiency of Indian banks is indecisive. The Reserve Bank of India (RBI) defined two groups of private sector banks – old private sector banks and new private sector banks. To the best of the authors’ knowledge all the previous studies considered old and new private banks under the group ‘private sector’ banks. In contrast, this study is based on three groups; public sector banks, old private sector banks, and new private sector banks. Considering new private sector banks as a different group will definitely add value to the existing literature. Thus, the idea behind this study is to enrich the existing literature by providing the latest indication of the technical efficiency of Indian banks and its determinants.
3. Methodology
3.1. DEA Methodology
Rhodes (1978); however, the work was a reinvention of the work done by Farrel (1957) on the concept frontier analysis. Afterwards, parametric and non-parametric frontier analysis techniques have been widely applied in banking efficiency and productivity.
The estimation of technical efficiency can be done in two ways, one as input-oriented and the other as output oriented. The objective of the input-oriented approach is to minimize the input for a given level of output, and for the output-oriented approach the objective is to maximize output for a given level of input. We will obtain different values for the input-oriented and output-oriented measures under the variable return to scale (VRS) assumption, but under the constant return to scale (CRS) assumption the two values are always the same.
DEA is a relative measure of the efficiency in which the efficiency score ranges between zero and one. The computed DEA scores are not absolute they are relative, so, if the sample changes, the most efficient firm in the first sample may become relatively inefficient in the second sample. Hence, for better results, it is advisable to work with a larger sample. The DEA technique has been used in several empirical studies on the banking sector; for example, Tyagarajan (1975), Rangarajan and Mampilly (1972), Subramanyam (1993), Chatterjee (1997), Saha et al. (2000), and Charnes et al. (1978).
3.2. DEA Mathematical Model
Consider n banks to be evaluated, bankr (r = 1,2,3,…n). Where each bank
uses i different amounts of inputs in which i varies from 1 to k number of inputs and produces j different outputs, and j varies from 1 to l number of outputs. Therefore, bankr uses xir amount of inputs to yield an output
of yjr amount. There is an assumption that these inputs and outputs are
non-negative. The objective of the output-oriented CRS model is to maximize the ratio of weighted outputs to the given weighted inputs for the bank under study. The objective function, defined by ar, for rth bank,
is maximized with the condition as given below. Therefore, the objective function is:
𝑀𝑎𝑥 𝑎𝑟 = ∑ 𝑢𝑗𝑦𝑗𝑟
𝑙 𝑗=1
∑𝑘 𝑣𝑖𝑥𝑖𝑟
𝑖=1
Subject to condition
∑𝑙 𝑢𝑗𝑦𝑗𝑟
𝑗=1
∑𝑘 𝑣𝑖𝑥𝑖𝑟
𝑖=1
≤ 1 (a)
where
i is the ith input and values ranging from 1 to k j is the jth output and values ranging from 1 to l r is the number of banks ranging from 1 to n ar is the measure of efficiency for rth bank uj is the weight selected for output j vi is the weight selected for input i.
The above-mentioned objective function is fractional; hence, for it to solve the problem, either the numerator or the denominator has to be equal to unity. After meeting the above-mentioned condition, the objective function will become a linear programming problem. When the denominator is equal to unity the problem will be solved using an output-oriented approach where the objective is to maximize output for a given level of input. Therefore, the linear programming form is as follows:
𝑀𝑎𝑥 𝑎𝑟 = ∑ 𝑢𝑗𝑦𝑗𝑟
𝑙 𝑗=1
∑𝑘 𝑣𝑖𝑥𝑖𝑟
𝑖=1
Subject to
∑ 𝑣𝑖𝑥𝑖𝑟 = 1
𝑘
𝑖=1
∑ 𝑢𝑗𝑦𝑗𝑟
𝑙
𝑗=1
− ∑ 𝑣𝑖𝑥𝑖𝑟 ≤ 0
𝑘
𝑖=1
𝑢𝑗, 𝑣𝑖 ≥ 0
j=1,2,……l, i = 1,2,….k and r =1,2,…..n
3.3. Data and Variables
time period of the study is from 2012 to 2016. Among the public sector banks, SBI associate banks and IDBI bank were not considered in the list of sample banks. All the SBI associate banks have limited presence in the country and they have the same brand name as the State Bank of India (SBI); hence, only SBI is considered in the sample, not its associate banks. The reason for excluding the IDBI bank is that it is primarily a development bank in India, and, hence, its services are different from other commercial banks in the sample.
In the available banking literature, there are divergent views concerning the selection of input and output variables of the banks in respect of the estimation of relative efficiency (Casu, 2002; Sathye, 2003). From the existing literature it has been noted that the production and intermediation approach are the two key approaches used by the authors. Sharma et al. (2013) critically reviewed 106 studies published across the world from 1994 to 2011 and found that the intermediation approach was used in 57 percent of the studies, the production approach in 22 percent of the studies, the value added approach in 15 percent of the studies, and other approaches in 6 percent of the studies. The production approach was pioneered by Benston (1965), and was adopted by Sathye (2001), Neal (2004) and many others. Under the production approach, banks are considered to be a production unit where they use inputs and resources like fixed assets, manpower, and capital to produce deposits, loans, and other fee-based banking services. Under the intermediation approach, which was pioneered by Sealey and Lindley (1977), banks are considered to be an intermediary between savers and borrowers to channelize funds from units in surplus to units in deficit. The other approaches commonly used by the authors are the value added approach, asset approach, and the operating approach. Berger and Humphrey (1997) stated that to measure the relative efficiency of a bank with all the other banks, the intermediation approach is suitable, whereas for measuring the relative efficiency of different branches of the same bank the production approach is suitable.
confusion concerns ‘deposits’, as they have been concurrently used as an input and output variable, and, unfortunately, there is no consensus concerning the choice of variables used for calculating the relative efficiency scores.
The authors of the present study decided to use the intermediation approach for selecting the input and output variables as this is the most popular approach and is suitable for measuring the efficiency at the bank level. Physical capital (net fixed assets), the number of full-time staff, and loanable funds were selected as input variables (As in Kumar and Verma (2003), Ram Mohan and Ray (2003), Jagwani, B. (2012), Roy, D. (2014), Alrafadi et al. 2015). Here, loanable fund is the sum of the deposits and borrowed funds. ‘Non-interest income’ and ‘net interest income’ represent the two output variables for this study.
The net interest income is calculated by deducting the interest expenses from the interest income of the bank. The net interest income is also known as the interest spread, which represents the net income from the conventional banking activities. The second output ‘non-interest income’ represents the fee-based income of banks like commission and brokerage. This variable has become increasingly important, as, according to the Indian banking data from 2016, the percentage of non-interest income to non-interest income was 12.1 per cent for public sector banks and 19.5 per cent for private sector banks, which is a significant percentage of the total income for banks and an indication of the increase in non-conventional banking activities
.
3.4. Pooled Regression Model
In stage two of this research, the relative technical efficiency scores are regressed on the determinants of bank efficiency. According to the literature, these efficiency scores can be regressed using ordinary least squares (OLS) (Sufian et al., 2007), Tobit regression (Casu & Molyneux, 2003; Das & Ghosh, 2006), fixed and random effect panel data regression (Fiordelisi & Molyneux, 2010; Bonin et al., 2005), and logit and probit regression (Isik & Darrat, 2009). For the second stage analysis panel data regression and Tobit are widely applied techniques to assess the impact of determinants on the efficiency and productivity change of the banking industry (Sharma et al. 2013). In their review of 106 studies based on bank efficiency, they observed that 27 per cent of the studies used panel data regression, 25 per cent used Tobit regression, 15 per cent used ordinary least squares (OLS), and 33 per cent used other methods.
always considered better than cross-sectional or time-series data as panel data have two dimensions and provide a greater degree of freedom and less collinearity. The equation below represents the regression model used:
Yit= β1+ β2X2it+ β3X3it+ β4X4it+ β5X5it+ β6X6it + εit
where
Yit is technical efficiency
X2, X3, X4, X5 and X6 represent the predictor variables mentioned
above
εit represents the stochastic error term i = 1,2,3 …….n (cross-section)
t = 1,2,3…….j (time series)
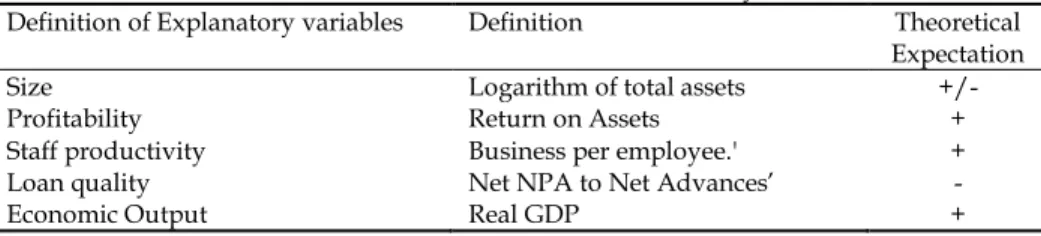
Table 1 refers to the selected explanatory variables for the pooled regression and their expected behaviour from the available literature. Internal bank variables like ‘Net NPA to Net Advances’ as a proxy for loan quality, ‘ROA’ as a proxy for profitability, ‘business per employee’ as a proxy for staff productivity, and ‘natural log of total assets’ as a proxy for bank size were selected as the explanatory variables for this regression. Apart from the bank internal variables ‘real gross domestic product’ as a proxy for economic performance was also used as a fifth regressor in the pooled regression model to determine the factors affecting the technical efficiency of banks. The choice of real GDP is considered better than nominal GDP as it is free from distortions like inflation.
Table 1. Determinants of bank efficiency
Definition of Explanatory variables Definition Theoretical Expectation
Size Logarithm of total assets +/-
Profitability Return on Assets +
Staff productivity Business per employee.' +
Loan quality Net NPA to Net Advances’ -
Economic Output Real GDP +
4. Empirical Analysis
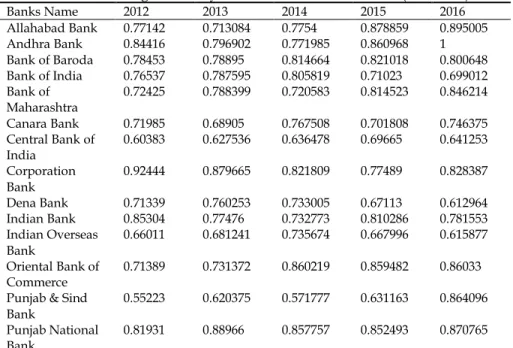
Table 2 in the appendix shows the results of the DEA analysis and the relative technical efficiencies of Indian commercial banks for the years 2012 to 2016. If the score is less than one it shows that the bank is operating below the efficiency frontier curve. In simple words, a bank, either public or private, having a relative technical efficiency score of less than one still has scope for improvement based on the current inputs and outputs. This means that the bank is not working at the optimum utilization of its resources.
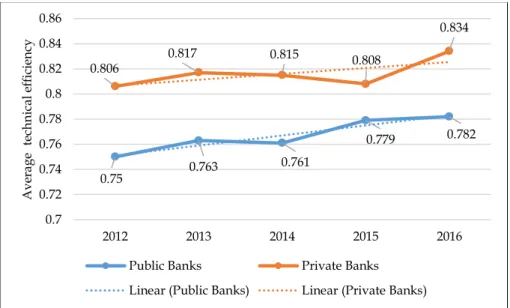
Figure 1. Comparison of the average technical efficiency of public sector banks and private sector banks
For example, if we look at the performance of ‘Allahabad Bank’ for all five years the average technical efficiency score is less than one, which means that the bank is relatively inefficient compared to its rival banks in the same category of the public sector like the UCO Bank and Andhra Bank. From the above table, it can be seen that the ICICI Bank has been the best and most consistent performer throughout the sample period among all the banks. This result is well supported by the bank ranking given by the RBI annual growth report, 28 June 2016, in which ICICI Bank secured the second position among all the banks. The next best bank regarding relative technical efficiency is Kotak Mahindra Bank followed by Jammu & Kashmir Bank. Based on all the results for the five years, the top three banks are ICICI Bank, Kotak Mahindra Bank, and the
0.75 0.763 0.761
0.779 0.782
0.806 0.817 0.815 0.808
0.834
0.7 0.72 0.74 0.76 0.78 0.8 0.82 0.84 0.86
2012 2013 2014 2015 2016
A
ve
rage
te
ch
ni
cal
ef
ficie
ncy
Jammu & Kashmir Bank. From the list of public sector banks, the top three banks giving better results are the State Bank of India, Punjab National Bank, and the UCO Bank.
Figure 1 shows a comparison of the average technical efficiency of the Indian public and private sector banks from 2012 to 2016. The efficiency of the private banks as one group is higher than the public sector banks for all the years, however, this private bank group contains both old and new private sector banks. The performance of the old and new private sector banks as a group can be seen in the section ‘efficiency difference and the bank groups’. There is an increasing linear trend in the technical efficiency of both private and public-sector banks in India.
4.1. Classification of Inefficient Banks
To further investigate the position of the inefficient banks, all the banks are classified into the four categories by the quartile values for the technical efficiency (TE) scores obtained from DEA. As clearly mentioned in Table 3 in the appendix, all the banks are categorized into four categories on the basis of their TE scores. All the banks with a relative efficiency score of less than the first quartile are put in the ‘most inefficient’ banks category. Similarly, the ‘below average’ category corresponds to those banks with a relative efficiency score of between the first and second quartile, and the ‘above average’ category includes those banks with a relative efficiency score of between the second and third quartiles. ‘Marginally inefficient’ banks are those banks that have efficiency scores above the third quartile and very close to 1.
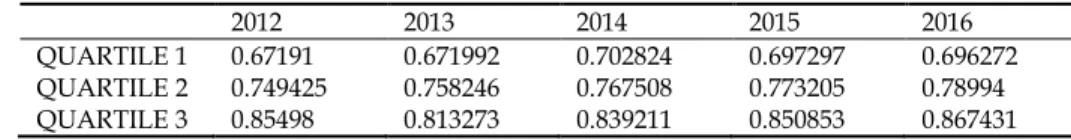
Table 4 displays all the quartile scores (QS) for all the years. By QS, the HDFC Bank falls into the category of marginally inefficient for all the years from 2012-2015, but, in 2016, it is in the category of an efficient bank. The marginally inefficient category is dominated by the private sector banks, as, from the public sector banks, only the Punjab National Bank managed to be a consistent member in this category.
Table 4: Quartile Score
2012 2013 2014 2015 2016
QUARTILE 1 0.67191 0.671992 0.702824 0.697297 0.696272 QUARTILE 2 0.749425 0.758246 0.767508 0.773205 0.78994 QUARTILE 3 0.85498 0.813273 0.839211 0.850853 0.867431 Source: Author’s Self-Estimation
Among the public sector banks, the UCO Bank was consistently relatively efficient from 2013 onwards. Public sector banks like the Punjab & Sind Bank, Central Bank of India, Vijaya Bank, and the Indian Overseas Bank are on the tail, showing a very low relative efficiency every year, and, therefore, the worst performers regarding efficiency. The Indian government must take note, and serious effort is needed to improve the efficiency of these banks. Similarly, among the old private sector banks, Dhanlaxmi Bank Ltd, the Catholic Syrian Bank Ltd., and the Lakshmi Vilas Bank Ltd. were found to be the most inefficient banks in all the sample years. One of the important findings is that only the Development Credit Bank Ltd. from the new private sector banks was found to be in the list of most inefficient banks. All the banks consistently falling among the most inefficient banks are suitable target banks for a prospective consolidation drive in the Indian banking industry.
4.2. Efficiency Difference and Bank Groups
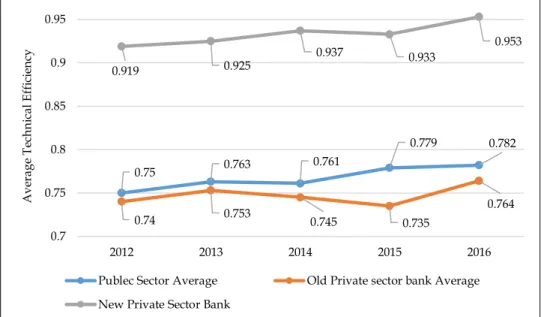
Figure 2 displays the average technical efficiency scores of three different Indian bank groups; public sector banks, old private sector banks, and new private sector banks from 2012-2016.
Figure 2. Average Technical Efficiency of Public Sector Banks, Old Private Sector Banks and New Private Sector Banks. Public in figure above
It is evident that public sector banks are performing better than old private sector banks but inferior to the new private sector banks. The
0.75 0.763 0.761
0.779 0.782
0.74 0.753 0.745 0.735
0.764
0.919 0.925
0.937 0.933 0.953
0.7 0.75 0.8 0.85 0.9 0.95
2012 2013 2014 2015 2016
A
ve
rag
e T
ec
hn
ic
al
E
ff
ic
ie
nc
y
average efficiency of the new private sector banks is much higher than the other two groups. As the sample consists of three bank groups, one-way ANOVA is applied to check the statistical difference between the average efficiency of the three bank groups.
Null Hypothesis: There is no significant difference between the average efficiency of public and old private sector banks and new private sector banks from 2012-2016.
Table 5: ANOVA Efficiency Scores
Sum of Squares df Mean Square F Sig.
Between Groups .102 2 .051 344.523 .000
Within Groups .002 12 .000
Total .104 14
Table 5 reveals that the null hypothesis is rejected at 1 per cent, as the p-value is 0.000 and a significant difference exists between the efficiency of the three bank groups. Public sector banks, old private sector banks, and new private sector banks are statistically different in terms of technical efficiency
4.3. Determinants of Technical Efficiency
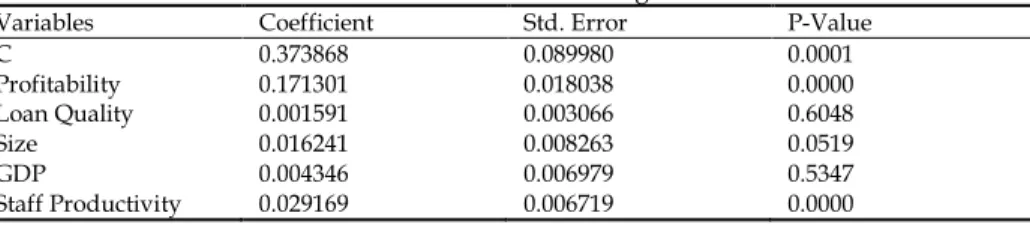
Table 6 reports the results of the pooled regression model, the average efficiency score of all the commercial banks obtained from the DEA is used as a dependent variable, and the four bank internal variables and one macroeconomic variable are used as a predictor variable. The regression model is significant at 1 per cent with an R-square value of 0.578.
Table 6. Estimation Results: Pooled Regression Model Variables Coefficient Std. Error P-Value
C 0.373868 0.089980 0.0001
Profitability 0.171301 0.018038 0.0000
Loan Quality 0.001591 0.003066 0.6048
Size 0.016241 0.008263 0.0519
GDP 0.004346 0.006979 0.5347
Staff Productivity 0.029169 0.006719 0.0000 Source: Author’s Self-Estimation
increase in the efficiency of the banks. This can be explained in that banks that have high profitability do not entertain customers with low credit scores, which helps enhance the efficiency level of the banks. The current finding is well supported by the previous studies of Isik and Hassan (2002) and Hasan and Marton (2003). Another variable ‘business per employee’, a proxy for staff productivity, has a positive coefficient of 0.0292 and is statistically significant at 1 per cent. Both profitability and staff productivity have a positive sign in agreement with a priori expectation.
The variable LNTA, a proxy for bank size, is positive but statistically insignificant at 5 per cent, which means that the size of the bank is immaterial in respect of efficiency. This means that smaller banks can have higher efficiency than larger banks; this has been proven as the YES Bank and Jammu & Kashmir Bank are smaller banks but are more efficient than the State Bank of India and the Punjab National Bank.
The growth rate in real GDP shows a positive coefficient and is statistically insignificant at 5 per cent, which means that changes in the economic activity of India have no impact on the efficiency of Indian commercial banks. Conceptually, the growth in GDP means an increase in the production activities, which further means an increase in financing activities. Although any increase or decrease in financing activities must affect the banking operations, it may not affect its technical efficiency.
5. Conclusion
The most dominant show of efficiency is displayed by the new private sector bank ‘ICICI Bank’. As, in all the years, the ICICI Bank is the only bank that falls in the category of an efficient bank. The other new private sector banks also perform much better than their counterparts in the public banks, which is consistent with the results of Chakrabarti and Chawla (2005). Kotak Mahindra Bank and HDFC Bank are way ahead of many public-sector banks. Among the public sector banks, only UCO, SBI, and the Punjab National Bank are seen as competing regarding efficiency. Among the old private sector bank category, Jammu & Kashmir Bank and Nainital Bank are the leading banks. The average efficiency score of Indian commercial banks is found to have improved from 0.78 in 2012 to 0.81 in 2016.
The results of pooled regression analysis indicate that staff productivity and profitability contribute to the technical efficiency of the Indian banks. Size is not a significant factor for bank efficiency, which means that small banks can have a higher efficiency than big banks; this is similar to the findings of Gupta et al. (2008), and Singh and Bashir (2015). This has been proven in this study as small banks like Jammu & Kashmir Bank, Nainital Bank, and Kotak Mahindra Bank show much better efficiency than their big public-sector counterparts. The size efficiency of a few Indian banks shows that the actual output was lower than what could have been produced by a number of smaller banks collectively using the total input bundle (Ray 2007). In this study, Ray (2007) also suggested that the State Bank of India is too large and should be broken up into more than 25 smaller banks. An increase in the size of banks is a source of additional costs, which tends to reduce the efficiency of the large banks (Alrafadi et al., 2015).
These results suggest that the more profitable banks are more efficient. In other words, profitable banks use their assets and resources efficiently, which is why they will earn more profit. This result is consistent with the previous studies of Isik and Hassan (2002), Casu and Molyneux (2003), Hasan and Marton (2003), and Alrafadi (2015).
policymaking, in general, for all the banks. RBI needs to closely monitor the working and performance of public sector banks like the Punjab & Sind bank, Central Bank of India, Vijaya Bank, and the Indian Overseas Bank, as, consistently, these banks are in the category of most inefficient bank. The Indian government can think about merging these inefficient banks in order to make them more competitive. Old private sector banks like Dhanlaxmi Bank Ltd, the Catholic Syrian Bank Ltd., and the Lakshmi Vilas Bank Ltd. can be easy prey for acquisition by the strong new private sector banks like ICICI Bank, HDFC Bank, and Kotak Mahindra Bank.
There is always scope for future research in this area as relative efficiency changes over time, which means this topic is always relevant. Future work could extend our research by working on efficiency and the degree of competition among Indian banks. There is also scope for research on the impact of service quality dimensions on the technical efficiency of banks in India.
References
Alrafadi, K. M., Kamaruddin, B. H., & Yusuf, M. M. (2015). The Total Factor Productivity of Libyan Banks, 2004–2010. International Journal of Business, Economics and Management, 2(4), 100-119.
Baidya, M. K., & Mitra, D. (2012). An analysis of the technical efficiency of Indian public sector banks through DEA approach. International Journal of Business Performance Management, 13(3-4), 341.
Batir, T. E., Volkman, D. A., & Gungor, B. (2017). Determinants of bank efficiency in Turkey: Participation banks versus conventional banks. Borsa Istanbul Review, 17(2), 86-96.
Benston, G. J. (1965). Branch banking and economies of scale. The Journal of Finance, 20(2), 312-331.
Berger, A. N., & Humphrey, D. B. (1997). Efficiency of financial institutions: International survey and directions for future research. European journal of operational research, 98(2), 175-212.
Bhattacharyya, A, Lovell, C, A, & Sahay, P. (1997). The Impact of Liberalization on the productive efficiency of Indian Banks. European Journal of Operational Research, 98(2), 332-345.
Bonin, J.P., Hasan, I. & Wachtel, P. (2005). Bank performance, efficiency and ownership in transition countries, Journal of Banking & Finance, 29(4), 31-53
Casu, B. & Girardone, C. (2010). Integration and efficiency convergence in EU banking markets. Omega, 38(2), 260-267
Casu, B. & Molyneux, P. (2003). A comparative study of efficiency in European banking. Applied Economics,35, 1865-1876.
Chakrabarti, R. & Chawla, G. (2005). Banking efficiency in India since the reforms: an assessment’. Money and Finance, 9(2), 31-47
Charnes, A., Cooper, W. W., & Rhodes, E. (1978). Measuring the efficiency of decision making units. European Journal of Operational Research, 2(6), 429-444.
Chatterjee, B. & Sinha, R. P. (2006). Cost Efficiency and Commercial Bank Lending: Some Empirical Results. The Indian Economic Journal, 54(1), 145-165.
Das, A. (2000). Efficiency of Public sector banks: An application of data envelopment analysis model. Prajanan: Journal of Social and Management Sciences, 28(2), 119-131.
Das, A. (1997). Technical, Allocative and Scale Efficiency of Public Sector Banks in India. Reserve Bank of India Occasional Papers, Special Issue, 18(5), 279-301.
Das, A., & Ghosh, S. (2006). Financial deregulation and efficiency: An empirical analysis of Indian banks during the post reform period. Review of Financial Economics, 15(3), 193-221.
Farrell, M. J. (1957). The Measurement of Productive Efficiency. Journal of the Royal Statistical Society, Series A, 120(3), 253-290.
Fiordelisi, F., & Molyneux, P. (2010). The determinants of shareholder value in European banking. Journal of Banking and Finance, 34(4), 1189-1200.
Wozniewska, G. (2008). Methods of measuring the efficiency of commercial banks: an example of Polish banks. Ekonomika, 85, 81-91. Gupta, O. K., Doshit, Y., & Chinubhai, A. (2008). Dynamics of productive
efficiency of Indian banks. International Journal of Operations Research, 5(2), 78-90.
Hasan, I. & K. Marton. (2003). Development and efficiency of the banking sector in a transitional economy: Hungarian experience. Journal of Banking and Finance,27, 2249-2271.
Isik, I. & Darrat, A.F. (2009). The effect of macroeconomic environment on productive performance in Turkish banking, Working Paper No. 487, Economic Research Forum, May
Jagwani, B. (2012). Efficiency measurement in the Indian banking industry: An application of data envelopment analysis. Vision, 16(4), 315-331.
Kumar S. & Gulati, R. (2008). An Examination of Technical, Pure Technical, and Scale Efficiencies in Indian Public Sector Banks using Data Envelopment Analysis. Eurasian Journal of Business and Economics, 1(2), 33-69.
Mancebon, M. & Bandres, E. (1999). Efficiency evaluation in secondary schools: the key role of model specification and ex post analysis of results, Education Economics, 7(2), 131-52.
Neal, P. (2004). X-efficiency and productivity change in Australian banking. Australian Economic Papers, 43, 174 – 191.
Rakesh Arrawatia & Arun Mishra. (2015). Assessment of completion of Indian Banking. European Journal of Business and Management, 4(20), 112-123.
Rangarajan, C., & Mampilly, P. (1972). Economies of scale in Indian banking, in: Technical Studies for Banking Commission Report, Reserve Bank of India, Mumbai, 244-268.
Ray, S. (2007). Are Some Indian Banks too Large? An Examination of Size Efficiency in Indian Banking. Journal of Productivity Analysis, 27(1), 41-56.
Reserve Bank of India (1977). Report of the Productivity, Efficiency and Profitability Committee on Banking, (Luther Committee).
Roy, D. (2014). Analysis of technical efficiency of Indian banking sector: An application of data envelopment analysis. International Journal of Finance and Banking Studies, 3(1), 150.
Saha. A, & T. S. Ravishankar. (2000). Rating of Indian Commercial banks: A DEA approach. European Journal of Operations Research, 124(12), 187-203
Sathye, M. (2001). X-Efficiency in Australian Banking: An Empirical Investigation. Journal of Banking and Finance, 25(3), 613-630.
Sathye, M. (2003). Efficiency of banks in a developing economy: the case of India. European Journal of Operational Research, 148(3), 662-671 Sealey, C. W., & Lindley, J. T. (1977). Inputs, outputs, and a theory of
production and cost at depository financial institutions. The Journal of Finance, 32(4), 1251-1266.
Singh, D., & Fida, B. A. (2015). Technical efficiency and its determinants: An empirical study on banking sector of Oman. Problems and Perspectives in Management, 13(1), 168-175.
Singh, P. K., & Thaker, K. (2016). Dynamics of scale efficiency of Indian banks: A deterministic frontier approach. The Journal of Developing Areas, 50(3), 437-457.
Subrahmanyam, G. (1993). Productivity growth in India’s public sector banks: 1979- 89, Journal of Quantitative Economics, 9(3), 209-223. Sufian, F. & Majid, M.A. (2007). Singapore Banking Efficiency and its
Relation to Stock Returns: A DEA Window Analysis Approach. International Journal of Business Studies,15(1), 83-106.
Tyagarajan, M. (1975). Expansion of commercial banking: An assessment. Economic and Political Weekly,10, 1819-1824
Wozniewska, G. (2008). Methods of measuring the efficiency of commercial banks: an example of Polish banks. Ekonomika, 85, 81-91. Yüksel, S., Mukhtarov, S., & Mammadov, E. (2016). Comparing the
Efficiency of Turkish and Azerbaijani Banks: An Application with Data Envelopment Analysis. International Journal of Economics and Financial Issues, 6(3), 1059-1067.
Appendix
Table 2. Average Efficiency of Commercial Banks in India (2012-2016)
Banks Name 2012 2013 2014 2015 2016
Allahabad Bank 0.77142 0.713084 0.7754 0.878859 0.895005 Andhra Bank 0.84416 0.796902 0.771985 0.860968 1 Bank of Baroda 0.78453 0.78895 0.814664 0.821018 0.800648 Bank of India 0.76537 0.787595 0.805819 0.71023 0.699012 Bank of
Maharashtra 0.72425 0.788399 0.720583 0.814523 0.846214 Canara Bank 0.71985 0.68905 0.767508 0.701808 0.746375 Central Bank of
India 0.60383 0.627536 0.636478 0.69665 0.641253 Corporation
Bank 0.92444 0.879665 0.821809 0.77489 0.828387 Dena Bank 0.71339 0.760253 0.733005 0.67113 0.612964 Indian Bank 0.85304 0.77476 0.732773 0.810286 0.781553 Indian Overseas
Bank 0.66011 0.681241 0.735674 0.667996 0.615877 Oriental Bank of
Commerce 0.71389 0.731372 0.860219 0.859482 0.86033 Punjab & Sind
Bank 0.55223 0.620375 0.571777 0.631163 0.864096 Punjab National
Banks Name 2012 2013 2014 2015 2016 State Bank of
India 1 1 0.768307 0.808316 0.78994
Syndicate Bank 0.75478 0.758246 0.744561 0.757492 0.654352
UCO Bank 0.74407 0.872747 1 1 0.944936
Union Bank of
India 0.72676 0.738272 0.708085 0.738348 0.755729 United Bank of
India 0.70273 0.78691 0.808171 0.911406 0.693531 Vijaya Bank 0.62124 0.571293 0.577826 0.605889 0.731032 Average of
Efficiency all the years
0.74997 0.762816 0.76062 0.778647 0.7816
Banks Name 2012 2013 2014 2015 2016
Axis Bank Ltd. 0.94788 1 0.935674 0.911916 0.987008 City Union Bank
Ltd. 0.83703 0.813273 0.849461 0.864483 0.999002 Development
Credit Bank Ltd. 0.64476 0.649901 0.697562 0.77152 0.821964 Dhanlaxmi Bank
Ltd 0.43117 0.494552 0.465592 0.481615 0.531428 HDFC Bank Ltd. 0.95495 0.945022 0.956189 0.960068 1
ICICI Bank Ltd. 1 1 1 1 1
Indusind Bank
Ltd. 0.88412 0.883072 0.994583 1 0.974997 Kotak Mahindra
Bank Ltd. 1 1 1 1 0.985665
Nainital Bank
Ltd. 0.90175 0.910523 0.848236 0.801556 0.829665 RBL Bank 0.76709 0.671992 0.716172 0.69379 0.667406 Tamilnad
Mercantile Bank Ltd.
0.8608 1 0.910234 0.845932 0.930796
The Catholic
Syrian Bank Ltd. 0.57341 0.57195 0.55395 0.487582 0.447275 The Federal Bank
Ltd. 0.90075 0.818294 0.830186 0.80422 0.773116 The Jammu &
Kashmir Bank Ltd.
0.89859 0.975182 1 1 1
The Karnataka
Bank Ltd. 0.67356 0.663625 0.655422 0.699236 0.741958 The Karur Vysya
Bank Ltd. 0.74261 0.73867 0.689254 0.744007 0.827045 The Lakshmi
Vilas Bank Ltd. 0.62157 0.637794 0.665354 0.665005 0.679643 The South Indian
Bank Ltd.
0.66696 0.742003 0.751989 0.737933 0.745864
YES Bank 0.99764 1 0.972602 0.885299 0.902848 Average 0.805507 0.816624 0.81539263 0.808114 0.833983
Table 3. Distribution of Inefficient Banks
Year Most Inefficient Below Average Above Average Marginally
Inefficient
2012 Dhanlaxmi Bank Ltd
Punjab & Sind Bank The Catholic Syrian Bank Ltd.
Central Bank of India Vijaya Bank The Lakshmi Vilas Bank Ltd. Development Credit Bank Ltd. Indian Overseas Bank
The South Indian Bank Ltd.
The Karnataka Bank Ltd.
United Bank of India Dena Bank Oriental Bank of Commerce Canara Bank Bank of Maharashtra Union Bank of India The Karur Vysya Bank Ltd. UCO Bank
Syndicate Bank Bank of India RBL Bank Allahabad Bank Bank of Baroda Punjab National Bank
City Union Bank Ltd. Andhra Bank Indian Bank
Tamilnadu
Mercantile Bank Ltd. Indusind Bank Ltd. The Jammu & Kashmir Bank Ltd. The Federal Bank Ltd.
Nainital Bank Ltd. Corporation Bank Axis Bank Ltd. HDFC Bank Ltd. YES Bank
2013 Dhanlaxmi Bank Ltd
Vijaya Bank The Catholic Syrian Bank Ltd.
Punjab & Sind Bank Central Bank of India The Lakshmi Vilas Bank Ltd. Development Credit Bank Ltd.
The Karnataka Bank Ltd. RBL Bank Indian Overseas Bank Canara Bank Allahabad Bank Oriental Bank of Commerce Union Bank of India The Karur Vysya Bank Ltd. The South Indian Bank Ltd. Syndicate Bank
Dena Bank Indian Bank United Bank of India Bank of India Bank of Maharashtra Bank of Baroda Andhra Bank City Union Bank Ltd.
The Federal Bank Ltd.
UCO Bank Corporation Bank Indusind Bank Ltd. Punjab National Bank
Nainital Bank Ltd. HDFC Bank Ltd. The Jammu & Kashmir Bank Ltd.
2014 Dhanlaxmi Bank Ltd
The Catholic Syrian Bank Ltd.
Punjab & Sind Bank Vijaya Bank Central Bank of India The Karnataka Bank Ltd.
The Lakshmi Vilas Bank Ltd. The Karur Vysya Bank Ltd. Development Credit Bank Ltd.
Union Bank of India RBL Bank Bank of Maharashtra Indian Bank Dena Bank Indian Overseas Bank
Syndicate Bank The South Indian Bank Ltd. Canara Bank
State Bank of India Andhra Bank Allahabad Bank Bank of India United Bank of India Bank of Baroda Corporation Bank
The Federal Bank Ltd.
Nainital Bank Ltd. City Union Bank Ltd. Punjab National Bank
Oriental Bank of Commerce Tamilnad Mercantile Bank Ltd.
Axis Bank Ltd. HDFC Bank Ltd. YES Bank Indusind Bank Ltd.
2015 Dhanlaxmi Bank Ltd
The Catholic Syrian Bank Ltd. Vijaya Bank Punjab & Sind Bank The Lakshmi Vilas Bank Ltd. Indian Overseas Bank
Dena Bank RBL Bank
Central Bank of India
The Karnataka Bank Ltd.
Canara Bank Bank of India The South Indian Bank Ltd.
Union Bank of India The Karur Vysya Bank Ltd. Syndicate Bank Development Credit Bank Ltd.
Corporation Bank Nainital Bank Ltd. The Federal Bank Ltd.
State Bank of India Indian Bank Bank of Maharashtra Bank of Baroda Tamilnad Mercantile Bank Ltd.
Punjab National Bank
Oriental Bank of Commerce Andhra Bank City Union Bank Ltd. Allahabad Bank YES Bank
Year Most Inefficient Below Average Above Average Marginally Inefficient
2016 The Catholic Syrian
Bank Ltd.
Dhanlaxmi Bank Ltd Dena Bank Indian Overseas Bank
Central Bank of India Syndicate Bank RBL Bank The Lakshmi Vilas Bank Ltd.
United Bank of India
Bank of India Vijaya Bank The Karnataka Bank Ltd.
The South Indian Bank Ltd. Canara Bank Union Bank of India The Federal Bank Ltd.
Indian Bank State Bank of India
Bank of Baroda Development Credit Bank Ltd. The Karur Vysya Bank Ltd. Corporation Bank Nainital Bank Ltd. Bank of Maharashtra Oriental Bank of Commerce Punjab & Sind Bank
Punjab National Bank
Allahabad Bank YES Bank Tamilnad Mercantile Bank Ltd.