R E S E A R C H
Open Access
Exposure to ambient particulate matter
alters the microbial composition and
induces immune changes in rat lung
Naijian Li
1, Fang He
2, Baoling Liao
1, Yuming Zhou
1, Bing Li
3and Pixin Ran
1*Abstract
Background:Ambient particulate matter exposure has been shown to increase the risks of respiratory diseases. However, the role of the lung microbiome and the immune response to inhaled particulate matter are largely unexplored. We studied the influence of biomass fuel and motor vehicle exhaust particles on the lung microbiome and pulmonary immunologic homeostasis in rats.
Methods:Fifty-seven Sprague–Dawley rats were randomly divided into clean air (CON), biomass fuel (BMF), and motor vehicle exhaust (MVE) groups. After a 4-week exposure, the microbial composition of the lung was assessed by 16S rRNA pyrosequencing, the structure of the lung tissue was assessed with histological analysis, the
phagocytic response of alveolar macrophages to bacteria was determined by flow cytometry, and immunoglobulin concentrations were measured with commercial ELISA kits.
Results:There was no significant difference in lung morphology between the groups. However, the BMF and MVE
groups displayed greater bacterial abundance and diversity.Proteobacteriawere present in higher proportions in the MVE group, and 12 bacterial families differed in their relative abundances between the three groups. In addition, particulate matter exposure significantly increased the capacity of alveolar macrophages to phagocytose bacteria and induced changes in immunoglobulin levels.
Conclusion:We demonstrated that particulate matter exposure can alter the microbial composition and change
the pulmonary immunologic homeostasis in the rat lung.
Keywords:Particulate matter, Biomass fuel, Motor vehicle exhaust, Microbial composition, Immune response
Background
Particulate matter (PM) refers to an air-suspended mix-ture of pollutants, which contains a complex mixmix-ture of smoke, dust, and other solid and liquid materials, as well as numerous biological components. Inhaled ambient PM represents important environmental exposures that have been linked to death and disease [1, 2]. Emerging epidemiological evidence also suggests that these expo-sures increase the risks of respiratory diseases [3–6]. Research on PM has mostly focused on the lung inflam-matory response to inhalation, as this is considered the primary impact of PM exposure [7–10]. Recent studies
have linked changes in the lung microbiome to human disease, but the effects of PM on the lung microbiome are largely unknown [11, 12].
Research using culture-independent, sequence-based techniques such as 16S ribosomal RNA microarrays has shown that the lungs are not sterile [13, 14]. There is a growing understanding that the lung microbiome plays a critical role in health and disease [11]. In addition, the lung microbiome community structure may not only reflect the presence of disease but also be associated with disease features and severity [15], adding to the com-plexity of characterizing polymicrobial-host interactions in the lung and their potential mechanistic relationship to chronic respiratory diseases. Previous studies have found that airborne PM exposure alters the gut microbiome and induces acute and chronic inflammatory responses in the * Correspondence:[email protected]
1State Key Laboratory of Respiratory Disease, The First Affiliated Hospital of Guangzhou Medical University, 151 Yanjiang Road, Guangzhou 510120, China
Full list of author information is available at the end of the article
intestine [16, 17]. In spite of the increasing attention paid to the gut microbiome in PM exposures, few studies have attempted to elucidate the role of the lung microbiome in response to inhaled PM. In this study, we hypothesized that exposure to ambient PM may alter the microbial composition and induce immune changes in the lung.
Methods Animals
Male Sprague–Dawley rats (7–9 weeks in age) were ob-tained from Guangzhou University of Chinese Medicine (Guangzhou, China). The experimental protocol and animal care complied with the guiding principles for the care and use of laboratory animals recommended by the Chinese Association for Laboratory Animal Science Policy. A total of 57 rats were randomly divided into three groups (control, biomass fuel [BMF], and motor vehicle exhaust [MVE]; n = 19 per group). All rats were kept in a specific pathogen-free room and were housed two to a cage. The animal facility maintained temperature control and a 12-h light/dark cycle. Rats were given standardized food and water ad libitum, and were allowed to adjust to their environment for at least 7 days before the experiments.
PM exposure system
Rats were exposed to PM as described previously [10]. The control group was exposed to clean air every day for 4 weeks. PM mass concentrations and particle size distributions were monitored in real time during the exposure by a DustTrak II aerosol monitor 8530 (TSI, Shoreview, MN, USA). At the same time, gas concentra-tions (O2, carbon monoxide [CO], nitrogen oxides
[NOX], and sulfur dioxide [SO2]) in the exposure rooms
were monitored by a Testo 340 portable flue gas analyzer (Testo, Lenzkirch, Germany).
Exposure to BMF: The rats in the BMF group were ex-posed to smoke produced by smoldering China fir sawdust (30 g/exposure) for four 1-h periods, 5 days per week, for 4 weeks. The BMF was generated by a burn stove (500 w) for 10 min and the smoke was sent into the animal exposure room through a piston pump (5 L/min).
Exposure to MVE: A Wuyang model WY48QT-2, 1.6-Kw, 125-cm3, one-cylinder, four-cycle, gasoline-powered motorcycle (Guangzhou, China) was used as the MVE source. The motorcycle was operated using premium low-sulfur gasoline (<150 ppm; Petro Inc., El Paso, TX, USA) and 5 W-50 motor oil (ExxonMobil, Irving, TX, USA). The motorcycle engine was operated in an idle state for 2 min and then stopped for 10 min to achieve a stable mass con-centration. The rats in the MVE group were exposed to PM for two 2-h exposure periods, 5 days per week, for 4 weeks.
Sample preparation and isolation of alveolar macrophages (AMs)
Rats were sacrificed after the 4-week exposure period (day 29) using pentobarbitone (Sigma-Aldrich, St. Louis, MO, USA) administered by intra-peritoneal injection according to body weight (90 mg/kg). The lungs were cyclically inflated and deflated with 6 mL of phosphate-buffered saline (PBS) (Gibco-Thermo Fisher Scientific, Waltham, MA, USA). This was repeated for a total lavage fluid volume of 18 mL. For microbiome analysis, bronchoalveolar lavage fluid (BALF) was centrifuged at 15,000 g for 30 min at 4 °C. The supernatants were discarded and the pellets were snap-frozen in liquid nitrogen and stored at−80 °C. The remainder BALF was processed as described below.
BALF was centrifuged at 200 g for 5 min at 4 °C to obtain the cells and supernatants. The supernatant was frozen at −80 °C for biochemical analyses, and the cell pellet was rinsed and suspended in RPMI-1640 complete medium (Gibco-Thermo Fisher Scientific) with 10% fetal bovine serum (FBS) (Gibco-Thermo Fisher Scientific) and 1% penicillin/streptomycin (Gibco-Thermo Fisher Scientific). AMs were plated and incubated for 2 h at 37 °C in a humidified atmosphere of 5% CO2. Nonadherent cells
were removed by gentle rinsing with complete medium.
Differential BALF count
For Diff-Quik cell staining (Baso Diagnostics, Inc., Zhuhai, China), a portion of each sample was diluted to 2 × 10⁴cells per 100μL and fixed by cytospin (Shandon Inc., Pittsburgh, PA, USA). Differential cell counts were assessed based on 400 cells counted from each slide.
Phagocytosis assay and confocal microscopy
Phagocytosis was measured as described previously [18, 19]. Staphylococcus aureus 1.2386 and Streptococcus
pneumo-niae 1.8722 were obtained from the China General
Microbiological Culture Collection Center (Beijing, China) and fluorescently labeled using Alexa Fluor 488 dye (Thermo Fisher Scientific). Fluorescently-labelled polystyrene beads (2-μM diameter) were obtained from Thermo Fisher Scientific.
For the in vitro assay, AMs were plated onto 24-well plates (5 × 10⁴cells/well; Corning, Corning, NY, USA) and incubated with S. aureus and S. pneumoniae at a ratio of 100 bacteria per cell for 2 h (fluorescent beads at a ratio of 50 beads per cell for 4 h) at 37 °C in a humidified atmosphere of 5% CO2. After incubation,
Accuri® C6 flow cytometer (Becton Dickinson, Franklin Lakes, NJ, USA). Data were expressed as median fluorescence intensity (MFI).
Confocal microscopy was used to ascertain whether the beads were internalized as described previously [20]. Cells were viewed on a confocal microscope with a krypton-argon laser fluorescence detector (Zeiss LSM880, Oberkochen, Germany).
Immunoglobulin assays
Immunoglobulin concentrations were measured in col-lected supernatants using commercial ELISA kits (Abcam, Cambridge, UK). Proteins measured included total IgA, IgG, and IgM. Briefly, each kit was a solid-phase sandwich ELISA utilizing monoclonal antibodies specific for the target protein. All procedures were performed according to the manufacturer’s instructions. Immunoglobulin con-centrations were expressed asμg/mL of supernatant.
16S rRNA gene sequence analysis
Illumina sequencing was performed on amplicons from cDNA extracted from BALF samples of six BMF-exposed, six MVE-BMF-exposed, and six air-exposed rats. The total DNA from a 200-μL aliquot of the supernatant was extracted with the Qiagen DNA extraction kit (Qiagen, Hilden, Germany) according to the manufacturer’s recommendations. The V3–V4 regions of the 16S rRNA gene were amplified and sequenced on an Illumina MiSeq instrument (San Diego, CA, USA) using the 300 paired-end protocol at the Ribobo Genome Center (Guangzhou, China) as described previously [21].
Sequence reads were processed to remove low-quality reads. Unique reads were pre-clustered by Mothur soft-ware scripts [22]. Unique reads from each sample were clustered into a group of similar sequences, each represen-tative of a 16 s rRNA sequence from a bacterial genus or species, and termed operational taxonomic units (OTUs). Next, OTU numbers were calculated using Mothur scripts
based on 97% similarity. Unique reads were aligned to the Ribosome Database Project database [23] and annotated. OTUs were then classified to one species if more than 51% contained unique reads annotated to this species. QIIME software scripts (version 1.50) were used to analyze the distribution of all annotated species or OTUs in different taxonomic levels (phylum, class, order, family, genus) among different samples. Community (alpha) di-versity indices combine species richness and abundance into a single value of evenness. As the most widely used indices, taxonomic alpha diversity was measured using OTU, Chao 1 indices, phylogenetic diversity whole tree (PD_whole_tree), and observed_species [24–26].
Lung morphometric analysis
Lung tissues were fixed with 4% paraformaldehyde solu-tion and embedded in paraffin using standard methods as described previously [27]. Sections (5-μm) were stained with hematoxylin and eosin (H&E) to detect cellular infiltration. For each animal, 10 fields were captured at a × 200 magnification in a blinded fashion Fig. 1Particle size distribution during exposures to biomass fuel (BMF) and motor vehicle exhaust (MVE). Concentrations of PM10, PM2.5, and PM1
differed significantly in the BMF exposure room; PM10concentrations were highest. Concentrations did not differ in the MVE exposure room. PM,
particulate matter
Table 1Pollutant concentrations measured during exposures to biomass fuel (BMF) and motor vehicle exhaust (MVE)
CON BMF MVE
PM10 (mg/m3) 0.076 ± 0.007 24.6 ± 7.3 1.40 ± 0.26
PM2.5 (mg/m3) 0.076 ± 0.007 20.7 ± 4.9 1.40 ± 0.26
PM1 (mg/m3) 0.076 ± 0.007 18.4 ± 4.5 1.41 ± 0.26
NO1(ppm) — 0.64 ± 0.067 0.23 ± 0.04
NOX(ppm) — 0.64 ± 0.067 0.23 ± 0.04
SO2(ppm) — — 0.72 ± 0.07
CO (ppm) — 95.6 ± 4.2 73.6 ± 3.7
O2(%) 20.9 ± 0.01 20.83 ± 0.04 20.92 ± 0.03
Humidity (%) 57.4 ± 2.9 59.3 ± 2.3 62.6 ± 5.3
Temperature (°C) 24.3 ± 0.2 25.76 ± 0.31 24.8 ± 0.3
using an image analyzer platform (Leica, Germany). Alveolar enlargement and destruction were quantified by the mean linear intercept (Lm), and the bronchial wall thickness was calculated as wall thickness = (total bron-chial area−lumen area)/total bronchial area.
Statistical analysis
Data are reported as mean ± standard error of the mean (SEM). Statistical analysis was performed in SPSS version 21 (IBM SPSS 21, Armonk, NY, USA) using Stu-dent’st-test for normally distributed populations and the Mann–Whitney U-test for populations where normal
distribution was not accomplished. A p-value of less than 0.05 was considered significant.
Results
Particle size distributions in suspension and gas concentrations in the exposure rooms during air pollution PM exposure
PM mass concentrations and particle size distributions were measured during the PM exposures. The variations in both the BMF exposure room and the MVE exposure room are depicted in Fig. 1. We also measured gas con-centrations inside the chambers, to estimate levels of Fig. 2Percentages of macrophages in bronchoalveolar lavage fluid (BALF). Following particulate matter exposure, the percentage of
macrophages increased in BALF from rats exposed to biomass fuel (BMF). Results are expressed as mean ± SEM;n= 8 rats. CON, control; MVE, motor vehicle exhaust; Mac, macrophages; Neu, neutrophils; Lym, lymphocytes; Eos, eosinophils. *p< 0.05
gaseous co-pollutants generated by combustion. The mean ± SEM concentrations of various particle sizes (PM10, PM2.5, and PM1) and gases (O2, CO, NOx,and
SO2) in the exposure rooms are shown in Table 1.
Phagocytosis by AMs following PM exposure
There were no significant differences in total BALF cell counts between the PM exposure group and control group, but the BALF macrophage counts increased in the BMF group compared with the control group (p= 0.045) (Fig. 2).
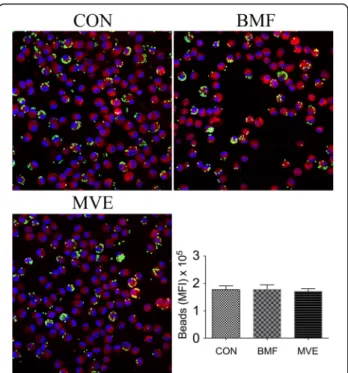
The phagocytic response of AMs to fluorescently labeled bacteria or beads was determined by flow cytometry. AMs from the three groups exhibited dif-ferential capacities to phagocytose bacteria. Increased phagocytosis of S. aureus and S. pneumoniae was ob-served in the MVE exposure group, compared with the control group (p < 0.01). AMs from the BMF-exposed group exhibited an increased capacity to ingest S. aureus (p = 0.012), but did not differ from AMs derived from control rats in their capacity to ingest S. pneumoniae (p = 0.097) (Fig. 3). However, there was no difference in phagocytosis of beads between the three groups (Fig. 4).
PM exposure induces immunoglobulin changes
Concentrations of total IgA, IgG, and IgM were mea-sured using ELISA kits. IgA levels in BALF increased following the 4-week exposure to BMF (p < 0.01) and MVE (p= 0.02) compared with air exposure (Fig. 5a). In contrast, IgG levels decreased significantly in the BMF group compared with controls (p= 0.031). A downward trend that was not statistically significant was seen in the MVE group (Fig. 5b). BALF from all groups contained similar concentrations of IgM (Fig. 5c). Im-munoglobulin concentrations were expressed as μg/mL of the BALF supernatant.
Effects of PM exposure on lung morphology
Figure 6 (a, b) shows that the Lm values in the lungs of rats exposed to BMF and MVE for 4 weeks did not differ from those of rats exposed to clean air. Moreover, the thickness of bronchial walls in the lungs of rats exposed to BMF and MVE particles was similar to that of control rats (Fig. 6c, d), suggesting that the exposures did not induce morphological changes.
Changes in lung bacterial diversity following PM exposure
A total of 1,484,863 raw reads were generated for all samples, with an average of 82,492 total reads per sample. After filtering for low-quality reads, 1,205,883 sequence reads were used for subsequent analyses and resulted in 31,701 OTUs (Table 2). Comparison between the three groups showed that bacterial abundance (OTU number) increased significantly in the BMF group and MVE group compared with the control group (p= 0.021 andp< 0.01, respectively). The mean (SEM) OTU num-bers for the control, BMF, and MVE groups were 1227.8 (78.6), 1651.8 (162.8) and 2403.8 (221.9), respectively (Fig. 7a). The MVE group exhibited higher bacterial diversity than the BMF and control groups; the BMF group exhibited higher bacterial diversity than the control group (Fig. 7b–d).
Lung bacterial composition
To determine the response of the host microbiome to PM, we analyzed the taxonomical community structure of the microbiome in BALF samples of air-exposed, BMF-exposed, and MVE-exposed rats. At the phylum level, all samples from control, BMF, and MVE groups contained four major bacterial phyla (%):Proteobacteria, 75.5 ± 1.5, 67.5 ± 8.1, and 62.6 ± 4.5, respectively; Firmi-cutes, 5.4 ± 0.9, 12.3 ± 5.6, and 11.4 ± 2.1, respectively; Bacteroidetes; 3.3 ± 0.4, 6.1 ± 2.7, and 3.7 ± 0.8, respect-ively;Actinobacteria, 11.7 ± 1.8, 8.3 ± 3.9, and 7.0 ± 1.1 respectively. The first three phyla accounted for over 80% of the total sequences in all three groups (Fig. 8). Fig. 4Confocal microscopy and phagocytosis of fluorescently-labeled
Relative abundances of bacterial phyla differed (p< 0.05) between the control and MVE groups. On the basis of Bonferroni post hoc testing, expansion of the Proteo-bacteriaphylum was the most significant driver of the difference between the control group and the MVE group (75.5 ± 1.5 vs. 62.6 ± 4.5,p= 0.017). There was no significant difference between the control group and BMF group.
At the family level, on the basis of these assignments, the sequences represented in the four phyla were distrib-uted into 67 bacterial families. Twelve bacterial families differed in their relative abundance in samples from the three groups (Fig. 9). Clostridiaceae, Ruminococcaceae, Hyphomonadaceae, and Veillonellaceaewere present in higher proportions in the BMF group than in the control group (Fig. 9a).Clostridiaceae, Brocadiaceae, Hyphomo-nadaceae, Planococcaceae, Hyphomicrobiaceae, and Veillonellaceaewere present in higher proportions in the MVE group, whereas Aerococcaceae, Pseudomonadaceae, Comamonadaceae, Oxalobacteraceae, and Caulobactera-ceaewere present in lower proportions than in the control group (Fig. 9b). A comparison of the BMF and MVE groups showed a higher prevalence of Clostridiaceae,
Hyphomonadaceae, Brocadiaceae, Veillonellaceae, and Mycobacteriaceae in the BMF group, while Pseudomona-daceaewere more prevalent in the MVE group (Fig. 9c).
Discussion
Air pollution is a major environmental issue contrib-uting to chronic respiratory diseases; industry, traffic, and household biomass combustion have become major sources of ambient PM emissions [3]. Moreover, incomplete combustion of biomass fuel and living in proximity to traffic have been associated with a high prevalence of chronic obstructive pulmonary disease (COPD) [28, 29], which is why we elected to focus on BMF and MVE in our study. The PM concentrations of BMF and MVE reported here are in accordance with those in our previous studies, which measured the upper bound of indoor air pollution generated during cooking in rural areas of Southern China [5, 29, 30], and with those measured in Northern China under heavy haze conditions [31]. Exposure to ambient particulate matter for 6 months causes airway cells to release multiple cytokines capable of inducing pronounced COPD in rat models [10]. We therefore selected a short-term exposure to determine Fig. 5Immunoglobulin levels in bronchoalveolar lavage fluid following a 4-week exposure to particulate matter. (a) Levels of IgA.bLevels of IgG. cLevels of IgM. Results are expressed as mean ± SEM;n= 8 rats. CON, control group; BMF, biomass fuel exposure group; MVE, motor vehicle exhaust exposure group. *p< 0.05, **p< 0.01
whether PM alters the lung microbial composition be-fore lung morphometric changes occur. In this study, we demonstrated that a 4-week exposure of rats to airborne PM increased the lung bacterial load and diversity, and altered the microbial composition before
any histopathological changes occurred. Furthermore, PM exposure increased phagocytosis by AMs and induced changes in immunoglobulins.
Microdysbiosis is defined as quantitative and qualitative changes in the microbiota, including an increase in com-mon bacterial inhabitants that can become pathogenic under selective pressures [32]. Previous studies support the hypothesis that inhaled air pollution may impact the microbial composition of the lung [33, 34]. These studies found that exposure to higher levels of particulates re-sulted in higher abundances of potentially pathogenic bacteria within the lung microbiome. We found that samples from the BMF and MVE groups contained higher bacterial abundances and bacterial diversity than samples from the control group, based on the OTU numbers and alpha diversity, supporting the study of Yu and colleagues, who demonstrated that microbiota taxonomic alpha diver-sity increases with environmental exposures, and that spe-cific aspects of the lung microbiota are related to different sources of PM [33]. Rylance and colleagues reported that domestic BMF use was associated with an uncommon environmental bacterium (Petrobacter) usually found in oil reservoirs [34]. We found that the distribution of phyla in the MVE group differed significantly from distribution in the control and BMF groups (Fig. 8), and that this change was driven by increases in Proteobacteria. At the family level, 12 bacterial families differed in their relative abundance in samples from the three groups (Fig. 9), not only between the PM exposure groups and the controls, but also within the exposure groups. Clostridiaceae, Hyphomonadaceae, Brocadiaceae, Veillonellaceae, and Mycobacteriaceaewere more prevalent in the BMF group, Table 2Sequence characteristics of samples from the control,
biomass fuel, and motor vehicle exhaust groups
Sample Raw reads Clean reads Clean rate (%) OTUs
C1 48,881 47,021 95.4 1482
C2 42,486 40,658 94.9 968
C3 51,592 48,734 93.6 1363
C4 61,056 58,690 95.2 1115
C5 84,335 64,554 67.2 1114
C6 64,101 61,549 95.3 1325
B1 99,701 73,766 71.7 2277
B2 96,756 73,463 70.1 1926
B3 106,549 82,315 68.7 1481
B4 101,385 78,044 68.0 1560
B5 103,303 76,117 65.0 1544
B6 82,009 65,377 72.8 1123
M1 83,505 69,310 77.3 1933
M2 69,562 59,557 83.1 3254
M3 110,918 92,134 77.8 2855
M4 67,860 57,459 76.2 1870
M5 102,845 76,430 67.4 2266
M6 108,019 80,705 66.8 2245
C1–C6, control group; B1–B6, biomass fuel exposure group; M1–M6, motor vehicle exhaust exposure group;n= 6 experiments. OUT, operational taxonomic unit
whereasPseudomonadaceae numbers were higher in the MVE group (Fig. 9c).
We also compared the histopathological changes in the lungs of rats exposed to BMF or MVE, but found no significant difference in bronchial wall thickness or alveolar enlargement (Fig. 6). Combined with our previ-ous findings from a 6-month exposure [10], the results indicate that BMF and MVE exposure alters the lung microbiome before lung morphometric changes occur. Moreover, some alterations in bacterial composition were found in the lungs of rats exposed to BMF or MVE, supporting the hypothesis that BMF and MVE exposure can result in various COPD phenotypes [35].
Exposure to ambient PM also affects innate and adap-tive immune responses in the rat lung, and this may be partly explained by disordered microbial communities. AMs are known as the principal cells that process
airborne particles in the lung and act as antigen-presenting cells to activate the adaptive immune response [36]. We found that BALF macrophage counts increased in the BMF group. This is in agreement with previous studies that reported an increase in phagocytic inflamma-tory cell numbers in BALF following exposure to air pollu-tion [37]. Exposure to PM stimulates the bone marrow, promoting the release of monocytes and their recruit-ment into the lung, where they subsequently differen-tiate into tissue and alveolar macrophages [38]. In our study, AMs from the BMF and MVE exposure groups displayed an increased capacity to phagocytose bac-teria. However, the phagocytic response of these macrophages to polystyrene beads was not altered in cells from the BMF and MVE exposure groups, indi-cating that the change was related specifically to these bacteria. This finding is distinct from that of previous studies [39, 40], which reported that PM exposures significantly reduced the uptake of pathogens. How-ever, our results were obtained from in vivo experi-ments, and high-level PM exposures in vitro may not represent biological conditions in an ambient air-polluted environment [41]. Macrophage phagocytic activity increases with increasing PM concentrations, but will be impaired when the phagocytic particles exceed 60% of the intracellular volume, overloading the macrophages [42, 43].
Few data are available on the effects of ambient PM on immune functions in the lung. Some work on PM has centered on alterations in immunoglobulin produc-tion [44]. We found that PM exposure increased total IgA levels in BALF samples from both the BMF and MVE exposure groups (Fig. 5a), similarly to the find-ings of Gaschler and colleagues, who reported that an 8-week exposure to cigarette smoke increased IgA Fig. 8Phylum percent relative abundances. Microbial abundance
was measured in bronchoalveolar lavage fluid from rats exposed to clean air (CON) and to particulate matter from biomass fuel (BMF) and motor vehicle exhaust (MVE). The phylum distribution differed significantly between the three groups, driven by an increase inProteobacteria
Fig. 9Relative abundance of 20 bacterial families. The abundance of major bacterial families was measured in samples comparing
titers in BALF from mice [45]. Interestingly, PM ex-posure in our study decreased total IgG levels in the BMF group and did not significantly alter concentra-tions of IgM in the three groups (Fig. 5b, c). Basilico and colleagues reported that total IgA and IgG levels in mice exposed to cigarette smoke for 6 weeks were similar to or lower than levels in controls [46]. Several experimental factors may explain the discordant find-ings: Different exposures (our study did not include cigarettes), the duration and intensity of the exposure, and the animal species and strain used. In general, our study and the published literature show alterations in the adaptive immune response in rodent lungs following a PM exposure.
In summary, we demonstrated that a short-term PM exposure can alter the microbial composition and affect innate and adaptive immune responses in the rat lung. Furthermore, defining the composition of the resident microbiome and how microbial communities shift with exposure may help to explain their role in responding to inhaled particulate matter.
Conclusion
This study found that a short-term PM exposure can alter the microbial composition and induce immune changes in the rat lung.
Abbreviations
AM:Alveolar macrophages; BALF: Bronchoalveolar lavage fluid; BMF: Biomass fuel; MFI: Median fluorescence intensity; MVE: Motor vehicle exhaust; OTU: Operational taxonomic unit; PM: Particulate matter
Acknowledgements
We thank Dr. Binwei Hao and Jinding Pu for processing the samples of bronchoalveolar lavage fluid. We thank Liwen Bianji, Edanz Group China (www.liwenbianji.cn/ac), for editing the English text of a draft of this manuscript.
Funding
This work was supported by the National Natural Science Foundation of China (grants no. 81470233 and 81,570,035), the National Key Basic Research and Development Program (973 Program 20l5CB553403), a Scientific Research Grant from Guangzhou City (201510010226), the National Natural Science Foundation of Guangdong (S2011020002789), and a grant from the State Key Laboratory of Respiratory Disease (SKLRD2016ZJ013).
Availability of data and materials Please contact author for data requests.
Authors’contributions
Conceived and designed the experiments: PR, BLi, YZ. Experiments: NL, FH, BL. Created the air pollution exposure room: FH. Collected and analyzed the data: NL. Wrote the manuscript: NL, PR. All authors read and approved the final manuscript.
Ethics approval
The care and use of the animals was in compliance with regulations designated by the Chinese Association for Laboratory Animal Science Policy. All of the experimental protocols were approved by the Institutional Animal Care and Use Committee of Guangzhou Medical University (acceptance number 2016–007).
Consent for publication Not applicable.
Competing interests
The authors declare that they have no competing interests.
Publisher’s Note
Springer Nature remains neutral with regard to jurisdictional claims in published maps and institutional affiliations.
Author details
1State Key Laboratory of Respiratory Disease, The First Affiliated Hospital of Guangzhou Medical University, 151 Yanjiang Road, Guangzhou 510120, China.2The School of Basic Medicine, Guangzhou Medical University, Guangzhou, China.3The GMU-GIBH Joint School of Life Sciences, Guangzhou Medical University, Guangzhou, China.
Received: 25 April 2017 Accepted: 19 July 2017
References
1. Li P, Xin J, Wang Y, Li G, Pan X, Wang S, Cheng M, Wen T, Wang G, Liu Z. Association between particulate matter and its chemical constituents of urban air pollution and daily mortality or morbidity in Beijing City. Environ Sci Pollut Res Int. 2015;22(1):358–68.
2. Thurston GD, Ahn J, Cromar KR, Shao Y, Reynolds HR, Jerrett M, Lim CC, Shanley R, Park Y, Hayes RB. Ambient particulate matter air pollution exposure and mortality in the NIH-AARP diet and health cohort. Environ Health Perspect. 2016;124(4):484–90.
3. Guan WJ, Zheng XY, Chung KF, Zhong NS. Impact of air pollution on the burden of chronic respiratory diseases in China: time for urgent action. Lancet. 2016;15;388(10054):1939–1951.
4. Turner MC, Krewski D, Pope CA 3rd, Chen Y, Gapstur SM, Thun MJ. Long-term ambient fine particulate matter air pollution and lung cancer in a large cohort of never-smokers. Am J Respir Crit Care Med. 2011;15;184(12): 1374–1381.
5. Liu S, Zhou Y, Liu S, Chen X, Zou W, Zhao D, Li X, Pu J, Huang L, Chen J, Li B, Liu S, Ran P. Association between exposure to ambient particulate matter and chronic obstructive pulmonary disease: results from a cross-sectional study in China. Thorax. 2016;0:1–8.
6. Fisher JA, Puett RC, Hart JE, Camargo CA Jr, Varraso R, Yanosky JD, Laden F. Particulate matter exposures and adult-onset asthma and COPD in the Nurses' health study. Eur Respir J. 2016;48(3):921–4.
7. Gangamma S. Airborne particulate matter and acute lung inflammation. Environ Health Perspect. 2013;121(1):A11.
8. Jaligama S, Chen Z, Saravia J, Yadav N, Lomnicki SM, Dugas TR, Cormier SA. Exposure to Deepwater horizon crude oil Burnoff particulate matter induces pulmonary inflammation and alters adaptive immune response. Environ Sci Technol.2015;21;49(14):8769–8776.
9. Ramanathan M Jr, London NR Jr, Tharakan A, Surya N, Sussan TE, Rao X, Lin SY, Toskala E, Rajagopalan S, Biswal S. Airborne particulate matter induces non-allergic Eosinophilic Sinonasal inflammation in mice. Am J Respir Cell Mol Biol. 2017;57(1):59-65.
10. He F, Liao B, Pu J, Li C, Zheng M, Huang L, Zhou Y, Zhao D, Li B, Ran P. Exposure to ambient particulate matter induced COPD in a rat model and a description of the underlying mechanism. Sci Rep. 2017;31;7:45666. 11. Huang YJ, Charlson ES, Collman RG, Colombini-Hatch S, Martinez FD, Senior
RM. The role of the lung microbiome in health and disease. Am J Respir Crit Care Med. 2013;15; 187(12): 1382–1387.
12. Adar SD, Huffnagle GB, Curtis JL. The respiratory microbiome: an underappreciated player in the human response to inhaled pollutants? Ann Epidemiol. 2016;26(5):355–9.
13. Hilty M, Burke C, Pedro H, Cardenas P, Bush A, Bossley C, Davies J, Ervine A, Poulter L, Pachter L, Moffatt MF, Cookson WO. Disordered microbial communities in asthmatic airways. PLoS One. 2010;5(1):e8578. 14. Erb-Downward JR, Thompson DL, Han MK, Freeman CM, McCloskey L,
15. Huang YJ, Nariya S, Harris JM, Lynch SV, Choy DF, Arron JR, Boushey H. The airway microbiome in patients with severe asthma: associations with disease features and severity. J Allergy Clin Immunol. 2015;136(4):874–84. 16. Kish L, Hotte N, Kaplan GG, Vincent R, Tso R, Gänzle M, Rioux KP, Thiesen A,
Barkema HW, Wine E, Madsen KL. Environmental particulate matter induces murine intestinal inflammatory responses and alters the gut microbiome. PLoS One. 2013;24;8(4):e62220.
17. Allais L, Kerckhof FM, Verschuere S, Bracke KR, De Smet R, Laukens D, Van den Abbeele P, De Vos M, Boon N, Brusselle GG, Cuvelier CA, Van de Wiele T. Chronic cigarette smoke exposure induces microbial and inflammatory shifts and mucin changes in the murine gut. Environ Microbiol. 2016;18(5):1352–63. 18. Taylor AE, Finney-Hayward TK, Quint JK, Thomas CMR, Tudhope SJ,
Wedzicha JA, Barnes PJ, Donnelly LE. Defective macrophage phagocytosis of bacteria in COPD. Eur Respir J. 2010;35:1039–47.
19. Pitz AM, Perry GA, Jensen-Smith HC, Gentry-Nielsen MJ. A flow cytometric assay to quantify in vivo bacterial uptake by alveolar macrophages. J Microbiol Methods. 2010;81(2):194–6.
20. Liang Z, Zhang Q, Thomas CM, Chana KK, Gibeon D, Barnes PJ, Chung KF, Bhavsar PK, Donnelly LE. Impaired macrophage phagocytosis of bacteria in severe asthma. Respir Res. 2014;27;15:72.
21. Fadrosh DW, Ma B, Gajer P, Sengamalay N, Ott S, Brotman RM, Ravel J. An improved dual-indexing approach for multiplexed 16S rRNA gene sequencing on the Illumina MiSeq platform. Microbiome. 2014;2:6. 22. Patrick Schloss. Mothur software scripts. Department of Microbiology &
immunology, the university of Michigan. 2009. http://www.mothur.org/. Released by Feb 2009.
23. MediaWiki. Ribosome database project database. 2015. http://www.mothur. org/wiki/RDP_reference_files. Released by May 2015.
24. Schloss PD, Westcott SL, Ryabin T, Hall JR, Hartmann M, Hollister EB, Lesniewski RA, Oakley BB, Parks DH, Robinson CJ, Sahl JW, Stres B, Thallinger GG, Van Horn DJ, Weber CF. Introducing mothur: open-source, platform-independent, community-supported software for describing and comparing microbial communities. Appl Environ Microbiol. 2009;75(23):7537–41. 25. Faith DP, Baker AM. Phylogenetic diversity (PD) and biodiversity conservation:
some bioinformatics challenges. Evol Bioinforma. 2006;2:121–8. 26. Faith DP. Phylogenetic pattern and the quantification of organismal
biodiversity. Philos Trans R Soc Lond Ser B Biol Sci. 1994;345(1311):45–58. 27. Han W, Dong Z, Dimitropoulou C, Su Y. Hydrogen sulfide ameliorates
tobacco smoke-induced oxidative stress and emphysema in mice. Antioxid Redox Signal. 2011;15;15(8):2121–2134.
28. Lindgren A, Stroh E, Montnémery P, Nihlén U, Jakobsson K, Axmon A. Traffic-related air pollution associated with prevalence of asthma and COPD/chronic bronchitis. A cross-sectional study in southern Sweden. Int J Health Geogr. 2009;20;8:2.
29. Liu S, Zhou Y, Wang X, Wang D, Lu J, Zheng J, Zhong N, Ran P. Biomass fuels are the probable risk factor for chronic obstructive pulmonary disease in rural South China. Thorax. 2007;62:889–97.
30. Zhou Y, Zou Y, Li X, Chen S, Zhao Z, He F, Zou W, Luo Q, Li W, Pan Y, Deng X, Wang X, Qiu R, Liu S, Zheng J, Zhong N, Ran P. Lung function and incidence of chronic obstructive pulmonary disease after improved cooking fuels and kitchen ventilation: a 9-year prospective cohort study. PLoS Med. 2014;11(3):e1001621. 31. Wang Jie. China air quality online monitoring and analysis platform.. 2013.
https://www.aqistudy.cn/. Accessed Sept 2013.
32. Stecher B, Maier L, Hardt WD. 'Blooming' in the gut: how dysbiosis might contribute to pathogen evolution. Nat Rev Microbiol. 2013;11(4):277–84. 33. Yu G, Gail MH, Consonni D, Carugno M, Humphrys M, Pesatori AC, Caporaso
NE, Goedert JJ, Ravel J, Landi MT. Characterizing human lung tissue microbiota and its relationship to epidemiological and clinical features. Genome Biol. 2016;17:163.
34. Rylance J, Kankwatira A, Nelson DE, Toh E, Day RB, Lin H, Gao X, Dong Q, Sodergren E, Weinstock GM, Heyderman RS, Twigg HL 3rd, Gordon SB. Household air pollution and the lung microbiome of healthy adults in Malawi: a cross-sectional study. BMC Microbiol 2016;11;16(1):182. 35. Gonzalez-Garcia M, Torres-Duque C. Wood smoke COPD: a new description
of a COPD phenotype. Eur Respir J. 2014;44:261–2.
36. Galli SJ, Borregaard N, Wynn TA. Phenotypic and functional plasticity of cells of innate immunity: macrophages, mast cells and neutrophils. Nat Immunol. 2011;19;12(11):1035–1044.
37. Brito JM, Belotti L, Toledo AC, Antonangelo L, Silva FS, Alvim DS, Andre PA, Saldiva PH, Rivero DH. Acute cardiovascular and in ammatory toxicity induced by inhalation of diesel and biodiesel exhaust particles. Toxicol Sci. 2010;116:67–78.
38. Goto Y, Ishii H, Hogg JC, Shih CH, Yatera K, Vincent R, van Eeden SF. Particulate matter air pollution stimulates monocyte release from the bone marrow. Am J Respir Crit Care Med 2004;15;170(8):891–897.
39. Lundborg M, Bouhafs R, Gerde P, Ewing P, Camner P, Dahlén SE, Jarstrand C. Aggregates of ultrafine particles modulate lipid peroxidation and bacterial killing by alveolar macrophages. Environ Res. 2007;104(2):250–7. 40. Becker S, Soukup JM, Sioutas C, Cassee FR. Response of human alveolar
macrophages to ultrafine, fine, and coarse urban air pollution particles. Exp Lung Res. 2003;29(1):29–44.
41. Miyata R, van Eeden SF. The innate and adaptive immune response induced by alveolar macrophages exposed to ambient particulate matter. Toxicol Appl Pharmacol. 2011;1;257(2):209–226.
42. Oberdörster G, Ferin J, Gelein R, Soderholm SC, Finkelstein J. Role of the alveolar macrophage in lung injury: studies with ultrafine particles. Environ Health Perspect. 1992;97:193–9.
43. Brain JD. Mechanisms, measurement, and significance of lung macrophage function. Environ Health Perspect. 1992;97:5–10.
44. Diaz-Sanchez D. Pollution and the immune response: atopic diseases–are we too dirty or too clean? Immunology. 2000;101(1):11–8.
45. Gaschler GJ, Zavitz CC, Bauer CM, Stämpfli MR. Mechanisms of clearance of nontypeable Haemophilus influenzae from cigarette smoke-exposed mouse lungs. Eur Respir J. 2010;36:1131–42.
46. Basilico P, Cremona TP, Oevermann A, Piersigilli A, Benarafa C. Increased myeloid cell production and lung bacterial clearance in mice exposed to cigarette smoke. Am J Respir Cell Mol Biol. 2016;54(3):424–35.
• We accept pre-submission inquiries
• Our selector tool helps you to find the most relevant journal
• We provide round the clock customer support
• Convenient online submission
• Thorough peer review
• Inclusion in PubMed and all major indexing services
• Maximum visibility for your research
Submit your manuscript at www.biomedcentral.com/submit


![Fig. 7 Microbial abundance and diversity in exposure groups. Boxplots of alpha diversity measures of species richness (operational taxonomic unit [OTU]](https://thumb-us.123doks.com/thumbv2/123dok_us/8156859.2162828/7.892.84.435.165.562/microbial-abundance-diversity-exposure-boxplots-diversity-operational-taxonomic.webp)

