title: Cell contractility facilitates alignment of
cells and tissues to static uniaxial stretch
running title: contractility facilitates cell
alignment
E.G.Rens
1,2and R.M.H.Merks
1,21Life Sciences, CWI, Science Park 123, 1098XG Amsterdam, The Netherlands
2Mathematical Institute, Leiden University, Niels Bohrweg 1, 2333CA Leiden, The Nether-lands
Abstract
During animal development and homeostasis, the structure of tissues, including muscles, blood vessels and connective tissues adapts to mechan-ical strains in the extracellular matrix (ECM). These strains originate from the differential growth of tissues or forces due to muscle contraction or gravity. Here we show using a computational model that by amplifying local strain cues, active cell contractility can facilitate and accelerate the reorientation of single cells to static strains. At the collective cell level, the model simulations show that active cell contractility can facilitate the formation of strings along the orientation of stretch. The computational model is based on a hybrid cellular Potts and finite-element simulation framework describing a mechanical cell-substrate feedback, where: 1) cells apply forces on the ECM, such that 2) local strains are generated in the ECM, and 3) cells preferentially extend protrusions along the strain ori-entation. In accordance with experimental observations, simulated cells align and form string-like structures parallel to static uniaxial stretch. Our model simulations predict that the magnitude of the uniaxial stretch and the strength of the contractile forces regulate a gradual transition between string-like patterns and vascular network-like patterns. Our sim-ulations also suggest that at high population densities, less cell cohesion promotes string formation.
Introduction
During embryonic development, a single fertilized egg cell grows into a complex functional organism [1]. Even after years of studying morphogenesis, the orga-nization of cells into tissues, organs and organisms, it still remains a puzzle how cells migrate and form the right pattern in the right part of the body at the right moment [2]. Apart from chemical signals [3], mechanical signals play an equally important role in morphogenesis [4, 5]. Static strains originating from differential growth of tissues are instrumental for the organization of cells in tissuesin vivo. For example, in quail heart, the endocardium generates strains to which cardiomyocyte microtubules orient [6]. Wing hinge contractions in
Drosophilacause anisotropic tension in the wing-blade epithelium, to which the cells align [7]. Using a multiscale computational modeling approach, here we unravel how static strains,e.g., resulting from the differential growth of tissues, may drive the organization of cells and tissues.
In vitroandin silicoexperiments have helped to unravel the cellular mecha-nisms underlying the adaptation of tissues to strain. Myocytes [8], mesenchymal stem cells [9], muscle cells, and endothelial cells [10] orient in parallel to uniax-ial static stretch. Furthermore, fibroblasts organize into string-like structures in parallel to the stretch orientation [11], whereas endothelial cells form monolayers of cells oriented in parallel to the stretch [10].
matrices, fibroblasts were found to align along strain in the absence of fiber alignment [11, 19]. Other authors observed that collagen fibers aligned only after the cells had aligned [20, 21]. Moreover, fibroblasts can orient along the uniaxial stretch even if fibronectin fibers were aligned perpendicular to the stretch [22]. Altogether, these results suggest that cells can orient to stretch independently of the fiber orientation.
Mathematical modeling is a helpful tool to explore what biophysical mech-anisms can explain the alignment of cells to strain. Previous mathematical models [23, 24] were based on optimization principles. Bischofs and Schwarz [23] proposed that cells minimize the amount of work needed for contracting the matrix. For dipolar cells, the work was minimized if they oriented in paral-lel with the uniaxial stretch. If the cells were assumed to generate strains in their local environment, cells formed strings, which aligned with an external strain field [23, 25, 26]. Based on the observation that cells reorganize focal adhesions and stress fibers to maintain constant local stresses, Deet al. [24] proposed that cells adapt their contractility and orientation in order to find the minimal local stress in the matrix. They showed that the local stress becomes minimal if a dipolar cell orients in parallel to uniaxial stretch, as in this configuration the cell traction forces counteract the uniaxial stretch.
In this work, we explain cellular alignment to strain based on a mesoscopic, experimentally testable cellular mechanism. To simulate this mechanism, we propose a hybrid computational model in which the Cellular Potts Model (CPM) [27] is coupled to a finite-element model (FEM) of the matrix. The computa-tional model [28] captures the mechanical cross-talk between the extracellular matric (ECM) and the cells as follows: 1) cells apply forces on the ECM [29]; 2) the resulting strains in the ECM are calculated using a Finite Element Method (FEM); and 3) cells extend protrusions oriented along strain [21].
Based on experimental observations of fibroblasts on elastic substrates [30] and on modeling studies [24], it has been suggested that cellular traction forces may dominate over, or even counteract global strain cues. Paradoxically, our model suggests that contractile cells locally increase the global uniaxial strain whichfacilitates cell alignment to static uniaxial stretch. Our model also sug-gests that by contracting the matrix, cells can form strings in parallel to the orientation of uniaxial stretch. Finally, our simulations show that differences in cell cohesion and population density may determine under what conditions cells form strings, and when they only align on a individual level.
Methods
the substrate resulting from these forces (Figure 1C). Subsequently, the strains in the ECM influence cell movement in the CPM. More precisely, we assume that cells preferentially extend along the orientation of high strain.
Figure 1: Structure of the coupled CPM-FEM model. (A) CPM calculates cell shapes in response to local ECM strains; (B) calculation of cellular traction forces based on cell shapes [29]; (C) substrate strains due to cellular traction forces.
Cellular Potts Model
The CPM [27] describes cells on a regular lattice Λ ⊆Z2 as a domain of
con-nected lattice sites,~x, of identical spin, orcell identifier, σ(~x)∈Z≥0. Sites of
spin σ(~x) > 0 identify sections of the substrate that are covered by a biolog-ical cell, whereas sites of spin σ(~x) = 0identify exposed substrate sites. The configuration of cells evolves according to the Hamiltonian,
H = X
s∈cells
λ a(s)
−A(s)
A(s)
2
+ X
(~x,~x0)
J(σ(~x), σ(~x0))(1−δ(σ(~x), σ(~x0))). (1)
The first term is a surface area constraint, with a(s) =|{~x|~x∈Λ∧σ(~x) =s}|, the number of lattice sites covered by cells,A(s)a target area andλa Lagrange multiplier. The second term represents the interfacial energies in the system,
e.g., due to cell adhesion and cortical tensions. Here, J(σ(x~), σ(~x0)) is the interfacial energy between an adjacent lattice site pair(~x, ~x0)andδ(σ(~x), σ(~x0))
is the Kronecker delta. The contact energyJcc regulates the degree of cell-cell
adhesion, with lower values ofJcccorresponding to strong cell-cell adhesion.
To mimic cellular protrusions and retractions of the cells, the cellular Potts model iteratively picks a random lattice site ~x and attempts to copy its spin
σ(~x)into an adjacent site ~x0. The algorithm then calculates the energy change
probabilityP(∆H+∆Hdir) = exp(−(∆H+∆Hdir)/T)to allow for stochasticity of cell movements. T ≥0 is a cellular temperature whose magnitude gives the amount of random cell motility. An additional connectivity constraint rejects copy attempts that would split cells into disconnected patches. During one Monte Carlo Step (MCS) N copy attempts are made, withN =|Λ|, i.e., the number of sites in the lattice.
To simulate the response of cells to strains in the substrate, we assumed that local strains promote cellular protrusion and inhibit cellular retractions. Such a mechanism is motivated by focal adhesions, large integrin complexes that bind the cell to the matrix and maturate on stiffer matrices [32]. We assume a strain stiffening material, so that focal adhesions mature on highly strained areas. We thus set
∆Hdir=−g(σ(~x), σ(~x0))λstrain h(E(1))(v~1·~vm)2+h(E(2))(~v2·~vm)2, (2)
where λstrain is a parameter that describes the sensitivity of cells to strain.
~
vm = ~x\−~x0, is the direction of copying, and 1 and 2, and v1 and v2 are the eigenvalues and eigenvectors of that represent the principal strains and strain orientation in the target site ~x0. We use g(σ(~x), σ(~x0)) = 1 if a cell is extending and g(σ(~x), σ(~x0)) =−1 if a cell is retracting, to impose that strain stiffening of the matrix promotes extensions and inhibits retractions. At cell-cell interfaces we assume that the forces due to strain (∆Hdir) on the extending cell and the retracting cell are balanced, i.e., g(σ(~x, ~x0)) = 0 ifσ(~x) 6=σ(~x0) and
σ(~x)>0∧σ(~x0)>0. We thus assume that neither of the two cells involved in the copy attempt benefits more from occupying a strained lattice site than another cell. The sigmoid functionh(E()) = 1/(1 + exp(−β(E()−Eθ)))expresses that
a minimum stiffness,Eθ, is required for focal adhesion maturation. We assume
that cells perceive strain stiffening of the matrix, described by the function
E() = E0(1 + (/st), where st is a stiffening parameter. Compared to our
previous implementation of this model [28], slight adaptations have been made in the Hamiltonian, which are discussed in the Supporting Material. They do not affect the qualitative behavior of the model. The parameter values used in this study are reported in Table S1. We use a discretization of ∆x= 2.5µm. Based on single cell dispersion rates in our model, we previously estimated the time interval ∆t corresponding to one MCS to be between ∆t = 0.5 seconds and∆t= 3seconds [28].
Finite-element model of compliant substrate
A FEM [33] is used to calculate the strain on the substrate resulting from forces applied to the substrate. The substrate is assumed to be isotropic and linearly elastic. For simplicity, we applied infinitesimal strain theory, assuming that material properties, including local density and stiffness are unchanged by deformations. So, the strain tensoris given by
=
xx xy
yx yy
≈1
2(∇~u+∇~u
T
), (3)
where~u= (ux, uy)is the substrate deformation.
The elements of the FEM coincide with the lattice sites of the CPM, i.e.,
the shape functionsNe
n(x, y), for n= 1,2,3,4 corresponding to the four nodes
(corners) of lattice site/elemente:
~
ue(x, y) =
4
X
n=1
Nn(x, y)~un, (4)
where ~un is the substrate deformation at noden. We used conventional linear
shape functions for four-noded quadrilateral elements [33]. The FEM is iter-ated until equilibrium (K~u=f~, whereK denotes the stiffness matrix [33]), to calculate the deformation ~un at each node. All figures in this paper show the
strain in equilibrium. The termsij in the strain tensoreof elementeare thus
given by
eij(x, y) =1 2
4
X
n=1
∂Nn(x, y)
∂i ~un+
∂Nn(x, y)
∂j ~un. (5)
In our simulations, the unstretched substrate ~u=~0 is used as a reference con-figuration for the displacements due to uniaxial stretch and cell contractility. This simplifies our calculations and speeds them up. For details, see Ref. [28].
Cellular traction forces
To model the traction forces that cells apply on the substrate we make use of an experimentally-validated, predictive model, called the first-moment-of-area (FMA) model [29]. The FMA model is based on the assumption that the network of actin fibers acts in the cells as a single, cohesive unit. In the context of our hybrid CPM-FEM model, we implement the FMA model as follows. Defining lattice nodes as the corners of the CPM lattice sites, each lattice node
icovered by a CPM cell pulls on every other nodejwithin the same cell, with a forceF~ of magnitude proportional to the distance between the nodes,d~i,j, and
~
di,j= 0if line piece(i, j)intersects with the cell boundary (see Ref. [29], Figure
S1A-D and Supporting Material for details). The total forceF~i on nodeithen
becomes,
~ Fi=µ
X
j
~
di,j, (6)
In accordance with the assumption that the cytoskeleton has uniform contrac-tility, the line pieces have a constant tension per unit distance µ [29]. For convex cells, the resultant forces point towards the cell’s center of mass. For non-convex cells, the resultant forces are directed towards the individual, convex compartments that the cell shape is composed of (see Supplementary Material).
Results
matrix in the FEM. This results in a static strain of around 8% on the matrix. The cellular tensionµ (see Eq. 6) was set to 0.0025 nN/µm, resulting in local strains around the tips of elongated cells of up to 2%, amplifying the static strain to values of around 10%.
Individual cell response to uniaxial stretch is amplified by
cell contractility
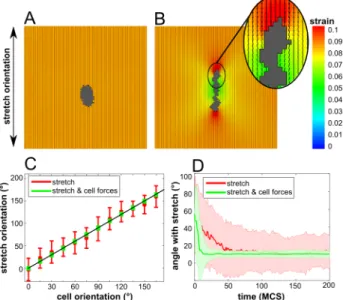
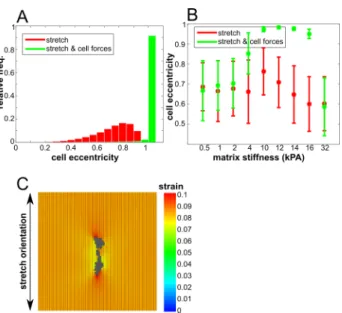
Figure 2: (A) Non-contractile cell on substrate stretched along 0◦at 500 MCS; (B) contractile cell on substrate stretched along 0◦ at 500 MCS; (A-B) colors: principal strain magnitude; orientation and length of black line pieces: orien-tation and magnitude of principal strain; (C) cell orienorien-tation as a function of stretch orientation at 500 MCS; averaged overn= 100simulations; error bars: standard deviations; black line shows linear fit; (D) time series of the orientation of a single cell on a substrate stretched over 0◦, averaged overn = 100
simu-lations; shaded regions: standard deviations. Color coding (C-D): red (with large standard deviations): non-contractile cells; green (with larger standard deviations): contractile cells.
To study single cell orientation in more detail and check the isotropy of the model, we performed 100 simulations of single contractile and non-contractile cells for 500 MCS, using stretch angles in the range0◦ to180◦ with increments of 15◦ on a 100 ×100 lattice, representing a piece of tissue of 250×250 µm. Cells with a diameter of seven lattice sites were initiated in the middle of the matrix. The cell orientation was estimated from the inertia tensor of the cells (see Supporting Material). Figure 2C plots the cell orientation as a function of the orientation of stretch for cells without active contraction (red boxes) and with active contraction (green boxes). In both conditions, the cells follow the strain orientation on average. However, the cells that apply active contractile forces on the matrix followed the orientation with much higher accuracy, as evidenced by the much smaller standard deviations. Also, the eccentricities of the contractile cells were much more narrowly distributed than those of non-contractile cells (Figure S2A). Figure 2D shows that the non-contractile cells oriented more quickly to the stretch orientation than the non-contractile cells. This behavior was only observed on matrices of intermediate stiffness (Figure S2B). On soft substrates, cells remain small [28] and as a result do not apply sufficient force on the matrix. On a very stiff matrix, cells protrude in all directions [28] and thus they cannot orient along a specific angle.
feedback loop between cell shape, cell traction forces and strain stiffening. Cells elongate slightly in response to uniaxial stretch. Due to the anisotropic cell shape, cells pull harder on the matrix around the tip of the cells, since the distance between the tip of the cell and the cell interior increases (see Eq. 6). So, the matrix stiffens around the tip of the cell which further promotes cell elongation along uniaxial stretch.
Cell contractility enables cells to align with each other in
parallel to uniaxial stretch
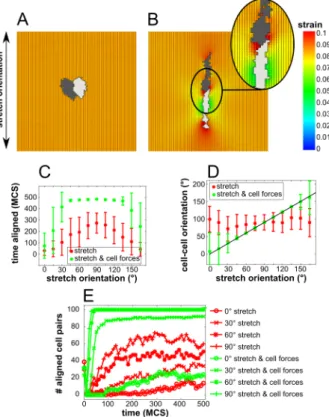
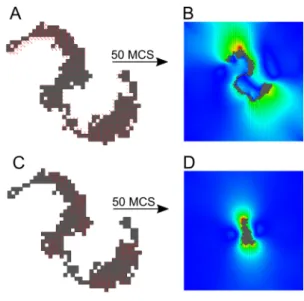
Figure 3: (A) Non-contractile cell pair on substrate stretched along 0◦ at 500 MCS; (B) contractile cell pair on substrate stretched along 0◦at 500 MCS; (A-B) colors: principal strain magnitude; orientation and length of black line pieces: orientation and magnitude of principal strain; (C) fraction of time a cell pair is aligned, averaged overn= 100 simulations, upper bars for contractile cells and lower bars for non-contractile cells; (D) angle of the line connecting the center of masses as a function of stretch orientation at 500 MCS, averaged overn= 100
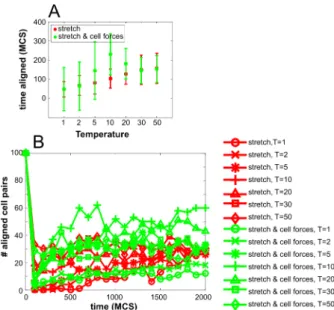
simulations, contractile cells follow the extra plotted linear line piece. (C-D): error bars: standard deviations; (E) time series of the number of cell pairs that are aligned on stretched substrates with different stretch orientations; symbols are circle: 0◦, cross: 30◦, star: 60◦, plus: 90◦, upper lines for contractile cells and lower lines for non-contractile cells. Color coding (C-E): red: non-contractile cells; green: contractile cells.
con-traction (green boxes). Contractile cells align more often with each other than non-contractile cells. To confirm that cells align along the stretch orientation, we measured the orientation of the line connecting the center of masses of the two cells. Figure 3D plots this cell-cell angle as a function of stretch orientation; a pair of contractile cells align along stretch, compared to non-contractile cells that stick around their initial position (placed horizontally next to each other) and thus keep their initial alignment angle of90◦.
Figure 3E plots the number of cell pairs that aligned as a function of time in n = 100simulations. This shows that with stretch around 0◦, cells cannot always align. This is because, after initial elongation, the tips of the cells are not in each other’s vicinity, such that the cells cannot sense each other’s strain. Interestingly, this phenomenon may provide an explanation for an experimental observation reported by Winer et al.[34]. Studying the behavior of endothe-lial cells on compliant matrices, they observed that cell pairs aligned more on 2mg/ml polyacrylamide gels than on a softer, 1 mg/ml gel on which cell as-sumed an extremely elongated shape. They hypothesized that this “extremely elongated shape of the cells and thus the shape of the resulting strain field re-duced the probability that a second cell would come in contact with the affected gel”. To test this hypothesis in our model, we increased the probability of a cell to come into contact with the strain field of the other cell, by increasing the cellular temperatureT. IncreasingT increases the probability that a cell makes a protrusion. Figure S4A shows the fraction of time a pair of contractile cells are aligned as a function of T and Figure S4B shows how the number of cell pairs that are aligned depend on T. This illustrates that pairs of cells more readily align at higher values of T. These simulation results thus match the hypothesis of Wineret al. [34]. At motilities larger than approximatelyT = 20
cell motility became randomized to the extent that the cells could no longer align.
In summary, in our model pairs of contractile cells aligned in head-to-tail configurations along the orientation of stretch, whereas non-contractile cells oriented with the stretch, but not in a head-to-tail fashion. The bipolar strain fields around the contractile cells were instrumental for this cell-cell alignment.
Cell contractility facilitates the self-organization of cells
into strings oriented parallel to uniaxial stretch
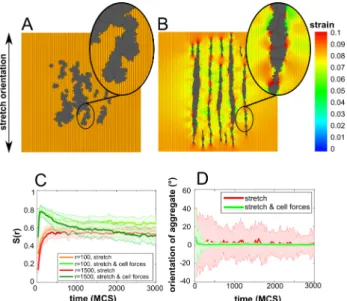
Figure 4: (A) Non-contractile cells on substrate stretched along 0◦at 3000 MCS; (B) contractile cells on substrate stretched along 0◦at 3000 MCS; (A-B) colors: principal strain magnitude; orientation and length of black line pieces: orien-tation and magnitude of principal strain; (C) time series of orienorien-tational order parameter S(r), averaged over n = 25 simulations; color coding: red (lowest line): r=100 µm for non-contractile cells, orange (second lowest line): r=1500
µmfor non-contractile cells, green (highest line): r=100µmfor contractile cells, dark-green (second highest line): r=1500µm for contractile cells; (D) time se-ries of the orientation of cell aggregates on a substrate stretched over 0◦at 3000 MCS, averaged over n= 25 simulations; shaded regions: standard deviations. red (with large standard deviations): non-contractile cells; green (with larger standard deviations): contractile cells.
To study this behavior in more detail, we performed 25 simulations of a group of cells on a 400×400 lattice, representing a piece of tissue of 1×1 mm, for 3000 MCS for both scenarios, for a stretch angle of 0◦. Cells are initially placed uniformly inside a region of 200 ×200 lattice sites in the middle of the matrix, as to minimize boundary effects. Cells are initially one lattice site in size. The density of cells wasd=0.15, yielding around 120 cells. To characterize the collective orientation of cells, we measured a two-dimensional orientational order parameterS(r), with ranger(µm), defined for the Cellular Potts Model
as in Ref.[35]. Briefly, S(r) =Dcos 2θ(X~(s), r)E
s, where
~
X(s) is the center of
mass of cellsand θ(X~(s), r)is the angle between the orientation of the cell of spin s and a local director, i.e., the average orientation of the cells within a radiusraround the centroid of cells(see Supporting Material for detail). S(r)
ranges fromS(r) = 0 for configurations of randomly oriented cells, toS(r) = 1
and similar global ordering than non-contractile cells. Note that contractile cells initially obtain a high orientational order, close to 0.8. Since cells initially have enough space, they elongate well. When cells start to adhere to another and form strings, cells in the interior of a string cannot orient well, such that the global orientational order parameter decreases. This is a model artifact which we investigated further in the Supporting Material and address in the discussion section.
To confirm that by contracting the matrix, cells co-align into strings oriented along uniaxial stretch, we measured the orientation of cell aggregates, with a cell aggregate defined as a connected patch of cells (see Supporting Material for details on the calculation). Figure 4D plots the orientation of cell aggregates as a function of time, of non-contractile cells (green curve) and of contractile cells (red curve). In both conditions, cells form aggregates with an orientation around
0◦, which is the orientation of stretch. The aggregates formed by contractile cells follow the stretch orientation more accurately, as shown by the smaller standard deviations, indicating that strings have formed.
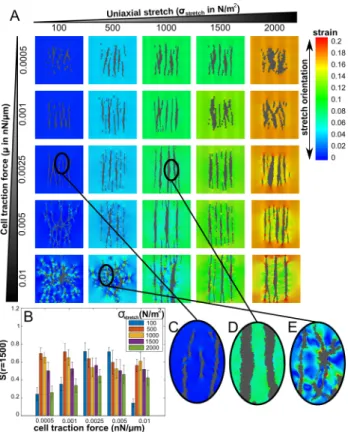
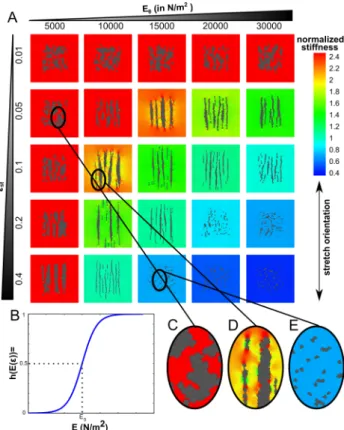
Figure 5: (A) Contractile cells on substrate stretched along 0◦ at 3000 MCS simulated with various values of cell traction force and matrix stretching force; (B) Global orientational order parameter S(r = 1500µm) at 3000 MCS, av-eraged over n = 25 simulations; error bars: standard deviations; bars in bar chart are sorted according to value of σstretch as indicated in figure inset;(C) zoom in of cell configuration ofµ= 0.0025, Fstretch= 100; (D) zoom in of cell configuration of µ= 0.0025, Fstretch = 1000; (E) zoom in of cell configuration of µ= 0.01, Fstretch= 500. Colors A,(C-E): principal strain magnitude; orien-tation and length of black line pieces: orienorien-tation and magnitude of principal strain.
order parameter shows a biphasic dependence on uniaxial stretching (first set of bar plots in Figure 5B). This is explained in our model as follows. Cell forces cannot sufficiently amplify a small uniaxial stretch and thus more uniaxial stretch is needed to instigate string formation. However, at higher uniaxial stretch, the cell traction forces are insufficiently strong to amplify the uniaxial strain and as a result cells do not form strings. Note that these cells do not form networks with little uniaxial stretch, as they do not sufficiently contract the matrix to align with other cells. If cells are highly contractile (last row in Figure 5A) they form networks, similar to cells on non-stretched matrices (Figure 1F). Higher uniaxial stretching transforms a network into an oriented network (Figure 5E) and subsequently into strings. Indeed, the global order has a biphasic dependence on stretching (last set of barplots in Figure 5B). This is because with too little uniaxial stretch, cell generated strains dominate the global strain cue and thus cells do not collectively orient. Of course, if we would increase uniaxial stretch even more, cells would align but not form strings anymore.
To better understand the results in Figure 5, recall that cells extend towards areas that are stiffened by strain, as described by the sigmoid functionh(E()) = 1/(1 + exp(−β(E()−Eθ)))(Figure S5B), whereE() =E0(1 + (/st). Figure
S5A shows that cells can only form strings when the matrix is stiffened to values aboveEθ (Figure S5D). If the matrix is not stiffened, or becomes too rigid, the
cells will not align (Figure S5C and E). To relate this to Figure 5, instead of strain, we plotted normalized stiffness values EE()
θ in Figure S6. This shows
that when the uniaxial stretch stiffens the matrix to values aroundEθ and cell
traction forces then stiffen the matrix more, strings can be formed. However, strings can not be formed when the matrix is stiffened too much by either the cells or the uniaxial stretch.
Altogether, the results suggest that an optimal balance between uniaxial stretch and cell contractility is needed for cells to form strings.
Decreasing cell-cell adhesion promotes string formation in
populations with high cell density
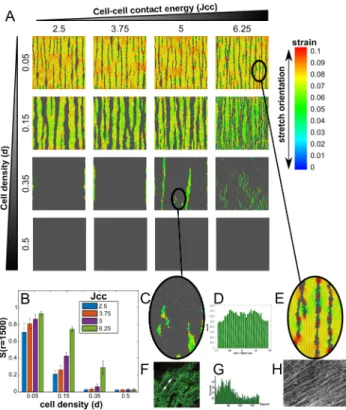
Figure 6: (A) Contractile cells on substrate stretched along 0◦ at 3000 MCS simulated with various values of cell density and cell-cell contact energy; (B) Global orientational order parameter S(r = 1500µm) at 3000 MCS, averaged over n = 25 simulations; error bars: standard deviations, first bar is for the lowest value ofJcc; (B) Global orientational order parameterS(r= 1500µm)at 3000 MCS, averaged over n= 25 simulations; error bars: standard deviations; bars in bar chart are sorted according to value ofJccas indicated in figure inset; (C) zoom in of cell configuration ofJcc= 5, d= 0.35; (D) Cell orientations of
Jcc = 6.25,d= 0.35; (E) zoom in of cell configuration ofJcc= 6.25,d= 0.05; (F) 3D culture of endothelial cells on uniaxially stretched matrix, taken from Van der Schaft et al. [10]; (G) Orientation of 3D culture of endothelial cells on uniaxially stretched matrix, taken from Van der Schaft et al. [10]; (H) Fibroblasts on uniaxially stretched matrix, taken from Eastwood et al. [11]. Colors A,C,E: principal strain magnitude; orientation and length of black line pieces: orientation and magnitude of principal strain.
Figure 6A shows an overview of the final configurations of simulations in which we systematically varied cell density and cell-cell contact energies; Fig-ure 6B shows the corresponding global orientational order parameters. To better mimic variable densities of cells, we initialized cells on the whole grid of400×400
lattice sites. The configurations shown in Figure 6A suggest that fewer, thicker strings are formed if the cells adhere more strongly to one another (i.e., low
Jcc). Also, the global order parameter increases as the cell-cell contact energies
distri-bution of cell orientations (Figure 6D) qualitatively resemble the experiments by Van der Schaftet al. [10] (Figure 6 F and G). Decreasing cell-cell adhesion and cell densities tod= 0.05andJcc= 6.25produces configurations similar to
Eastwoodet al. [11] (Figure 6E and H). Currently, in completely confluent cell layers with high cell-cell adhesion (d= 0.35, d= 0.5,Jcc= 3.75,2.5in Figure 6)
the cells do not align at all, because in our model the cells cannot respond to strain at cell-cell interfaces. We investigated this issue further in the Supporting Material and address this in the discussion section.
Discussion
In this paper we have presented a computational model to show that active cell contraction can facilitate cellular alignment to the orientation of static uniaxial stretch. The computational model describes motile cells living on top of an elas-tic substrate, and is based on only a few, experimentally validated assumptions: (a) cells exert contractile forces on the substrate, which locally generate strains in the substrate [29, 37]; (b) cells move by repeatedly attempting to extend or retract pseudopods at random, and (c) along the substrate strain orientation, pseudopod extensions are promoted and pseudopod retractions are inhibited [21], a procedure mimicking the maturation of focal adhesions under strain [32]. We have shown previously [28] that these assumptions suffice to reproduce (1) the elongation of single cells on compliant substrates, (2) the alignment of two adjacent cells, and at the collective level (3) the formation of vascular-like net-work structures and angiogenesis-like sprouting structures. Here we show that a refined version of this model also reproduces experimentally observed behavior of fibroblasts, endothelial cells and myocytes on statically, uniaxially stretched substrates: (1) cells tend to align in parallel to the uniaxial stretch orientation [8, 9, 10] (cf. Figure 2); (2) cells align with one another in parallel to the uni-axial stretch orientation (Figure 3); and (3) collectively, the cells form strings oriented along the stretch (Ref. [11] and Figure 4) and they elongate along the stretch in close to confluent layers of cells (Ref. [10] and Figure 6). Although the assumed response to strains (assumption (c)) makes the simulated cells orient to the stretch without contractility (see Ref. [28] and Figure 2A), active contractil-ity makes cells elongate more strongly (Figure 2B), and allows them to respond to strain cues more accurately (Figure 2C) and more rapidly (Figure 2D) than non-contractile cells. Thus, a crucial factor for these phenomena is the balance between active cell contractility and the magnitude of the uniaxial stretch cue. Provided the cellular traction forces are sufficiently strong, the cells will collec-tively organize into oriented strings even in response to very subtle strain cues (Figure 5). For stronger cell contractility, however, the local strains will over-ride the global strain cue and the cells will organize into network-like patterns as reported previously (see Figure 5A, lower left panels; also cf. Ref [28]). The reported model behavior holds for substrates with stiffness of approximately
10 kPato approximately16 kPa, a wider range than the autonomous cell elon-gation reported previously [28]. Note that the exact magnitude of this range depends on the parameter settings and in particular threshold E0 in sigmoid function h(E()), whose values were kept unchanged relative to Ref. [28] (see Table S1).
on the response to uniaxial static stretch of single cells and on the collective behavior of multiple cells. Single cells in our models elongate more easily and reorient more easily to uniaxial static stretch if they contract the matrix. At the multicellular level, contractility induces string formation on uniaxially stat-ically stretched matrices. A number of published in vitro experiments already support the single cell behavior that our model predicts. For example, oxida-tively modified low density lipoprotein (oxLDL) stimulates the contractility of human aortic endothelial cells, which correlates with increased cell elongation [38]. Fibroblasts moving on stretched collagen gels align their trajectories more strongly to the strain orientation than less contractile neutrophils [39]. To val-idate single cell response to uniaxial static stretch, we propose experiments in which cells with different contractilities are seeded on a uniaxially stretched matrix as, e.g., in Ref. [39]. Treatment with lysophosphatidic acid (LPA) can stimulate Rho-mediated contractility [40, 26], while treating cells with blebbis-tatin or cytochalasin D inhibits contractility [34]. At the multicellular level, with increasing uniaxial stretch, our model system switches gradually between networks and strings (Figure 5). Previous cell culture studies [11, 10] have not varied the strain magnitude, but in uniaxially, statically stretched ex ovochick chorioallantoic membranes blood vessels realign along stretch [41]. Further in vitro experiments could vary the magnitude of the uniaxial stretch and the de-gree of contractility using chemical treatments (seee.g., Ref. [42] for a suitable experimental system). The cell density and the cell-cell adhesion strength also influenced the ability of cells to form strings. At high cell densities, simulated cells are less able to form strings, while decreasing cell-cell adhesion restores string formation. Uniaxial stretching experiments where cell-seeding densities are varied and cell-cell adhesion is controlled, by inhibiting or knocking out Cadherins, could validate these predictions.
adhesions.
The current, coarse-grained description has suggested new mechanisms for the experimental observations listed above, but due to a number of technical limitations it still fails to reproduce others. We cannot yet reproduce cell align-ment to uniaxial stretch in a completely confluent layer, because the strain-bias of the cell protrusions and retractions is cancelled out at cell-cell interfaces (see Eq. 2 and Figures S7A and S7B). As a first exploration of the behav-ior of our model in absence of this effect, we ran a series of simulations in which we differentiated the probability of the retractions relative to extensions. With an decreased retraction probability (∆Hdirretraction=−2∆Hdirextension), fully confluent cell layers collectively oriented in parallel to stretch (Figures S7C and S7D). In contrast, in simulations with an increased retraction probability (∆Hretraction
dir = −0.5∆H
extension
dir ), the cells oriented themselves perpendicular to the stretch orientations in a confluent layer (Figures S7E and S7F). Another result of the absence of strain-effects at cell-cell boundaries, is that contractile cells do not achieve a high global ordering within strings (Figure 4A); this is because cells in the interior of the strings do not elongate. When the retrac-tion probability is decreased (∆Hretraction
dir = −2∆Hdirextension), the contractile cells reach a higher global ordering (S(r = 1500µm) = 0.71) compared to the non-contractile cells (S(r= 1500µm) = 0.51) (Figure S8A). In simulations in which the retraction probability is increased (∆Hretraction
dir =−0.5∆Hdirextension), the contractile cells reached a lower global ordering (S(r = 1500µm) = 0.37) compared to the non-contractile cells (S(r = 1500µm) = 0.64), as some cells in the interior of strings started to align perpendicular to strain (Figure S8B). Despite these quantitative differences, note that cells form strings irrespective of the specific modeling choices (Figure S8 C and D). Also related to this mod-eling choice is the apparent unrealistic cell shape as presented in Figure S2C. Such cells appear less frequently in simulations where retraction probabilities are decreased (∆Hretraction
dir =−2∆H
extension
dir ) (Figure S8 C and D)). This work primarily focused on the collective behavior of cells; in our ongoing work we are developing more detailed, single-cell models.
of the CPM. From a biophysical point of view the operator splitting assumption is valid if we can separate the time-scales of the growth and degradation of focal adhesions, such that cell traction forces remain approximately constant during the time represented by one MCS. Indeed, focal adhesion dynamics occur at a timescale of minutes, which is longer than one MCS, which in our model is equivalent to 0.5 to 3 seconds [28]. An ongoing improvement of our approach concerns the coupling between the cellular traction forces, as represented by the FMA model (Eq. 6), and the representation of these forces in the Hamiltonian (Eqs. 1). In the basic CPM, the area conservation and adhesive energy terms in the Hamiltonian describe a pressure and approximate a membrane tension which together represent cell contractility. This allowed us to study the effects of cell-cell contact energies. These terms are not equal to the forces described by the FMA model. The strength of this model is that it produces experimen-tally validated strain fields. The decoupling of the CPM and the FMA model will become an issue at locations where the two sets of forces are unequal,e.g., at cell-cell interfaces and can affect te mesoscopic cell behavior. Since we are interested in how mesoscopic cell behavior affects the macroscopic level, i.e., collective behavior, these approximations and decoupling suffice here. In our ongoing work, we are adopting an approach proposed by Albert and Schwarz [46] to alleviate this issue.
In summary, we proposed a local cell-matrix feedback mechanism explaining the reorientation of cells to external stretch. In agreement with experimen-tal observations, in this model cell contractility facilitates the reorientation of cells. The proposed mechanism also suffices for the formation of strings along the orientation of stretch. In our future work, we are refining the model by introducing explicit focal adhesion dynamics. This approach will pave the way for issues that our model can currently not explain, including the response of cells to cyclic stretch [48, 49], and the role of cell-substrate adhesivity in the formation of network-like patterns [50] and collective cell behavior [47].
Supporting citations
References [51] and [52] appear in the Supporting Material.
Author’s contributions
Designed research: EGR, RMHM; performed research and analyzed data: EGR; wrote the manuscript: EGR, RMHM.
Acknowledgements
References
[1] P. Friedl and D. Gilmour. Collective cell migration in morphogenesis, re-generation and cancer. Nat Rev Mol Cell Biol, 10(7):445–457, 2009. [2] G. Reig, E. Pulgar, and M. L. Concha. Cell migration: from tissue culture
to embryos. Development, 141(10):1999–2013, 2014.
[3] K. W. Rogers and A. F. Schier. Morphogen gradients: From generation to interpretation. Annu Rev Cell Dev Bi, 27:377–407, 2011.
[4] M. J. Siedlik and C. M. Nelson. Regulation of tissue morphodynamics: an important role for actomyosin contractility. Curr Opin Genet Dev, 32:80– 85, 2015.
[5] J. H. Shawky and L. A. Davidson. Tissue mechanics and adhesion during embryo development. Dev Biol, 401(1):152–164, 2015.
[6] B. Garita, M. W. Jenkins, M. Han, C. Zhou, M. Vanauker, A. M. Rollins, M. Watanabe, J. G. Fujimoto, and K. K. Linask. Blood flow dynamics of one cardiac cycle and relationship to mechanotransduction and trabecula-tion during heart looping. Am J Physiol-Heart C, 300(3):H879–91, 2011. [7] B. Aigouy, D. B. Staple R. Farhadifar, A. Sagner, J c. Roper, F. Julicher,
and S. Eaton. Cell flow reorients the axis of planar polarity in the wing epithelium of drosophila. Cell, 142(5):773–786, 2010.
[8] A. M. Collinsworth, C. E. Torgan, S. N. Nagda, R. J. Rajalingam, W. E. Kraus, and G. A. Truskey. Orientation and length of mammalian skele-tal myocytes in response to a unidirectional stretch. Cell Tissue Res, 302(2):243–251, 2000.
[9] C. Liu, S. Baek, J. Kim, E. Vasko, R. Pyne, and C. Chan. Effect of static pre-stretch induced surface anisotropy on orientation of mesenchymal stem cells. Cellular and molecular bioengineering, 7(1):106–121, 2014.
[10] D. W. J. van der Schaft, A. C. C van Spreeuwel, H. C. van Assen, and F. P. T. Baaijens. Mechanoregulation of vascularization in aligned tissue-engineered muscle: a role for vascular endothelial growth factor. Tissue Eng Part A, 17(21-22):2857–2865, 2011.
[11] M. Eastwood, V. C. Mudera, D. A. McGrouther, and R. A. Brown. Ef-fect of precise mechanical loading on fibroblast populated collagen lattices: morphological changes. Cell Motil and the Cytoskel., 40(1):13–21, 1998. [12] D. Vader, A. Kabla, D. Weitz, and L. Mahadevan. Strain-induced alignment
in collagen gels. PLoS ONE, 4:6e5902, 2009.
[14] R. J. Klebe, H. Caldwell, and S. Milam. Cells Transmit Spatial Information by Orienting Collagen Fibers. Matrix., 9(6):451–458, 1989.
[15] K. Takakuda and H. Miyairi. Tensile behaviour of fibroblasts cultured in collagen gel. Biomaterials., 17(14):1393–1397, 1996.
[16] J. W. Reinhardt, D. A. Krakauer, and K. J. Gooch. Complex matrix remod-eling and durotaxis can emerge from simple rules for cell-matrix interaction in agent-based models. J Biomech Eng, 135(7):71003, 2013.
[17] J. W. Reinhardt and K. J. Gooch. Agent-Based Modeling Traction Force Mediated Compaction of Cell-Populated Collagen Gels Using Physically Realistic Fibril Mechanics. J Biomech Eng, 136(2):021024, 2014.
[18] R. J. Dyson, J. E. F. Green, J. P. Whiteley, and H. M. Byrne. An inves-tigation of the influence of extracellular matrix anisotropy and cell matrix interactions on tissue architecture. J Math Biol, 72:1775, 2016.
[19] A. Tondon and R. Kaunas. The direction of stretch-induced cell and stress fiber orientation depends on collagen matrix stress. PLoS ONE, 9(2):e89592, 2014.
[20] E. J. Lee, J. W. Holmes, and K. D. Costa. Remodeling of engineered tissue anisotropy in response to altered loading conditions. Ann Biomed Eng, 36(8):1322–1334, 2008.
[21] Y. Pang, X. Wang, D. Lee, and H. P. Greisler. Dynamic quantitative visu-alization of single cell alignment and migration and matrix remodeling in 3-D collagen hydrogels under mechanical force.Biomaterials., 32(15):3776– 3783, 2011.
[22] V. C. Mudera, R. Pleass, M. Eastwood, R. Tarnuzzer, G. Schultz, P. Khaw, D. A. McGrouther, and R. A. Brown. Molecular responses of human dermal fibroblasts to dual cues: contact guidance and mechanical load. Cell Motil Cytoskel., 45(1):1–9, 2000.
[23] I. B. Bischofs and U. S. Schwarz. Cell organization in soft media due to active mechanosensing. P Natl Acad Sci USA, 100(16):9274–9297, 2003. [24] R. A. Zemel De and S. A. Safran. Dynamics of cell orientation. Nat Phys,
3:655–659, 2007.
[25] I. B. Bischofs and U. S. Schwarz. Effect of Poisson Ratio on Cellular Struc-ture Formation. Phys Rev Lett., 95(6):068102, 2005.
[26] I. B. Bischofs and U. S. Schwarz. Collective effects in cellular structure formation mediated by compliant environments: a Monte Carlo study.Acta biomater., 2(3):253–265, 2006.
[28] R. F. M. van Oers, E. G. Rens, D. J. LaValley, C. A. Reinhart-King, and R. M. H. Merks. Mechanical Cell-Matrix Feedback Explains Pairwise and Collective Endothelial Cell Behavior In Vitro. PLoS Comput Biol, 10(8):e1003774, 2014.
[29] C. A. Lemmon and L. H. Romer. A Predictive Model of Cell Traction Forces Based on Cell Geometry. Biophys. J, 99(9):L78–L80, 2010.
[30] C-m. H-b. Wang Lo, M. Dembo, and Y l. Wang. Cell Movement Is Guided by the Rigidity of the Substrate. Biophys. J, 79(1):144–152, 2000.
[31] J. A. Glazier, A. Balter, editors K. Rejniak N. J. Popławski, and A. Anderson. Magnetization to Morphogenesis: A Brief History of the Glazier-Graner-Hogeweg Model In Single-Cell-Based Models in Biology and Medicine. pp 79–106. Birkhäuser Basel, Basel, Birkhäuser Basel, Basel, 2007.
[32] R. K. Pelham and Y l. Wang. Cell Locomotion and Focal Adhesions Are Regulated by the Mechanical Properties of the Substrate. Bio Bull, 194(3):348, 1998.
[33] A. J. Davies. The finite element method: An introduction with partial differential equations. Oxford University Press, Oxford, 2011.
[34] J. P. Winer, S. Oake, and P. A. Janmey. Non-Linear Elasticity of Extra-cellular Matrices Enables Contractile Cells to Communicate Local Position and Orientation. PLoS ONE, 4(7):e6382, 2009.
[35] M. M. Palm and R. M. H. Merks. Vascular networks due to dynamically arrested crystalline ordering of elongated cells. Phys Rev E, 87:012725, 2013.
[36] P. Panorchan, J. P. George, and D. Wirtz. Probing Intercellular Inter-actions between Vascular Endothelial Cadherin Pairs at Single-molecule Resolution and in Living Cells. J Mol Biol, 358:665–674, 2006.
[37] J. P. Califano and C. A. Reinhart-King. Substrate stiffness and cell area predict cellular traction stresses in single cells and cells in contact. Cell Mol Bioeng, 3(1):68–75, 2010.
[38] F. J. Byfield, S. Tikku, G. H. Rothblat, K. J. Gooch, and I. Levitan. OxLDL increases endothelial stiffness, force generation, and network formation. J Lipid Res, 47(4):715–723, 2006.
[39] W. S. Haston, J. M. Shields, and P. C. Wilkinson. The orientation of fibroblasts and neutrophils on elastic substrata extracellular matrices. Exp Cell Res, 146:117–126, 1983.
[41] J. A. Ysasi Belle, R. D. Bennett, N. Filipovic, M. I. Nejad, D. L. Trumper, M. Ackermann, W. Wagner, A. Tsuda, M. A. Konerding, and S. J. Mentzer. Stretch-induced intussuceptive and sprouting angiogenesis in the chick chorioallantoic membrane. Microvasc Res, 95:60–67, 2014.
[42] D. D. Klumpers, T. H. Smit, and D. J. Mooney. The Effect of Growth-Mimicking Continuous Strain on the Early Stages of Skeletal Development in Micromass Culture. PLoS ONE, 10(4):1–11, 2015.
[43] M. Aghvami, V. H. Barocas, and E. A. Sander. Multiscale Mechanical Sim-ulations of Cell Compacted Collagen Gels.J Biomech Eng, 135(7):0710041– 0710049, 2013.
[44] D. K. Schlüter, I. Ramis-Conde, and M. A. J. Chaplain. Computational Modeling of Single-Cell Migration: The Leading Role ofExtracellular Ma-trix Fibers. Biophys. J, 103(6):1141–1151, 2012.
[45] S. Checa, M. K. Rausch, A. Petersen, E. Kuhl, and G. N. Duda. The emergence of extracellular matrix mechanics and cell traction forces as important regulators of cellular self-organization. Biomech Model Mechan., 14(1):1–13, 2014.
[46] P. J. Albert and U. S. Schwarz. Dynamics of Cell Shape and Forces on Micropatterned Substrates Predicted by a Cellular Potts Model. Biophys. J, 106(11):2340–2352, 2014.
[47] P. J. Albert and U. S. Schwarz. Dynamics of cell ensembles on adhesive micropatterns: Bridging the gap between single cell spreading and collective cell migration. PLoS Comput Biol, 12(4):1–34, 2016.
[48] D. Kong, B. Ji, and L. Dai. Stability of adhesion clusters and cell reorien-tation under lateral cyclic tension. Biophys. J, 95(8):4034–4044, 2008. [49] Y. Zhong, D. Kong, L. Dai, and B. Ji. Frequency-Dependent Focal Adhesion
Instability and Cell Reorientation Under Cyclic Substrate Stretching. Cell Mol Bioeng., 4(3):442–456, 2011.
[50] J. P. Califano and C. A. Reinhart-King. A Balance of Substrate Mechanics and Matrix Chemistry Regulates Endothelial Cell Network Assembly. Cell Mol Bioeng., 1(2):122–132, 2008.
[51] J. E. Bresenham. Algorithm for computer control of a digital plotter. IBM Syst J, 4(1):25–30, 1965.
1
Supporting Figures and Tables
Figure S1: Traction forces for non-convex cell shapes (A) Cell traction forces towards center of mass (van Oers et al. [28]); (B) Cell shape 50 MCS after initial configuration in (A) with λstrain = 50; (C) FMA model [29]; (D) Cell
shape 50 MCS after initial configuration in (C) withλstrain= 50; (A-C) length
Figure S2: (A) Distribution of eccentricities of cells on substrate stretched along 0◦, plotted are the eccentricities of cells during 500 MCS and 100 simulations; (B) Cell orientation as a function of matrix stiffness at 500 MCS; averaged over
n= 100 simulations; error bars: standard deviations. Color coding (A-B): red: non-contractile cells; green: contractile cells; (C) Example of cell shape in which the middle part is much more slender.
Figure S5: (A) Contractile cells on substrate stretched along 0◦ at 3000 MCS simulated with various values of Eθ and st; (B) graph of h(E()) = 1/(1 +
exp(−β(E()−Eθ))); (C) zoom in of cell configuration ofEθ= 5000,st= 0.05;
(D) zoom in of cell configuration of Eθ = 10000,st = 0.1 (E) zoom in of cell
configuration of Eθ = 15000,st = 0.4 Colors A,(C-E): normalized stiffness,
defined as: EE()
θ =
E0 Eθ(1 +
st); orientation and length of black line pieces:
Figure S6: Contractile cells on substrate stretched along 0◦ at 3000 MCS sim-ulated with various values of cell traction force and matrix stretching force; Colors: normalized stiffness, defined as: EE()
θ =
E0 Eθ(1 +
st); orientation and
Figure S7: Contractile cells on substrate stretched along 0◦ at 3000 MCS with cell density d = 0.5. (A) Original model; (B) corresponding cell orientations; (C) Model with ∆Hretraction
strain =−0.5∆Hstrainextension; (D) corresponding cell orien-tations; (E) Model with ∆Hretraction
Figure S8: Time series of orientational order parameter, averaged over n= 25
simulations; color coding: red: r=40 for non-contractile cells, orange: r=600 for non-contractile cells, green: r=40 for contractile cells, dark-green: r=600 for contractile cells. (A) Model with ∆Hstrainretraction =−0.5∆Hstrainextension ; (B) Model with ∆Hretraction
strain = −0.5∆H
extension
strain ; Contractile cells on substrate stretched along 0◦ at 3000 MCS. (C) Model with ∆Hretraction
strain =−0.5∆H
extension strain ; (D) Model with∆Hretraction
Parameter symbol Description value units
∆x width of lattice site 2.5 µm
A target area 50 lattice sites
Jcc cell-cell contact energy 3.75
-Jcm cell-medium contact energy 1.875
-λ strength of volume constraint 250
-λstrain strength of cell response to strain 24
-T cellular temperature 5
-µ cell traction per unit length 0.0025 nNµm−1
E0 Young’s modulus 12 kPa
υ Poisson’s ratio 0.45
-τ substrate thickness 10 µm
Eθ threshold for stiffness sensitivity 15 kPa
β steepness of stiffness sensitivity 0.5 kPa−1
st strain stiffening parameter 0.1
-σstretch uniaxial stretch 1000 N/m2
d cell density 0.15 ##{~{~xx::σσ((x~~x)=0)>0}}
r radius for calculating order parameter 100/1500 µm
Table S1: Parameters.
2
Alignment quantification details
2.1
Cell elongation and orientation
To quantify cell elongation and orientation, we used the inertia tensor I of a cellσ:
I(σ) =
P
~
x∈C(σ)(x2−C2(σ))
2 −P
~
x∈C(σ)(x1−C1(σ))(x2−C2(σ))
−P
~
x∈C(σ)(x1−C1(σ))(x2−C2(σ)) P~x∈C(σ)(x1−C1(σ))2
! .
(7) Here, C(σ, t), is the center of mass of cellσat MCS (time)t, given by
C(σ, t) = 1
|C(σ, t)|
X
~ x∈C(σ,t)
~x, (8)
withC(σ, t), the set of coordinates of the lattice sites occupied by cellσat MCS
t.
Cell elongation is quantified by the eccentricity ξ of a cell, given by ξ(σ) =
r
1−e1(I(σ)) e2(I(σ))
2
condition example aligned? case 1 θ1, θ2, θ3<90 no
case 2 θ3≥90 yes
case 3 90< θ2<135 no
case 4 θ2≥135 yes
Table S2: Determination of paired cell alignment
2.2
Orientational order
For the orientational order parameterS(r)we calculatedθ(~x, r): the angle be-tween the direction of the long axis~v(σ(~x))of the cell at~x, and a local direction
~
n, which is the weighted local average of cell orientations, taken within a radius
r around~x, such that ~n(~x, r) = h~v(σ(~y))i{~y∈Z:|~x−~y|<r}. The orientational or-der parameter is then defined asS(r) =Dcos 2θ(X~(σ), r)E
σ where
~
X(σ)is the
center of mass of cellσ.
2.3
String orientation
To determine the orientation of strings (or cell aggregates), we first find the connected components of the cell pattern, by applying morphological closing on the pattern [52], using a line of five lattice sites with an angle equal to the stretch orientation. We then took the connected components larger than 300 lattice sites and determined the average orientation of those. Aggregate orientations were calculated in the same way as the orientation of a single cell, by using the inertia tensor.
3
Model details
3.1
Cell traction forces
In the FMA model [29], the force F~i acting on node~ni of a cell is determined
by
~ Fi=µ
X
~ nj
|~ni−~nj|, (9)
where the sum is over nodes ~nj in the same cell of which the straight line
in nNµm−1. To determine whether a line between nodes stays within the cell, one needs to know which lattice sites this line crosses. The Bresenham algorithm [51] is used for this purpose. Now lets(~n, ~n1)be the lattice sites that the line
l(~n, ~n1) between node ~n = (nx, ny) and node n~1 = (n1x, n1y)crosses. In order
to be consistent, we impose that s(−n~1, ~n) =s(~n, ~n1) mirrored vertically and turned 180◦clockwise, so that~npulls onn~1if and only ifn~1pulls on~n. In order to prevent a bias in either45◦or−45◦, we impose thats(~n, ~n
1) =s(~n,(n1x,−n1y))
mirrored horizontally. The resulting lattice sites are shown in an example in Figure S9.
Figure S9: The lattice sites s1 that the line l1 from node n to n1 crosses is determined using the Bresenham line algorithm. The lattice sites s2, s3, s4 cor-responding to linesl2, l3, l4from nodento noden2, n3, n4are such thats4=s1 mirrored horizontally, s3 = s1 mirrored vertically and turned 180◦ clockwise ands2=s3 mirrored horizontally.
3.2
Cellular responses to local strains
In the calculation of the response of the CPM to the local strains in the substrate, we previously used the strain in the target site when a cell was extending and the strain in the source site was used when a cell was retracting. We changed this assumption to make cell behavior more compatible with focal adhesion dynamics on strained tissues. For an extending cell, i.e. when σ(~x) >0, the strain in the target site promotes the maturation of a focal adhesion in the protrusion. When a cell is retracting, i.e. σ(~x0)>0, it costs a lot of energy to unbind a matured focal adhesion from the target site.
In our current model formulation [28] cells perceive an increase in matrix stiffness as a result of compressive ( <0) and extension strains ( >0), while in our original model this was only implemented for extensions strains. This was adapted to avoid a directional bias of cell elongation in ±45◦, see next section.
3.3
Single cell orientation in the absence of uniaxial stretch
A bias in the angle of cell orientations can occur as a result of the square lattice. In Van Oers et al. [28], forces were pointed towards the center of mass (Figure S1A). With this model, a small bias in cell elongation oriented along
let cells perceive strain stiffening as a result of negative strains, i.e. compression, the bias is reduced. This is shown in Figure S10 A and B, in which we plot the orientation of cells on a unstretched matrix with stretch stiffening only and stretch and compression stiffening, respectively. With stretch and compression stiffening, cells are still able to elongate, as a Poisson ratio ν <0.5 makes sure that stretch strains are higher than compression strains, so cells protrude more preferably towards stretch strains and can thus promote elongation. It is not completely clear to us why the inclusion of compressions stiffening reduces the orientational bias: we found this bias effect by investigating the Hamiltonian for spin copies: with strain stiffening for stretch only, diagonal spin copies gave a higher dHmechanotaxis. We discovered that the FMA model (in which nodes only pull on other nodes if they are connected by a straight line within a cell [29]) is another origin for a cell orientation bias, but now along0◦ and90◦. We
suspect a reason for this, which is illustrated in Figure S11. Our reasoning is as follows. A cell that only experiences contact energy (surface tension) and an area constraint, will obtain a round shape. A cell that elongates wants to stay as round as possible and thus prefers to obtain an ellipse shape. Here we show that an ellipse shaped cell with an orientation of0◦ has a wider tip than an ellipse orientated along45◦, because of the 2D grid. A wider tip makes the nodes able to pull on more other nodes, causing more highly strained lattice sites and thus more extensions along 0◦. By increasing the cellular temperatureT, this bias can sufficiently be reduced. This is shown in Figure S10 C and D, in which we plot the orientation of cells on a unstretched matrix with the FMA model for cell temperatureT = 1andT = 5, respectively. Because cells elongate with slightly different parameters for the model with the FMA model compared to previous work ([28]), we changed some parameter values with respect to our original work [28]. So, in the analysis on cell orientation presented here, we used our previous parameter as in [28]: Jcc = 1.25, Jcm = 0.625, λ = 500, λstrain = 20, T = 1.
Figure S10: Cell orientations, one contractile cell on a unstretched substrate, 500 simulations and 500 MCS are plotted. (A) Forces pointed towards center of mass (Van Oers et al. [28]), no compression stiffening andT = 1; (B) Forces pointed towards center of mass (Van Oers et al. [28]), compression stiffening and T = 1; (C) FMA model [29], compression stiffening andT = 1; (D) FMA model [29], compression stiffening andT = 5.
![Figure 1: Structure of the coupled CPM-FEM model. (A) CPM calculates cell shapes in response to local ECM strains; (B) calculation of cellular traction forces based on cell shapes [29]; (C) substrate strains due to cellular traction forces.](https://thumb-us.123doks.com/thumbv2/123dok_us/8143386.2159756/4.892.278.612.255.533/structure-calculates-response-calculation-cellular-traction-substrate-cellular.webp)