Simultaneous existence of defects and mesopores in nanosized ZSM-5 zeolite studied
by positron annihilation and X-ray diffraction spectroscopies
L. Anh Tuyen, N. Quang Hung, L. Chi Cuong, D. Duy Khiem, P. Trong Phuc, L. Ly Nguyen, N. T. Ngoc Hue, P. Thi Hue, and D. Van Phuc
Citation: Journal of Applied Physics 121, 084303 (2017); doi: 10.1063/1.4977013
View online: http://dx.doi.org/10.1063/1.4977013
View Table of Contents: http://aip.scitation.org/toc/jap/121/8
Simultaneous existence of defects and mesopores in nanosized ZSM-5
zeolite studied by positron annihilation and X-ray diffraction spectroscopies
L.Anh Tuyen,1,2,a)N.Quang Hung,3,b)L.Chi Cuong,4D.Duy Khiem,1P.Trong Phuc,1 L.Ly Nguyen,1N. T.Ngoc Hue,1,2P.Thi Hue,1and D.Van Phuc5
1
Center for Nuclear Techniques, Vietnam Atomic Energy Institute, 217 Nguyen Trai, District 1, Ho Chi Minh City, Vietnam
2
Ho Chi Minh University of Science, 227 Nguyen Van Cu, District 5, Ho Chi Minh City, Vietnam
3
Institute of Research and Development, Duy Tan University, K7/25 Quang Trung, Danang, Vietnam
4
University of Technical Education, 1 Vo Van Ngan, Thu Duc District, Ho Chi Minh City, Vietnam
5
Dong Nai University, 4 Le Quy Don, Bien Hoa, Vietnam
(Received 1 December 2016; accepted 8 February 2017; published online 24 February 2017)
Crystallization, formation, and accumulation of defects and mesopores in the ZSM-5 zeolite samples, which are synthesized from the gel composition of 1.2Na2O 0.1Al2O3 0.8
tetra-propylammonium hydroxide (TPAOH) 6SiO2400H2O at a temperature of 140 degree Celsius (C)
in 10, 15, and 18 h, are studied by using the Positron annihilation lifetime (PALS) and X-ray dif-fraction (XRD) spectroscopies. The XRD is used for investigating the crystalline concentration and nano-crystal size of ZSM-5 during the crystallizing process, whereas the PALS is performed in order to determine the presence of templates, defects, and mesopores in the zeolite samples. The latter are calcined in air during 1, 2, and 3 h at a temperature of 600C before being measured. The results obtained indicate that there exist clusters of small crystals in the early crystalline stages of the samples. The size of these crystals increases with time and reaches approximately 100 nm after 18 h of reaction. In addition, the template (TPAOH) is found to exist not only in the channels inside the framework but also in the mesopores outside it. Finally, by analyzing the Positron lifetime spec-tra, we have found for the first time the simultaneous existence of defects and mesopores, which are formatted and accumulated during the crystallization of ZSM-5. Those important results con-tribute significantly to our understanding of the internal structure of the synthetic zeolite ZSM-5 as well as the synthetic processes for producing zeolites with special features. Published by AIP Publishing.[http://dx.doi.org/10.1063/1.4977013]
I. INTRODUCTION
Zeolites are crystalline materials, which contain the nanosized pores such as channels and cavities. Due to their unique chemical and physical properties, microporous zeo-lites such as X, Y, ZSM-5, etc., have been used in many fields such as catalysis, adsorption, ion exchange, molecular sieving, semiconductor, etc.1In particular, microporous zeo-lites have been considered as one of the potential materials for heat storage in the energy storage systems.2In the most common applications of zeolites, in addition to their charac-teristic physical and chemical properties, crystal size, tem-plates, structural defects, and mesopores, which are concurrently formed during the synthetic process, play a very important role due to their significant influence on the water transport and bulkier molecular diffusion.2–6To iden-tify the structural defects, which include silanols, defects generated by missing the tetrahedral framework atoms or external surface as well as siloxy defects and crystal size, the conventional methods such as nuclear magnetic reso-nance, high-resolution electron microscopy, etc., and other chemical and physical methods are widely used,3–5whereas the physisorption and electron microscopy methods are often
employed in the study of the templates and mesopores in zeolites.7 However, the limitation of these methods is that they are unable to provide a clear explanation of the recipro-cally complex influences of the defects and mesopores on the observed results. More advanced methods should be therefore deeply considered.
In fact, the X-ray diffraction spectroscopy (XRD) has been widely employed in the study of the crystalline struc-ture as well as the different characteristics of the zeolite materials.8In this case, the concentration or size of the crys-tals in zeolites can be identified via the observation of the diffraction patterns and the single diffraction peaks of the XRD. However, in order to completely understand the com-plex characteristics and properties of zeolites such as crystal-line matrix, open and free volumes, defects, channel systems, and micro and meso voids/pores formed during the synthetic processes, it is required to combine the XRD with other advanced methods. Meanwhile, the positron annihila-tion lifetime spectroscopy (PALS) has recently become one of the most popular methods for investigating the structure of the solid materials9 due to its sensitivity in probing the special properties and imperfect structures of the material. Within the PALS, positron is trapped in the low-electron density region of the solids, which contains the interstitial sites, defects, free volumes and mesopores, etc. In the bulk solids, the interacting positron-electron pairs can be
a)Electronic mail: [email protected] b)Electronic mail: [email protected]
developed into Positronium, which include para-Positronium (p-Ps) and ortho-Positronium (o-Ps), at the surface of the open sites. Consequently, the o-Ps is rapidly trapped thereaf-ter in open spaces inside the solid matrix and being decayed therein. In addition, the inhomogeneous regions and grain boundaries may also act as the o-Ps traps.
While zeolites contain well defined open spaces, chan-nels, and cages, their defected sites and mesopores might be formed during the synthetic process resulting in a number of localized o-Ps states and long-living o-Ps components. The lifetime of the localized o-Ps is sensitive to the size of the trap, that is, the larger the trap is, the longer lifetime the localized o-Ps has. Hence, an extensively used quantitative expression for describing the correlation between the o-Ps lifetimesand the radius of the presumably spherical voids/ poresRwas developed in Refs.10and11. This equation has been later modified to take into account the non-spherical shapes and larger spherical pores.12–14These modified equa-tions provide a unique method for determining the free vol-ume size of zeolite in the range of 0.1–13 nm.
Very recently, the positron lifetime spectroscopy has been used for studying the detemplation of the ZSM-5 zeo-lite, whose mechanism is investigated based on the analysis of the lifetimes and annihilation intensities of the micropores and mesopores.15It is found in this paper that the lifetimes of the micropores and mesopores are, respectively, 1–15 ns and 15–100 ns. However, the accumulation of defects and mesopores has not yet been investigated in this Ref.15.
The goal of the present work is to apply the positron annihilation lifetime spectroscopy in combination with the X-ray diffraction spectroscopy in order to investigate the structure of the zeolite ZSM-5 synthesized at different times and temperatures. This combination enables us to study for the first time the special structures and properties of ZSM-5 such as crystalline concentration, crystal size, formation, and accumulation of the defects as well as the mesopores during its synthetic process.
II. MATERIALS AND METHODS
A. Sample preparation
The zeolite ZSM-5 samples are synthesized from the gel of 1.2Na2O 0.1Al2O3 0.8 tetra-propylammonium hydroxide
(TPAOH) 6SiO2 400H2O by mixing a decomposition of
sodium hydroxide (NaOH, Sigma Aldrich), fumed silica (SiO2 98%, Merck) solution, sodium aluminate (NaAlO2,
Sigma Aldrich), and tetra-propylammonium hydroxide sol-vent (TPAOH, AppliChem). This gel mixture is then stirred by using a magnetic stir plate in approximately fifteen minutes. Before the crystallization, the aging process is applied for the gel mixture at 80C during 15 h. The crys-tallization process is performed in the hydrothermal envi-ronment at 140C in 10 h (for Z-10), 15 h (for Z-15), and 18 h (for Z-18). In this process, the gel mixture is contained in the autoclaves in order to maintain the reaction condi-tions during the crystallization time. The samples after being made are then separated into two sets. The first set contains the dried (uncalcined) samples, whereas the sec-ond set includes the calcined ones. The latter are calcined
at 600C in 1, 2, and 3 h in order to completely remove the template compound.
B. Experimental methods
The experiments are performed on the disk-shaped sam-ples with a dimension of 10 mm diameter and 1.5 mm thick-ness. These samples are made by pressing the zeolite ZSM-5 powder under 0.3 GPa. The XRD measurements are per-formed based on the PANalytical X’Pert (Panalytical) instru-ment using a X-ray tube of Cu having a wavelength of 1.54056 A˚ and a Ni filter. The resolution (broadening) of the instrumental intensity as a function of the diffraction angleh is investigated using the standard silicon powder.16 The XRD data are observed in a range of 2h, whose values vary from 10 to 70. The relative XRD crystallinity is deter-mined by comparing the sum of the peak intensities between 13 and 55 of 2hwith that obtained from the commercial sample.17The average size of the crystalline particles is cal-culated based on the Scherrer equation at the diffraction peaks, which are approximately equal to 13.12, 22.9, and 44.9. In this equation, the full width at half maximum (FWHM) intensity of the diffraction peaks after subtracting the instrumental broadening must be determined in advance.16In the positron annihilation experiments, the22Na radioactive source, which has an activity of approximately 2.0 MBq and is fully covered by the two thin and small alu-minium foils to achieve an activated region of 1 1 mm2 total area, is placed in sandwich with the two disk-shaped samples of zeolite.
The experimental measurements are carried out in the vacuum condition for the zeolite samples after being treated by heat at 300C (in the same vacuum condition) in order to completely separate water from them. The positron lifetime (LT) measurements are then performed based on the fast-fast coincidence setup with the time resolution of 220 ps at the FWHM. The LT spectra are recorded in a Microfast 16k PC MCA with the integral counts of 3 106for the LT. The measured data are analyzed by using the LT v.9 program with a source correction of approximately 10%, which accounts for the annihilation in the salt NaCl as well as in the aluminum foils.
III. RESULTS AND DISCUSSIONS
A. Crystallization of ZSM-5
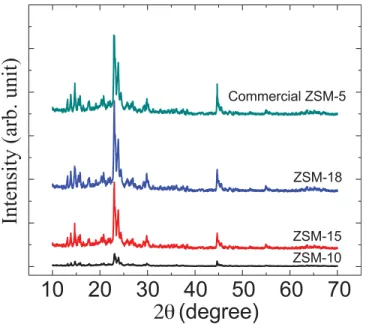
Figure 1shows the measured X-ray diffraction spectra of the Z-10, Z-15, and Z-18 samples together with the com-mercial ZSM-5 one. It is clear to see from this Fig. 1 that among the three samples, Z-18 has the largest diffraction intensity as its crystallization time is the longest one (18 h). It is also easy to see from this figure that in each sample there appears three single peaks at almost the same positions of 2h, namely, at 13.12, 22.9, and 44.9. These peaks are then used to determine the crystal size of the samples by using the Scherer equation.17The average crystal sizes and the relative crystal concentrations of three samples are shown in TableI. The relative crystal concentrations over time are determined from the ratio of the total intensity obtained from the
diffraction patterns of the synthetic samples to that of the commercial ones.16 The crystal concentration is seen to increase significantly from only 18% after 10 h as in Z-10 to 86% after 15 h as in Z-15 and reach almost 98% after 18 h as in Z-18. The average size of the crystals also increases from 33 nm to 112 nm in the same period of time.
To have more visible views on the internal structure of the zeolite samples, we show in Fig.2the SEM (Scanning Electron Microscope) images of the Z-10 [Fig. 2(a)] and Z-18 [Fig.2(b)] samples. These images clearly show that in Z-10, the gel mixture predominates in this sample due to its too low crystal concentration, whereas in Z-18, many uni-form particles, each of which has a relative size of approxi-mately 100 nm, are seen. The size of the uniform particles formed in the Z-18 sample is consistent with the calculation of the X-ray diffraction data. Moreover, the SEM image of
the Z-18 sample also shows a small amount of the gel par-ticles (amorphous phase) remaining on the surface of the crystals (2%). Thus, there is a good agreement between the diffraction analysis and the SEM images.
Here, it is able to confirm that with the synthetic condi-tions (temperatures of 140C and the presence of the TPAOH templates) applied to the present work, the frame-work structure of the ZSM-5 zeolite is gradually formed at the early stage of the synthetic process but it reaches only a small size after 10 h. After 15 h, the size of this framework structure increases to over tens of nanometers and reaches 100 nm at the end of the crystalline reaction (after 18 h).
B. Template in the pore structures
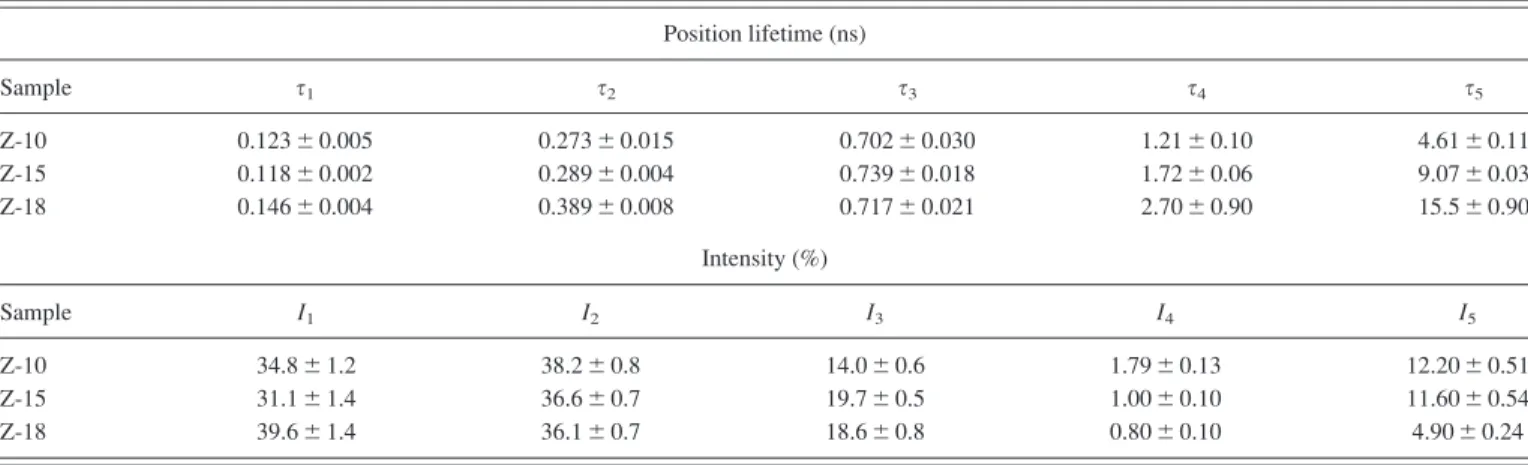
The templates such as the TPAOH are very common compounds in the synthesis of the Si-rich zeolite. Their roles are very important for the initial crystalline reactions, which form crystals with the determined framework structures. After the synthetic processes, the templates are predicted to reside in the system containing the micropores such as chan-nels and cages.18,19 Normally, the templates must be sepa-rated from the products as the impurities of zeolite. This process can be done by centrifuging the samples using dis-tilled water and carrying out the high temperature calcina-tions after that.19In addition to the above treatment, the heat treatment and the purity level of the templates can also affect the quality of the products, and they must therefore be con-trolled. In the present work, the removal of the TPAOH tem-plates from ZSM-5 via the heat treatment is studied by the LT measurements. The LT spectra of the samples before and after the heat treatment are shown in Fig. 3. For the data analysis, three and four component fittings have been widely applied to all LT spectra. However, both those fittings are not able to describe a higher number of annihilation states of positron and positronium in the ZSM-5 zeolite. In earlier studies in Refs. 20and21, we have pointed out that instead of three or four component fittings, the fitting with the five components is the most suitable for some zeolites having mesopores such as the Silicalite-1 (Mordenite Framework Inverted (MFI) structure is the same as ZSM-5) and 4A zeo-lites. Therefore, within the present work, the measured LT spectra are analyzed based on five lifetime components cor-responding to different annihilation states, whose explicit values are presented in TablesIIandIII.
FIG. 1. X-ray diffraction spectra of the commercial ZSM-5, Z-10, Z-15, and Z-18 zeolite samples.
TABLE I. Average crystal sizes and crystal concentrations of the zeolite samples measured by the XRD.
Sample Average crystal size (nm) Crystal concentration (%)
Z-10 33.261.9 17.963.1
Z-15 91.366.1 86.465.2
Z-18 112.166.3 98.269.1
In Table IIfor the uncalcined samples, the shortest life-time componentss1(0.118–0.146 ns) are known to come from
the annihilation of the free positrons in combination with that of the p-Ps.20–22 The second lifetime s2 (0.273–0.389 ns)
appears as a new component because its value has not been previously reported for the conventional ZSM-5 zeolites, whoses2values are normally in the range of 0.5–0.7 ns (see,
e.g., Refs.22–24). As a result, there seems to be no crystallo-graphic free space of ZSM-5, which corresponds with these small values ofs2. Meanwhile, it has been indicated in several
studies of the defects in the porous SiO2using the PALS that
the positron lifetime in the defects as vacancies should be always higher than that in the perfect lattice (free annihilation component of positron) due to the lower density of electrons in the defects.25,26In fact, the value ofs2obtained within the
present work agrees with that reported in Ref. 25 (about 0.3 ns) for the monovacancies in the crystalline and amor-phous SiO2materials. This agreement could be easily
under-stood because our ZSM-5 samples contain a rich amount of Si and hence theirs2components probably come from the
posi-trons annihilated in defected sites, which are not evidenced and expected by other methods. The thirds3(0.702–0.717 ns)
components of the positron lifetime relate to molecular com-plexes of ZSM-5,20–22 whereas the fourth s4 (1.21–2.70 ns)
and the fifth (the longest) s5 (4.61–15.5 ns) ones are,
respectively, caused by the annihilation of the o-Ps in the sys-tem channels and in the mesopores of ZSM-5.20,22 These results are similar to those reported in Refs.22–24, except the fifth s5 component. The values of s5 found in those Refs.
22–24 are in a range of 30–50 ns, which are significantly higher than our data. This difference might be due to the exis-tence of the templates as well as the differences in the size of the mesopores that appeared in the different samples, which are used in our and their experiments.
Nevertheless, for the synthetic samples (uncalcined), in addition to the information related to the structural defects characterized by s2, the lifetime components s4 and s5 are
the most interested ones because of their relation with the templates in the pore channels as well as the size of the mes-opores (the lifetime componentss1ands3will be not
consid-ered). In comparison with the results reported in Refs. 22–24, boths4ands5obtained for the synthetic samples are
significantly lower. As described in Sec.II B, all the samples before being measured were heated at 300C in 10 h in vac-uum in order to remove all the moisture (water) from them, which could affect the positron lifetime. Thus, the existence of the templates in the pore channels and the mesopores of ZSM-5,23which could not be detected by the X-ray diffrac-tion methods, can cause the quenching of the o-Ps lifetime and lead to a significant reduction ofs4ands5.
FIG. 3. Positron lifetime spectra of the uncalcined (a) and calcined (b) samples.
TABLE II. Components of the positron lifetime and their corresponding annihilation probabilities (the so-called annihilation intensities) of the uncalcined samples.
Position lifetime (ns)
Sample s1 s2 s3 s4 s5
Z-10 0.12360.005 0.27360.015 0.70260.030 1.2160.10 4.6160.11
Z-15 0.11860.002 0.28960.004 0.73960.018 1.7260.06 9.0760.03
Z-18 0.14660.004 0.38960.008 0.71760.021 2.7060.90 15.560.90
Intensity (%)
Sample I1 I2 I3 I4 I5
Z-10 34.861.2 38.260.8 14.060.6 1.7960.13 12.2060.51
Z-15 31.161.4 36.660.7 19.760.5 1.0060.10 11.6060.54
Z-18 39.661.4 36.160.7 18.660.8 0.8060.10 4.9060.24
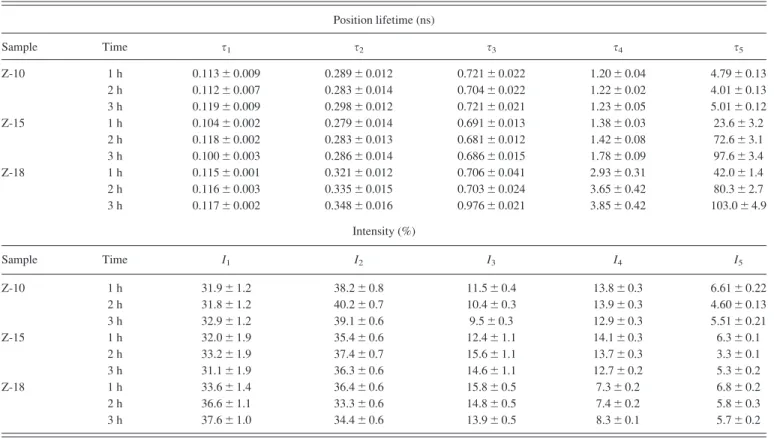
In order to see the influence of the calcination process on the removal of the templates from the pore structures, we carry out the LT measurements for the second set of the ZSM-5 samples mentioned in Sec. II A, and the results are shown in TableIII. As has been pointed out in Refs.18,19, and23 that template in zeolite is a compound that will be decomposed under a temperature of about 550C and many hours of heat treatment. Therefore, in the present experi-ments, we choose to apply a temperature of 600C, which is higher than that mentioned in Refs.18,19, and23, with the aim of increasing the efficiency as well as reducing the time
of the heat treatment but still maintaining the crystal structure.
Shown in Fig.4are the lifetime componentss4ands5
together with their corresponding annihilation intensities I4
andI5obtained at 600C and different calcined timest¼0,
1, 2, and 3 h. The results shown in this Fig.4are quite inter-esting since in the Z-15 and Z-18 samples, both s4and s5
change with the heat treatment time twith different behav-iors. For the Z-10 sample whose relative crystal concentra-tion is 18%, the influence of the temperature and the calcined time on boths4ands5is almost insignificant. The TABLE III. Components of the positron lifetime and intensity of the samples calcined at 600C in 1, 2, and 3 h.
Position lifetime (ns)
Sample Time s1 s2 s3 s4 s5
Z-10 1 h 0.11360.009 0.28960.012 0.72160.022 1.2060.04 4.7960.13
2 h 0.11260.007 0.28360.014 0.70460.022 1.2260.02 4.0160.13
3 h 0.11960.009 0.29860.012 0.72160.021 1.2360.05 5.0160.12
Z-15 1 h 0.10460.002 0.27960.014 0.69160.013 1.3860.03 23.663.2
2 h 0.11860.002 0.28360.013 0.68160.012 1.4260.08 72.663.1
3 h 0.10060.003 0.28660.014 0.68660.015 1.7860.09 97.663.4
Z-18 1 h 0.11560.001 0.32160.012 0.70660.041 2.9360.31 42.061.4
2 h 0.11660.003 0.33560.015 0.70360.024 3.6560.42 80.362.7
3 h 0.11760.002 0.34860.016 0.97660.021 3.8560.42 103.064.9
Intensity (%)
Sample Time I1 I2 I3 I4 I5
Z-10 1 h 31.961.2 38.260.8 11.560.4 13.860.3 6.6160.22
2 h 31.861.2 40.260.7 10.460.3 13.960.3 4.6060.13
3 h 32.961.2 39.160.6 9.560.3 12.960.3 5.5160.21
Z-15 1 h 32.061.9 35.460.6 12.461.1 14.160.3 6.360.1
2 h 33.261.9 37.460.7 15.661.1 13.760.3 3.360.1
3 h 31.161.9 36.360.6 14.661.1 12.760.2 5.360.2
Z-18 1 h 33.661.4 36.460.6 15.860.5 7.360.2 6.860.2
2 h 36.661.1 33.360.6 14.860.5 7.460.2 5.860.3
3 h 37.661.0 34.460.6 13.960.5 8.360.1 5.760.2
reason is that Z-10 contains the main ingredients of the gel. Hence, the TPAOH template clusters are surrounded and fully covered by the amorphous phases of the gel and they are therefore hardly decomposed by heat. Consequently, the heat treatment process does not have a significant effect on s4ands5. In the case of Z-15 (the relative crystal
concentra-tion is 86%), although the values ofs4are higher than that of
Z-10, this component has only a small change during the heat treatment due to the presence of the remaining amor-phous gel, which covers on the surface of the crystal grains and slows down the decomposition as well as emission pro-cesses of the template from the pore channels. In other words, the 3-h calcined time for this sample may not be enough to completely remove the TPAOH templates from the pore channels of ZSM-5 as the relative crystal concentra-tion reaches only 86% in this case. In contrast to the two samples above, a significant increase ofs4in Z-18 (98% of
the relative crystal concentration) is seen in Fig.4(a). This increase of s4 in Z-18 indicates that the removal of the
TPAOH templates from the pore system by the heat treat-ment can occur more advantageously for the samples with the high relative crystal concentration than those with the low one.
It is also interesting looking at the results ofs5shown in
Fig. 4(c). This figure shows that s5 changes very slightly
with t in Z-10, whereas it increases quickly in Z-15 and reaches approximately 97 ns after t¼3 h. As mentioned above,s5is caused by the annihilation of the o-Ps in the pore
structure outside the framework of ZSM-5. Thus, these results reconfirm the presence of the TPAOH templates not only in the pore channels inside framework but also in the mesopores outside it. Moreover, the quick increase ofs5in
comparison withs4also indicates that the TPAOH templates
in the mesopores can be decomposed and removed from the material faster than in the pore channels. This picture there-fore provides an additional explanation to the slow change of s4and the quick increase ofs5with increasing the calcined
timet.
For the Z-18 sample (98% of the relative crystal concen-tration), Figs.4(a)and4(c)show the rapid increase withtin boths4ands5. More generally,s4ands5in Z-18 can be
con-sidered to be approximately equivalent to the lifetime of the o-Ps in the pore channels and in the vacuum of ZSM-5, respectively.22 Therefore, these results reveal the complete removal of the TPAOH templates in the Z-18 sample after 3 h of heat treatment.
Also due to the heat treatment, the volume of the pore space in zeolite (pore channels and mesopores) regains its real volume, which was occupied by the TPAOH templates. This process leads to the changes in the annihilation proba-bility of the o-Ps in the system of the pore channels and the mesopores as can be seen via the annihilation intensities shown in Figs.4(b)and 4(d). The annihilation intensityI4
in the pore channels of all the samples increases withtand nearly saturates after only 1 h, whereas the annihilation intensityI5in the mesopores always decreases witht. This
phenomenon suggests that the competitive annihilations might occur when the templates are gradually separated from the samples through the heat treatment.22 When the
templates no longer or rarely exist in the channels and the mesopores, the positrons/o-Ps could escape from those pla-ces and be present in the other structural regions before annihilation, leading to the changes in the annihilation probability of the o-Ps in the channels and the mesopores. The o-Ps in this case becomes a “template prober” for the porous materials as zeolite.
C. Defects and mesopores
Some special properties of zeolite such as selective potential of the molecular sieves, adsorption capacity, and catalytic performance related to the presence of the structural defects have been reported recently in Refs.27–29. In addi-tion, the existence of the lattice defects in the binding posi-tions of Si and Al with O such as the vacancies in the structure of ZSM-5 obtained by using the infrared spectrom-eter has also been reported in Ref. 30. Within the positron annihilation method, due to the presence of the structure defects, there should be a component whose lifetime is higher than that of the free positrons. Moreover, the forma-tion of the mesopores outside the framework structure is also interesting for the studies on the change of the water trans-port process and the bulkier molecular diffusion of zeolite.5,7 The positron annihilation method is known as one of the effective methods for determining and evaluating the meso-pores in the porous materials based on the long lifetime com-ponents whose values range between 10 and 100 ns.22 Therefore, the lifetime components s2 and s5, which are
related, respectively, to the defects and the mesopores of zeolite, should be examined in this case.
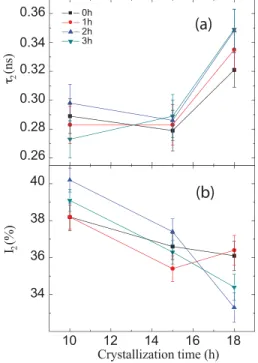
The values of the lifetime components2of the positrons
in the defects at different crystallization and calcined times are shown in Fig.5(a). The results obtained indicate that the
FIG. 5. Lifetime components2(a) and its corresponding annihilation inten-sity I4 (b) of the o-Ps in the defects of the ZSM-5 samples calcined at 600C at different crystallization and calcined times.
lattice defects appear during the formation of the crystals after 10 h and keep nearly unchanged up to 15 h (s20.29 ns). However, after 18 h the crystallization process
is almost completed ands2significantly increases to
approxi-mately 0.35 ns due to the change in the size of the defects. In this case, the defects in ZSM-5 could be not only a kind of point defects (vacancies), which are caused by the loss of the Si or Al atoms, but also the other kind of cracks in the bind-ing of the O atoms created durbind-ing the crystal formation or the heat treatment.31 This phenomenon is quite interesting and important for the future study and control of the defects in zeolites, which have special properties.
The annihilation intensity I2, which relates to the
crys-tallization and heat treatment processes is shown in Fig. 5(b). It is seen that the probability of the positrons annihi-lated in the defects decreases with increasing the crystalliza-tion time. In particular, the data obtained for 3-h heat treatment [the down triangles in Fig. 5(b)] show a linear decrease ofI2with the crystallization time from 39.1% down
to 34.4%. The formation of the lattice defects during the heat treatment and their combination to probably form those with larger size or even the pores, which is very difficult to con-trol, have been pointed out in Ref.31. Thus, the accumula-tion of the defects caused by the heat treatment is quite complex. As a matter of fact, based on the variation ofs2
andI2with the crystallization time shown in Fig.5, this
pro-cess can be fairly explained as follows. The defects were first formed in the crystals during the crystallization of zeolite. After that, due to the heat treatment, the defects such as the vacancies of Si or Al tend to combine with each other to form those with a larger size, leading to the increase ofs2.
At the same time, reduction of the annihilation intensityI2
may be related to the competitive trapping processes with other pore structures when a part or all of the templates are completely removed from the ZSM-5 samples.22
In order to see the formation and the variation of the mesopores with the crystallization and heat treatment times, we show in Fig.6the values of the lifetime component s5
together with its annihilation intensityI5.s5is found to be
increasing quickly with the crystallization time from 5 to 103 ns after 3 h of heat treatment for the Z-18 sample. In the Z-10 and Z-15 samples whose heat treatment times are shorter than in Z-18,s5increases slowly due to the existence
of the templates in the mesopores, which causes the quench-ing of the o-Ps. Therefore, to have a valid information on the formation of the mesopores, the lifetime component of the o-Ps in the samples with high crystal concentration should be considered.
The results obtained for the samples calcined at 600C in 3 h show that after 10 h of the crystallization time, the mesopores had not been formed yet but the micropores had already appeared sinces5has a value of approximately 5 ns
in this case. Using this value ofs5, the radius of the
micro-pores R can be calculated based on the Tao-Eldrup model,10,11whose value is found to be approximately equal to 0.51 nm, which is larger than the size of the pore channels in ZSM-5. R is known to increase to reach the mesoscale (mesopore) if the crystallization time is increasing further. However, the Tao-Eldrup model is applicable forR below
1 nm only. This model therefore needs to be modified in order to apply for the large-sized pores. In Ref. 12, a new model based on the extension of the quantum mechanical model has been developed for calculating the size of the rect-angular pores, whose sides are larger than 1 nm. This model has been later improved in Ref.32to treat any pores and at any temperatures, however, the equation of the o-Ps annihi-lation rate in this model is still complicated. In fact, we have developed recently an empirical formula based on the semi-classical approach for the o-Ps pick-off annihilation rate, which is applicable for the pores having large sizes.14 This formula is quite simple and agrees well with experimental values of the pores whose size can be extended up to 13 nm. Within the present work, the above empirical formula is used for calculating the size of the mesopores in ZSM-5, whose values are found to be approximately 8.03 (9.36) nm after 15 (18) h of the crystallization time as shown in Table IV. The size of the mesopores obtained within the present work is much larger than those reported previously in Refs. 22–24. However, this size agrees well with that reported in Ref.33
FIG. 6. Same as Fig.5but fors5andI5 of the o-Ps in the mesopores of ZSM-5.
TABLE IV. Radius of the mesopores calculated for the calcined samples at 600C in 3 h. No value ofRfor Z-10 is shown in the table because the mes-opores had not yet been formed in this sample.
Sample s5(ns) R(nm)
Z-10 5.060.1 …
Z-15 97.663.4 8.0360.90
for the Silicalite-1 zeolite whose MFI framework structure is the same as that of ZSM-5. Nevertheless, it is worth men-tioning here that the mesopores in fact do not belong to the framework structure of ZSM-5. They are indeed the product of the processes involving a number of reaction conditions set for the crystallization.
In comparison with the lifetime components5, the
anni-hilation probabilityI5of the o-Ps in the mesopores has a
dif-ferent behaviour [Fig.6(b)]. For the uncalcined samples, I5
is almost unchanged after 10 and 15 h of crystallization times, whereas it decreases rapidly from 11.6% to 4.9% when the crystallization time reaches 18 h, which is the end of the crystallization process. This feature ofI5indicates that
the probability of the o-Ps formed in the large mesopores, which are fully occupied by the templates, is lower than that created in the small ones. This phenomenon might be related to the density of the templates in the mesopores having dif-ferent sizes, and it should be investigated in further studies. For the heat-treated samples,I5is found to change slightly
with increasing the crystallization time. In fact, the values of this component are expected to increase significantly with the crystallization time because of the formation of the mes-opores in these samples. Therefore, this slight change of the
I5values suggests that the micropores and mesopores should
be simultaneously formed, and the micropores can be com-bined with each other to form the mesopores with larger volume during the crystallization process. The increase in the volume of the mesopores leads to the increase ofs5but
at the same time, only a slight change ofI5is observed due
to the balance in the number of the o-Ps traps caused by the formation and combination of the pores. In addition, one needs to pay attention to the contribution of the 3c/2cratio to the correction of the annihilation intensities caused by the different detection efficiencies of 3 and 2 gammas when performing the quantitative investigations for the relative concentrations of various kinds of trapping centres.22 This contribution will be studied in detail in our forthcoming works on the same ZSM-5 zeolites but using both the cal-cined and irradiated processes for removing the templates as well as forming the defects.
IV. CONCLUSIONS
This work investigates the structure of the zeolite ZSM-5 synthesized at different times and temperatures by using the positron lifetime together with the X-ray diffraction spec-troscopies. Based on the obtained results, the following con-clusions are made
• The crystallization of ZSM-5 is closely related to the
reac-tion time at the temperature of 140C. Initially, the size of the crystals formed during this process is rather small. Their size increases gradually to reach approximately 100 nm at the end of the process. At the same time, the rel-ative crystal concentration of ZSM-5 strongly depends on the crystallization time and approaches about 98% after 18 h of reaction.
• The presence of the TPAOH template in ZSM-5 can be
detected only if the positron annihilation measurements are used, whereas it is inaccessible if the X-ray diffraction
and SEM methods are employed. This template is found to exist not only in the micropore channel system but also in the mesopores of ZSM-5 after the synthesis. In addition, by applying the heat treatment at 600C in 3 h to the zeo-lite samples, the TPAOH template can be entirely removed from the ZSM-5 samples having the highest rela-tive crystal concentration (about 98%).
• The formation of the defects can start to occur at the initial
stage of the crystallization reaction. After that the created defects can be transformed from the vacancies to those with a larger size. Together with the formation of the defects, the micropores are also formed during the crystal-lization. These micropores are then combined with each other to form the mesopores until the crystalline reaction is completed. It is found that the size of the created meso-pores, which is estimated based on an empirical formula, changes during the crystallization and might be involved in a number of synthesis conditions during the reaction process. The size of the mesopores obtained within this work is much larger than the values reported previously. This difference will be investigated in our forthcoming study.
1
R. M. Barrer, Zeolites and Clay Minerals as Sorbents and Molecular Seives(Academic Press, London, New York, 1978).
2M. Fasano, A. Bevilacqua, E. Chiavazzo, and P. Asinari, in ASME-ATI-UIT 2015, Napoli, 17–20 May (2015), pp. 1–6.
3
D. Eddy, G. Julien, M. Svetlana, and F. Christian,Chem. Mater.27, 7577 (2015).
4
H. Thomas, R. Rishi, C. M. Shalabh, L. Tahar, and N. W. Evelyn, Langmuir30, 6446 (2014).
5
A. Corma,Chem. Rev.97, 2373 (1997). 6
X. Zhaoteng, M. Jinghong, H. Wenming, B. Xiang, K. Yuhong, L. Jianhong, and L. Ruifeng,J. Mater. Chem.22, 2532 (2012).
7
S. V. Donk, A. H. Janssen, J. H. Bitter, and K. P. Jong,Catal. Rev.45, 297 (2003).
8Z. Pilter, S. Szabo, M. Hasznos-Nezdei, and E. Pallai-Varsanyi, Microporous Mesoporous Mater.40, 257 (2000); R. Goyal, A. N. Fitch, and H. Jobic,J. Phys. Chem. B104, 2878 (2000).
9
Y. Ito and T. Takano, Appl. Phys. A 45, 193 (1998); J. Wiktor, X. Kerbiriou, G. Jomard, S. Esnouf, M. Barthe, and M. Bertolus,Phys. Rev. B89, 155203 (2014); A. Zubiaga, R. Warringham, M. Boltz, D. Cooke, P. Crivelli, D. Gidley, J. Perez-Ramirez, and S. Mitchell,Phys. Chem. Chem. Phys. 18, 9211 (2016); R. Warringham, L. Gerchow, A. Zubiaga, D. Cooke, P. Crivelli, S. Mitchell, and J. Perez-Ramirez,J. Phys. Chem. C
120, 25151 (2016). 10
S. J. Tao,J. Chem. Phys.56, 5499 (1972).
11M. Eldrup, D. Lightbody, and J. N. Sherwood,Chem. Phys.63, 51 (1981). 12D. W. Gidley, W. E. Frieze, T. L. Dull, A. F. Yee, E. T. Ryan, and H. M.
Ho,Phys. Rev. B60, 5157 (1999).
13T. Goworek, B. Jasinska, J. Wawryszczuk, K. Ciesielski, and J. Goworek, Stud. Surf. Sci. Catal.128, 557 (2000).
14
N. D. Thanh, T. Q. Dung, L. A. Tuyen, and K. T. Tuan, Int. J. Nucl. Energy Sci. Technol.4, 81 (2008).
15
R. Warringham, L. Gerchow, A. Zubiaga, D. Cooke, P. Crivelli, S. Mitchell, and J. Perez-Ramirez,J. Phys. Chem. C120, 25451 (2016). 16S. Patra, P. Mitra, and S. K. Pradhan,J. Mater. Res.
14, 17 (2011). 17
S. T. Kostas, N. Lori, N. T. Pantelis, K. L. Athanasios, M. Thomas, and P. N. Christakis,Microporous Mesoporous Mater.75, 89 (2004).
18F. J. Van Der Gaag, J. C. Jansen, and H. Van Bekkum,Appl. Catal.17, 261 (1985).
19W. L. Robinson and G. R. Stone,Bikini Atoll Rehabilitation Committee Summary Report No. 6 (BARC, Berkeley, CA, 1988), Appendix A, pp. A1–A48.
20Zs. Kajcsos, C. Kosanovic, S. Bosnar, B. Subotic, P. Major, L. Liszkay, D. Bosnar, K. Lazar, H. Havancsak, A. T. Luu, and N. D. Thanh,Mater. Sci. Forum607, 173 (2009).
21L. A. Tuyenet al.,Radiat. Phys. Chem.106, 355 (2015). 22
Zs. Kajcsoset al.,Radiat. Phys. Chem.76, 231 (2007). 23
S. Bosnar, D. Bosnar, and B. Greta,Acta Phys. Pol. A125, 775 (2014); M. Milina, S. Mitchell, P. Crivelli, D. Cooke, and J. Perez-Ramirez, Nat. Commun.5, 3922 (2014).
24D. Dutta, A. Sachdeva, and P. K. Pujari,Chem. Phys. Lett.
432, 116 (2006). 25
S. Dannefaer, T. Bretagnon, and D. Kerr,J. Appl. Phys.74, 884 (1993). 26
S. Dannefaeret al.,Thin Solid Films255, 171 (1995).
27K. S. Hui and C. Y. H. Chao, Microporous Mesoporous Mater.88, 145 (2006).
28D. Fodor, A. B. Redondo, F. Krumeich, and A. J. V. Bokhoven,J. Phys. Chem. C119, 5447 (2015).
29
D. P. Siantar, C. G. Schreier, C. Chou, and M. Reinhard,Water Res.30, 2315 (1996).
30K. Yamagishi, S. Namba, and T. Yashima,J. Phys. Chem.95, 872 (1991); M. Hasegawa, Y. Tsuchiya, Y. Kitayama, T. Chiba, M. Saitoh, and S. Yamaguchi,Mater. Sci. Forum105–110, 257 (1992).
31
A. Jentys and J. A. Lercher,Stud. Surf. Sci. Catal.137, 345 (2001). 32T. L. Dull, W. E. Frieze, and D. W. Gidley,J. Phys. Chem. B105, 4657 (2001). 33Zs. Kajcsoset al.,Acta Phys. Pol. A