Published online 2016 February 3. Research Article
Model of Cholera Forecasting Using Artificial Neural Network in Chabahar
City, Iran
Zahra Pezeshki,
1Mohammad Tafazzoli-Shadpour,
2,*Isar Nejadgholi,
2Ali Mansourian,
3and
Mohammad Rahbar
41Center for Disease Control, Ministry of Health and Medical Education, Tehran, IR Iran 2Faculty of Biomedical Engineering, Amirkabir University of Technology, Tehran, IR Iran 3Department of Physical Geography and Ecosystem Science, Lund University, Lund, Sweden
4Department of Microbiology, Reference Health Laboratories Research Centre, Ministry of Health and Medical Education, Tehran, IR Iran
*Corresponding author: Mohammad Tafazzoli-Shadpour, Faculty of Biomedical Engineering, Amirkabir University of Technology, Tehran, IR Iran. Tel: +98-2164542385,
Fax: +98-2166468186, E-mail: [email protected]
Received 2015 July 11; Revised 2015 September 23; Accepted 2015 October 3.
Abstract
Background: Cholera as an endemic disease remains a health issue in Iran despite decrease in incidence. Since forecasting epidemic diseases provides appropriate preventive actions in disease spread, different forecasting methods including artificial neural networks have been developed to study parameters involved in incidence and spread of epidemic diseases such as cholera.
Objectives: In this study, cholera in rural area of Chabahar, Iran was investigated to achieve a proper forecasting model.
Materials and Methods: Data of cholera was gathered from 465 villages, of which 104 reported cholera during ten years period of study. Logistic regression modeling and correlate bivariate were used to determine risk factors and achieve possible predictive model one-hidden-layer perception neural network with backpropagation training algorithm and the sigmoid activation function was trained and tested between the two groups of infected and non-infected villages after preprocessing. For determining validity of prediction, the ROC diagram was used. The study variables included climate conditions and geographical parameters.
Results: After determining significant variables of cholera incidence, the described artificial neural network model was capable of forecasting cholera event among villages of test group with accuracy up to 80%. The highest accuracy was achieved when model was trained with variables that were significant in statistical analysis describing that the two methods confirm the result of each other.
Conclusions: Application of artificial neural networking assists forecasting cholera for adopting protective measures. For a more accurate prediction, comprehensive information is required including data on hygienic, social and demographic parameters.
Keywords: Cholera, Iran, Forecasting, Statistical Model, Neural Network
Copyright © 2016, Alborz University of Medical Sciences. This is an open-access article distributed under the terms of the Creative Commons Attribution-NonCom-mercial 4.0 International License (http://creativecommons.org/licenses/by-nc/4.0/) which permits copy and redistribute the material just in noncomAttribution-NonCom-mercial us-ages, provided the original work is properly cited.
1. Background
Cholera remains a major health risk despite global in-stitutional attention. In 2012, a total of 245393 cholera cases were reported leading to 3043 deaths. In Asia, 27 deaths from 7367 cases were reported among 12 countries with highest mortalities in Iraq. While in Asia, the main proportion of cases is due to Vibrio cholerae, most cases elsewhere are caused by acute watery diarrhea (1). It is estimated that among actual cholera cases worldwide, only 1% are formally stated (2). Underreporting might be due to limitations in surveillance systems, fear of travel related and trade related sanctions (1). In Iran, the last epidemic of 2011 involved 1187 cases and 12 deaths (3). Despite advances in treatment plans, due to continuous worldwide incidence, cholera is globally considered a hazard to public health.
Persistence of cholera incidence has been shown to
be correlated with unsanitary living conditions (4). Ac-cording to the WHO protocols, cholera as an interna-tional hazard has to be reported if two of the following four concerns are prominent; a severe impact on public health, peculiar or unexpected outbreak, fear of consid-erable international spread and a significant risk of inter-national restriction on trade and travel (5).
Dissemination of cholera is strongly correlated with lack of proper management in environmental and health issues. Aquatic environment is vital for survival of V. cholerae. The spread of cholera is unavoidable when adequate environmental conditions such as tempera-ture, salinity and availability of nutrients exist. In the absence of human intervention, V. cholerae grows and spreads for long time; otherwise, metabolically active state shifts to a dormant state. Specific alterations
with-in climate conditions with-influence the spread of some with- in-fectious diseases, among which incidence of V. cholerae is highly encouraged by contamination of water and food supplies. V. cholerae is highly persistent in foods, es-pecially when contaminated after preparation. Cooking and heating to some extent eliminates bacteria from the food (2).
When initiation and spread of infectious diseases such as cholera are predicted with reliable modeling, expert human, pharmaceutical and logistic resources can be employed for successful preventive actions within the prone locations (6).
Artificial neural networks are used for nonlinear statis-tical modeling, specifically as alternatives to logistic re-gression that is widely used in development of models of disease spread and prediction of epidemic outcomes and subsequent preventive actions (7).
Such models are capable of pattern recognition when ambiguity and/or intense variability occur within input data and expert knowledge cannot be easily served. Hence, for environmental and biological evaluations containing such data, application of artificial neural networks allows a proper elucidation of data and nonlinear forecast analy-sis of variables. Examples include categorizing quality of river water and automatic identification of phytoplankton (8), prediction of sea surface temperatures (9) and identi-fying excess deaths due to cholera (10). Artificial neural network modeling may contribute to management of dis-eases, which in some conditions spread by abnormal pat-terns of environmental parameters.
Artificial neural networks were used to study cholera mortality during epidemic of 1993-1994 in Brazilian state of Ceara through a network of two neurons in the input layer, twelve in the hidden layer, one in the output layer and one in the memory layer, and by backpropagation, with 0.01 learning rate and 0.9 momentums. Results indi-cated good prediction ability of artificial neural network, especially in the initial period (10).
2. Objectives
In this study, we developed a multilayer perception artificial neural network to achieve a model to predict cholera event within villages of Chabahar District, a south-eastern district of Iran among the regions with the highest cholera incidences nationwide. Data of geo-graphic parameters were processed using geogeo-graphic information system (GIS) and used as inputs of statistical analysis and neural network models (11).
The incidence of disease was studied based on climate and geographic variables. Such parameters including temperature, humidity, rainfall, altitude and distances of villages from district health center, rural health centers, eastern national border, the nearest river and subterra-nean canal, were considered as input data for prediction models.
3. Materials and Methods
3.1. Study Population
The incidence of cholera was investigated during 1997 - 2006 among rural regions of district of Chabahar, a free economic zone and coastal resort of Oman Sea on the southeast of Iran bordering Pakistan on east that has continuously been prone to cholera outbreak. All 465 villages of Chabahar were included in the study, among which 104 were listed with cholera incidence within the period of study.
3.2. Data Collection
Data of cases during 1997 - 2006 were acquired from the line list of Nag and Eltor cholera disease reported to the center for disease control, Iran ministry of health and medical education through the surveillance system. The diagnosis of disease was assured after clinical examina-tion of fecal samples with initial syndromes similar to those of cholera.
Data of temperature, humidity and rainfall as monthly average for each year were collected from Iran meteorol-ogy organization. Geographical parameters included ele-vation and distances of villages from district health center, rural health centers, national eastern border, the nearest river and subterranean canal. Using geographic informa-tion systems, these parameters were quantified through geographical layers as discussed in previous article (11).
The incidence of cholera was binary coded, with “one” allocated for villages with cholera incidence and “zero” for those without cholera. The number of cholera cases per 100 persons was similar among villages.
3.3. Data Processing
To determine cholera risk factors, statistical analysis was performed using SPSS software (IBM, New York) ac-companied by neural network modeling for prediction of cholera spread.
3.3.1. Logistic Regression Modeling and Correlate
Bivariate
Statistical analysis was performed to investigate correla-tion between cholera spread and variables of study. Since the histograms of independent and dependent variables were not normally distributed, the cholera incidence among villages was binary coded. Using SPSS version 11.5, binary logistic regression and correlate bivariate per-formed with 95% confidence interval to model influence of climate and geographical parameters in cholera inci-dence in 10 years period of study (11).
3.3.2. Artificial Neural Network Modeling
Two categories of input variables were considered in predictions. All variables of the study and variables that
were statistically significant in cholera incidence were based on logistic modeling (Table 1). To predict cholera event, a multilayer perceptron architecture containing input, hidden and output layers with backpropagation training algorithm, sigmoid activation function with 0.01 learning rate and 0.7 momentum was trained and tested with different variables (Table 2). The climate variables were introduced as both monthly averaged and seasonally averaged. The output parameter was cholera incidence as monthly and seasonally averaged. The number of neurons of the hidden layer was accord-ing to the input and output layers.
To obtain validated results, the input data was normal-ized by subtraction of mean value of each data column and division of results by standard deviation. After pre-processing, data was divided into training and test categories. This was performed to analyze the ability of network in prediction of test group after network train-ing. Within the training group, data of 365 villages and in test group those of 100 villages were collected. The number of neurons in each layer was different based on monthly or seasonally weather data, inputting all vari-ables or only statistically significant varivari-ables in logistic regression model.
The output tag was a binary code in which the cholera incidence was either one or zero. Since the applied acti-vation function (sigmoid) generates outputs in the (0,1) range, these outputs have to be converted to binary tags and then compared to desired ones during the test phase. This conversion can simply performed through rounding the outputs; i.e. the outputs smaller than 0.5 are convert-ed to zero and the ones larger than 0.5 roundconvert-ed to 1. If the resultant code is the same as the tag code, the prediction is considered as true. The ratio of true distinctions in test data to all test data is introduced as accuracy of predic-tion. In the current study, comparison measurement was based on proper decrease of error and accuracy of predic-tion in test villages (12).
Due to successful applications in data classifications, multi-layer perceptrons (MLP) are well known forms of feed forward artificial neural networks. The process of supervised learning for a MLP with input data and target, requires usage of an objective function to evaluate devia-tion of the predicted output, from the observed data and assessment for the convergence toward an optimal set of results. There are several MLP training algorithms, from which the backpropagation (BP) algorithm is commonly well-known (13).
Backpropagation, as one of the most prominent devel-opments in artificial neural networking, is a systematic method for training multilayer artificial neural networks (Figure 1). It reveals generalization of least mean squares (LMS) algorithm to multiple layer networks and nonlin-ear differentiable transfer functions (14).
MLP is initiated with random weight matrices with ele-ments in the range of (0, 0.01). Training is performed for several iterations until the weight matrices converge. In
each iteration, the weight matrices of MLP are updated according to backpropagation algorithm. The outputs of layers are then calculated as:
(1)
a
ti+1
=
f
i+1W
ti
a
it+
b
i+1i
=
1,...,
m
−
1
wherea
i
t
+
1
is the output of layer i + 1 at iteration t, m is the number of layers in the network, fi+1 indicates the transfer func-tions of layer i + 1,W
t
+
1
i
is the weight matrix that connects the ith layer to i+1th
layer at tth iteration and b
i+1 describes the bias of layer i +
1. The transfer functions used in this study is tan-sigmoid function described as
f
(
s
) =
2
/
1
+
e
−2.s for input and hidden layer and linear (f(s) = s) for the out-put layer. The training data includes N observations and their corresponding labels, which are used in training phase to adjust weight matrices of the neural network. After training phase, neural network is tested with anoth-er set of data, including M obsanoth-ervations and correspond-ing labels. These labels are compared to those estimated by neural network to assess the training efficacy (12).3.4. Validity of Prediction of Neural Network
To evaluate optimized prediction of the neural net-work, receiving operator characteristic (ROC) diagrams were used. Usage of ROC curve is one of the most suitable methods of assessing the value of a test by defining an appropriate decision threshold (15).
When the ROC diagram is considered, the Y axis de-scribes the true positive (sensitivity) value and the X axis indicates false positive (1-specificity) value for each possible prediction. The prediction value is selected to categorize the extent of correct detection of cholera occurrence through optimum verification of the input parameters when the adopted model is taken into ac-count (16, 17).
When the test cases are classified, four categories are dis-tinguished (17); true positives (TP) as correctly classified positive cases, true negatives (TN) as correctly classified negative cases, false positives (FP) as incorrectly classified negative cases and false negatives (FN) as incorrectly
clas-sified negative cases. Then “true positive fraction” (TPF) and “false positive fraction” (FPF) are defined as follows:
(2)
TPF
=
TPTP+FN(3)
FPF
=
TNFP+FPWithin the ROC diagram, the northwest zone is favored since the true positive (TP) rate is higher and the false positive (FP) rate is lower (18).
4. Results
4.1. Risk Factors of Cholera Incidence
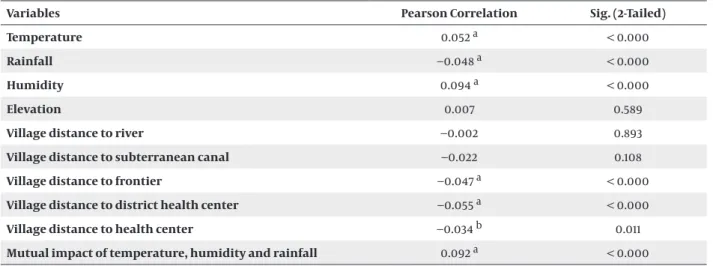
A total of 286 cases were registered with cholera in 104 of 465 villages in Chabahar during 1997 - 2006. Several factors were found to be significantly correlated with cholera incidence in Chabahar rural area (P < 0.05) (Table 1). Villages with higher temperature and humidity, lower rainfall, shorter distances to border and rural health cen-ter and longer distance to the district health cencen-ter were at higher risk of disease incidence, among which humid-ity with odds ratio of 1.12 had the highest impact.
4.2. Prediction of Cholera Incidence by Artificial
Neural Network
Neural network was trained with variables of data re-lated to 365 villages and tested with those of 100 villages. The best result (true positive on y axis and false positive on x axis) was achieved when the model was trained with statistically significant variables including temperature, humidity, rainfall, distance of villages to national border
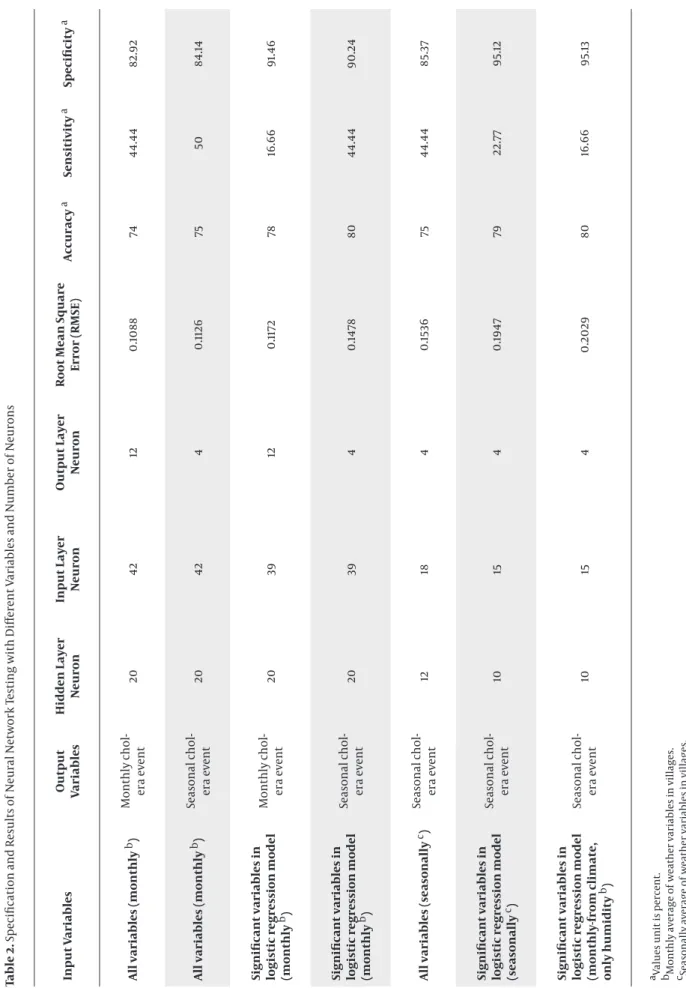
and distance of villages to rural and district health centers. Table 2 indicates seven most important methods de-scribing layer topology, results of training, estimate of network, sensitivity and accuracy of prediction.
4.3. Optimized Prediction of the Neural Network
Using ROC
To determine a network with best specification for pre-diction of cholera event, ROC diagrams were analyzed with allocation of true and false positive values. Figure 2 shows ROC diagram of an optimized network with 39 neurons in input layer, 20 neurons in hidden layer and 4 neurons in output layer (as indicated by row 4 in Table 2). Such network has been trained by variables of distances of villages to frontier, health center and district health center, monthly average temperature, humidity and total rainfall data in input layer and seasonally cholera event in the output layer.
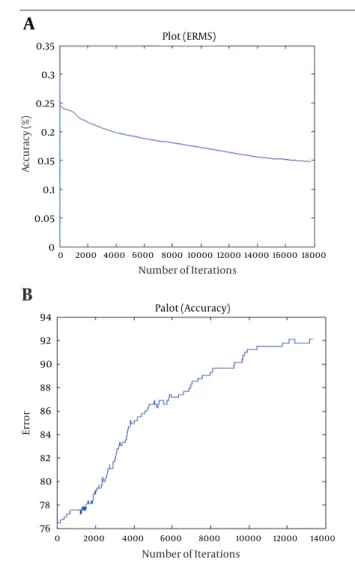
4.4. Accuracy of Prediction
Figure 3A and B show error of root mean square (ERMS) and accuracy percentage of prediction for the neural network with the best prediction (row 4 in Table 2). The ERMS parameteris extensively used for evaluating the ability of the model for prediction by quantifying how the predicted and true conditional performances are close; commonly it is considered the only criterion (19, 20). Results showed that the network predicted cholera disease event up to 80% accuracy in 100 monitored vil-lages (test group).
The sensitivity (accuracy of disease prediction) of the network in villages was 44.4% and the specificity (accura-cy of prediction of lack of illness) was 90.24%. This means that neural network model after training could specify 44.4% of villages with cholera cases and 90.24% of villages without cholera cases in test group.
Table 1. Relation Between Cholera Event (binary) and Climate Condition/Geographical Variables by Correlate Bivariate
Variables Pearson Correlation Sig. (2-Tailed)
Temperature 0.052 a < 0.000
Rainfall −0.048 a < 0.000
Humidity 0.094 a < 0.000
Elevation 0.007 0.589
Village distance to river −0.002 0.893
Village distance to subterranean canal −0.022 0.108
Village distance to frontier −0.047 a < 0.000
Village distance to district health center −0.055 a < 0.000
Village distance to health center −0.034 b 0.011
Mutual impact of temperature, humidity and rainfall 0.092 a < 0.000
aCorrelation is significant at the 0.01 level. bCorrelation is significant at the 0.05 level.
Table 2.
Specification and Results of
Neural Network T
esting with Different V
ariables and Number of
Neurons
Input V
ariables
Output Variables Hidden Layer Neuron Input Layer Neuron Output Layer Neuron Root Mean Square Error (RMSE)
Accuracy
a
Sensitivity
a
Specificity
a
All variables (monthly
b)
Monthly chol
-era event
20
42
12
0.1088
74
44.44
82.92
All variables (monthly
b)
Seasonal chol
-era event
20
42
4
0.1126
75
50
84.14
Significant variables in logistic regression model (monthly b)
Monthly chol
-era event
20
39
12
0.1172
78
16.66
91.46
Significant variables in logistic regression model (monthly b)
Seasonal chol
-era event
20
39
4
0.1478
80
44.44
90.24
All variables (seasonally
c)
Seasonal chol
-era event
12
18
4
0.1536
75
44.44
85.37
Significant variables in logistic regression model (seasonally c)
Seasonal chol
-era event
10
15
4
0.1947
79
22.77
95.12
Significant variables in logistic regression model (monthly-from climate, only humidity b)
Seasonal chol
-era event
10
15
4
0.2029
80
16.66
95.13
a Values unit is percent. bMonthly a
verage of
weather variables in villages.
c Seasonally a
verage of
Figure 1. A Schematic Description of the Backpropagation Algorithm with 5 Neurons in the Input Layer, 3 in the Hidden Layer and 1 in the Out-put Layer
Figure 2. ROC Diagram for Determining Network with Best Specification for Prediction of Cholera Event
9.76 * ; 44.44
True
Positive (sensitivity)
False Positive (specificity)
* Best prediction point.
A
A
ccura
cy
(%
)
Number of Iterations
B
Error
Number of Iterations
94 92 90 88 86 84 82 80 78 76
Palot (Accuracy)
0 2000 4000 6000 8000 10000 12000 14000 16000 18000 0.35
0.3 0.25 0.2 0.15 0.1 0.05 0
0 2000 4000 6000 8000 10000 12000 14000 Plot (ERMS)
Figure 3. A, Error of Root Mean Square (ERMS) vs. Number of Iteration. B, Accuracy Percentage vs. Number of Iterations
5. Discussion
In this study, cholera incidence was analyzed in Chaba-har rural area, a coastal district located in southeast of Iran by determining risk factors through logistic regression and Correlate bivariate and developing prediction model by artificial neural network. Statistical modeling results described that cholera event was significantly related to climate factors, especially humidity (average 67%). In one study on linear correlation of V. cholerae with humidity in West Bengal using time series modeling and carrying different levels of humidity percentage in the analysis, a highly significant association was found between humidi-ty and V. cholerae infection over 13 years (21). There was a sig-nificant association between the incidence of cholera and lack of rainfall (annual average 796 mm) as well. It might be due to drought that made people use stagnant water from seasonal river pounds and wells with lower depths, which had higher risk of contamination. In Bangladesh, there was a peak of cholera occurrence by low rainfall in spring and by high rainfall at the end of monsoon using
Poisson regression modeling (22). In several African na-tions, cholera incidence has happened mainly followed by drought or flooding as well (23). In a work investigat-ing quantitative evidence for the influence of climate on cholera, low rainfall was shown to be related to the first cholera peak through alterations in water supply and so-cial behavior toward sanitary measures (24). Additionally, cholera spread has been shown to be under influence of high temperature concurrent with elevated PH and plank-ton bloom (25). Our study showed higher temperature (av-erage 27 degree centigrade) had a significant effect on the incidence of cholera. Therefore, the influence of climate conditions in cholera incidence has been well emphasized.
Reduction of disease hazard can be achieved by appropri-ate predictive measures among regions and communities at risk (5). A proper intervention necessitates synergetic approaches of prevention and awareness based on an ef-ficient surveillance system to limit the cholera outbreak and control the disease burden in endemic regions (9).
Modeling by artificial neural networks revealed predic-tion ability of cholera event up to 80%, with 44.4% sen-sitivity and 90.24% specificity. Since the neural network identified 44.4% of villages with risk of cholera after train-ing, it seems wise to take preventive measures in all the villages, unless the network can increase its sensitivity by being trained with comprehensive factors affecting the event of cholera.
The best prediction was achieved when trained by sig-nificant variables in statistical model. Hence, statistical analysis is a proper tool for determining variables for training neural network. However, neural networks lean on their potential for non-linear analysis of data for de-tection and prediction of the disease outbreak (26).
Climate changes cause new challenges for control of infectious diseases in human societies. This necessitates efficient prediction tools to take proper actions in dis-ease incidences. Severe infectious disdis-eases such as chol-era and acute diarrhea, as well as malaria, dengue and other infections carried by vectors, are highly sensitive to climate conditions, especially temperature and rainfall. Alterations in global and local scales of such parameters threaten worldwide public health and controlling mea-sures adopted in recent decades (27)
Considering geographical and climate features, es-pecially when climate conditions are globally under change, it is of great importance to seek convenient al-gorithms to predict the spread of such diseases based on climate conditions. Artificial neural networks are proper tools for climate modeling and weather prediction (28). They are increasingly used to predict and detect specific events in bio-systems, especially for detection of various diseases being beneficial for medical intervention (26).
The accuracy of prediction significantly depends on availability of data for all possible variables. Here, lack of data on some hygienic, social and demographic indica-tors in Chabahar district has been one of the limitations of prediction. Such indicators include sanitary measures, sources of drinking water, situation of hygiene in restau-rants and other food providers, population density, birth rate and literacy in different geographical regions. Add-ing additional hygienic, social and demographic variables would enhance the potential of model to predict more ac-curately, which remains a motivating field of survey.
5.1. Conclusions
In this study, the relation between cholera incidence in Chabahar and variables of study were statistically evalu-ated and a designed artificial neural network model was capable of predicting cholera event up to 80%. Our results showed that neural networks are promising tools for pre-diction of such infectious diseases to adopt preventive ac-tions on time and reduce fatalities and limit undesirable social outcomes. However, due to limitations of our da-taset with this neural network, sensitivity of prediction is not high enough. For achieving a more reliable
predic-tion, comprehensive data is necessary and inclusion of influential hygienic, social and demographic parameters is recommended.
Acknowledgments
The authors would like to express gratitude to the per-sonnel of Chabahar district health center, especially Mo-hammad Ali Abouzari and Faiz MoMo-hammad Atash-Bahar for their valuable assistance in data gathering and pro-viding information of local villages.
Footnote
Authors’ Contribution:Literature review, data collec-tion, analysis and drafting: Zahra Pezeshki; editing and preparation: Mohammad Tafazzoli-Shadpour; technical advice for neural network, preparing data in GIS for using in neural network and cholera disease in order: Isar Ne-jadgholi, Ali Mansourian and Mohammad Rahbar; study design and interpretation: all authors.
References
1. World Health Organization. Cholera, 2012. Wkly Epidemiol Rec.
2013;88(31):321–34. [PubMed: 23980290]
2. Mandell GL, Bennet JE, Dolin R. Principals and Practice of Infectious Diseases. Seventh ed. London: Churchill Livingstone; 2011. pp. 2777–83.
3. Ministry of health and medical education. A review of cholera condition in Islamic Republic of Iran. Tehran;. 2011.
4. World Health Organization. Cholera calibration. Fact sheet, N. 107.
WHO Web Site; 2011. Available from: http://www.who.int/media-centre/factsheets/fs107/en/.
5. World Health Organization. International health regulation. 2nd ed. Geneva: World Health Organization; 2005. pp. 40–1. 6. Akanda AS, Jutla AS, Gute DM, Evans T, Islam S. Reinforcing cholera
intervention through prediction-aided prevention calibration. WHO Web Site; 2012. Available from: http://www.who.int/bulletin/vol-umes/90/3/11-092189/en/.
7. Tu JV. Advantages and disadvantages of using artificial neural networks versus logistic regression for predicting medical out-comes. J Clin Epidemiol. 1996;49(11):1225–31. [PubMed: 8892489] 8. Helmer R, Hespanhol I, Supply W, Council SC, World Health
Orga-nization. Water pollution control: a guide to the use of water quality management principles. London: E & FN Spon; 1997. p. 17. 9. Wu A, Hsieh WW, Tang B. Neural network forecasts of the tropical
Pacific sea surface temperatures. Neural Netw. 2006;19(2):145–54. doi: 10.1016/j.neunet.2006.01.004. [PubMed: 16527455]
10. Penna ML. [Use of an artificial neural network for detecting ex-cess deaths due to cholera in Ceara, Brazil]. Rev Saude Publica.
2004;38(3):351–7. doi: 10.1590/S0034-89102004000300003. [PubMed: 15243663]
11. Pezeshki Z, Tafazzoli-Shadpour M, Mansourian A, Eshrati B, Omidi E, Nejadqoli I. Model of cholera dissemination using geographic information systems and fuzzy clustering means: case study, Chabahar, Iran. Public Health. 2012;126(10):881–7. doi: 10.1016/j.puhe.2012.07.002. [PubMed: 22884859]
12. Nejadgholi I, Seyyedsalehi SA. Nonlinear normalization of input patterns to speaker variability in speech recognition neural net-works. Neural Comput Appl. 2009;18(1):45–55. doi: 10.1007/s00521-007-0151-5.
13. Silva LM, Marques de Sa J, Alexandre LA. Data classification with multilayer perceptrons using a generalized error function. Neu-ral Netw. 2008;21(9):1302–10. doi: 10.1016/j.neunet.2008.04.004. [PubMed: 18572384]
14. Yilmaz B, Cunedioglu U. Source localization of focal ventricular arrhythmias using linear estimation, correlation, and backprop-agation networks. Comput Biol Med. 2007;37(10):1437–45. doi:
10.1016/j.compbiomed.2007.01.008. [PubMed: 17346691] 15. Ubeyli ED. Implementing eigenvector
methods/probabilis-tic neural networks for analysis of EEG signals. Neural Netw.
2008;21(9):1410–7. doi: 10.1016/j.neunet.2008.08.005. [PubMed: 18815008]
16. Subasi A, Alkan A, Koklukaya E, Kiymik MK. Wavelet neural net-work classification of EEG signals by using AR model with MLE preprocessing. Neural Netw. 2005;18(7):985–97. doi: 10.1016/j.neu-net.2005.01.006. [PubMed: 15921885]
17. Mazurowski MA, Habas PA, Zurada JM, Lo JY, Baker JA, Tourassi GD. Training neural network classifiers for medical decision making: the effects of imbalanced datasets on classification performance. Neural Netw. 2008;21(2-3):427–36. doi: 10.1016/j.neu-net.2007.12.031. [PubMed: 18272329]
18. Fawcett T. ROC graphs: Notes and practical considerations for researchers. Mach learn. 2004;31:1–38.
19. Faber NM. Estimating the uncertainty in estimates of root mean square error of prediction: application to determining the size of an adequate test set in multivariate calibration. Chemometrics and Intelligent Laboratory Systems. 1999;49(1):79–89. doi: 10.1016/ s0169-7439(99)00027-1.
20. Sahiner B, Chan HP, Hadjiiski L. Classifier performance estima-tion under the constraint of a finite sample size: resampling schemes applied to neural network classifiers. Neural Netw.
2008;21(2-3):476–83. doi: 10.1016/j.neunet.2007.12.012. [PubMed: 18234468]
21. Rajendran K, Sumi A, Bhattachariya MK, Manna B, Sur D, Ko-bayashi N, et al. Influence of relative humidity in Vibrio cholerae
infection: a time series model. Indian J Med Res. 2011;133:138–45. [PubMed: 21415487]
22. Hashizume M, Faruque AS, Wagatsuma Y, Hayashi T, Arm-strong B. Cholera in Bangladesh: climatic components of sea-sonal variation. Epidemiology. 2010;21(5):706–10. doi: 10.1097/ EDE.0b013e3181e5b053. [PubMed: 20562706]
23. World Health Organization. Fourth emergency and humanitarian action annual review. WHO Web Site 2008. Available from: http:// www.afro.who.int/en/clusters-a-programmes/ard/emergency-and-humanitarian-action/eha-publications.html.
24. Pascual M, Bouma MJ, Dobson AP. Cholera and climate: revisiting the quantitative evidence. Microbes and Infect. 2002;4(2):237–45. doi: 10.1128/cmr.15.4.757-770.2002. [PubMed: 11880057]
25. Lipp EK, Huq A, Colwell RR. Effects of global climate on infectious disease: the cholera model. Clin Microbiol Rev. 2002;15(4):757–70. [PubMed: 12364378]
26. Lisboa PJG. A review of evidence of health benefit from artifi-cial neural networks in medical intervention. Neural Networks.
2002;15(1):11–39. doi: 10.1016/S0893-6080(01)00111-3. [PubMed: 11958484]
27. World Health Organization. Protecting health from climate change: Re-portfor World Health Day 2008. WHO Web Site; 2008. Available from: http://www.who.int/world-health-day/toolkit/report_web.pdf. 28. Krasnopolsky VM, Fox-Rabinovitz MS. Complex hybrid models
combining deterministic and machine learning components for numerical climate modeling and weather prediction. Neu-ral Netw. 2006;19(2):122–34. doi: 10.1016/j.neunet.2006.01.002. [PubMed: 16527454]