ISSN 1479-4403 1 ©ACPIL Welcome to volume 2 of the special issue of EJEL, focusing research methodologies in e-learning.
As expressed in the call, e-learning research is largely heterogeneous in that there is large variation in the use of research methods and approaches. There is research focusing on evaluation and effectiveness, being based on single case studies or covering several cases. Added to this is the broad variety of pedagogical approaches, domains and contexts that are being approached. The contributions in volume 1 of this special issue largely reflected this and presented reflections on the use of research methodology and results, as well as the anchoring and proposing of new approaches to e-learning research. Volume 2 is no exception to this and presents a blend of qualitatively and quantitatively oriented e-learning research; research focusing on the evaluation and results as well as the processes of e-learning research; analyses of e-learning and anchored suggestions for change of policy and power structures; contributions to the continued development of theory and methodology within e-learning research; as well as the assessment of e-learning quality. All in all, contributions aiming for continued discussion and reflection.
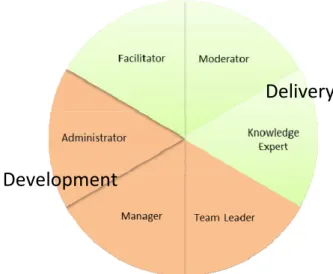
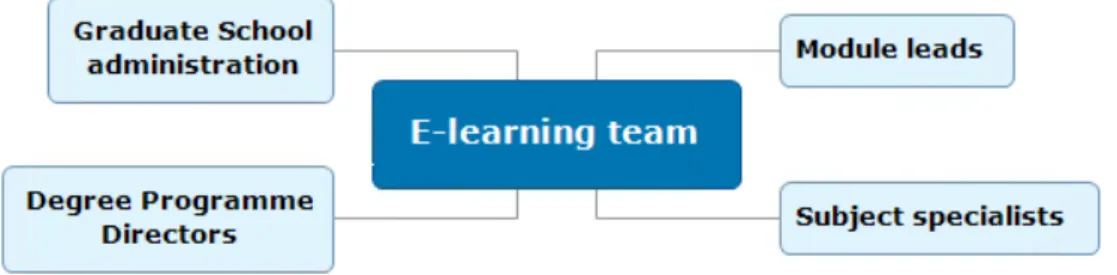
Paula Charbonneau-Gowdy makes a strong argument for a critical and reflective approach to researching technology use to unravel research approaches that can aid in closing the gap between research and practice. The argument is made that while technology is increasingly becoming a social networking facilitator, qualitative research has the power to uncover the stories that matter in socially embodied learning contexts. Hence, the author makes an argument for the importance of qualitatively oriented e-learning research. In the article “An e-learning team´s life on and offline: a collaborative self-ethnography in postgraduate education development”. Alison Clapp presents an ethnography involving a community developing e-learning courses. In any collaboration, such as in designing and delivering e-learning courses there will be stakeholders with different backgrounds and experiences. Being a subject matter expert is one thing, designing and delivering e-learning courses is another. Based on ethnography as an interpretative approach, the author presents “guidelines” to staff development to facilitate future engagement in and development of online distance learning. In the same vein, Laura Delgaty points at changes and transformations of relations and power structures that have emerged in the uptake of distance learning, and the need for clear guidance within academia as regards the development and delivery of distance learning. The study reported in the article, building on practitioner inquiry methodology and use of mixed-methods, is a direct response to these concerns and makes a call for new models of organizational roles and responsibilities. New competencies are demanded and traditional roles and cultures need to be redefined. The article makes a case for practitioner inquiry being a legitimate research approach in that it is accessible and valuable to teachers, and the article further adds to applied and useful knowledge concerning distance learning practice.
Katja Derr approaches the problem of course evaluation given that there is large variance in participants’ knowledge levels, learner behaviour and commitment. A study is presented in which the effectiveness of a mathematics pre-course was evaluated to investigate whether the pre-course enabled “at risk” students to improve their starting position in STEM-related subjects. A pre-post test design revealed the importance of basic mathematical knowledge for academic achievement in engineering, and that students having participated in additional face-to-face courses showed less learning gain as compared to students having participated in an e-tutoring version. Online test attempts by students in the pre-course further proved to be a reliable indicator of student engagement. Identifying good indicators of student learning processes and engagement, as well as that of efficiency and quality of e-learning courses, is admittedly difficult. In the article “Motivational gaps and perceptual bias of initial motivation: additional indicators of quality for e-learning courses”, the problem of finding good indicators of course quality is approached. Rosário Cacao presents a study on the motivation of trainees in e-learning-based professional training and more specifically, the effect of their motivation on perceptions of course quality. The concepts of perceived motivational gap and real motivational gap are defined and suggested as indicators of e-learning quality. The results from the study show that the conceptual gaps help explain how trainees’ perception of quality is affected; the gaps were minimized when perceptions of quality were higher, and when they were positive perceptions of quality was higher than average.
The authors Levinsen and Ørngreen in their article present and discuss workshops as a research methodology, and more specifically how workshops as a research methodology pertains to e-learning. An analysis and discussion of five studies on upper secondary and higher education teachers’ professional development and on teaching and learning through video conferencing, paves the way in their argumentation - more precisely, the argument that workshops can provide the means for understanding complex work and knowledge processes supported by technology, and among these e-learning. The format aids in identifying factors that are not obvious to participants or researchers, and thus helps in identifying blind spots. The pivotal role of the researcher as a facilitator of such workshops and the analysis of these, is further discussed from a research ethical point of view. While the authors Levinsen and Ørngreen contribute to a discussion on research methodology within e-learning by introducing the format of workshops, Magnussen et. al., presents a methodological discussion of the potential and challenges of involving mobile eye tracking technology in studies of knowledge generation and learning; and more specifically, within a science centre context. A study is presented where eye tracking technology has been used by families and children, as well as of school classes visiting a science centre. The authors present how the use of eye tracking technology and methods influence research on an interventional level, on a data level, and on analytical level and how eye tracking can supplement other analytical approaches.
In the article “The e-learning setting circle: First steps towards theory development in e-learning research”, the authors Marco Rüth and Kai Kaspar presents a model that enables comparability and generalizability of e-learning project results by structuring, standardizing and guiding e-e-learning approaches at the level of a general research methodology. The authors in their argumentation point at the heterogeneity of e-learning approaches with fairly unique combinations of situational factors guiding the design of e-learning. And more specifically, that this is conducted in a bottom-up fashion – and hence comparability and generalisability becomes difficult if not impossible. There is thus a lack of comprehensive theories that allow assuming top-down approaches to e-learning research. The e-learning setting circle that is presented is a first step in such adirection. The model builds on two elements; a guiding element making clear the setting and assessment of goal attainment, and a universal element building on multi-criteria decision making. The model further consists of the following three clusters; context setting, structure setting, and content setting. The model is presented as a strategic conceptual framework that can be used to foster theory development in e-learning projects and research.
Hence, the articles in volume 2 make further contributions to an ongoing critical discussion and challenging of established approaches and paradigms within e-learning research and practice.
Robert Ramberg Guest Editor
ISSN 1479-4403 3 ©ACPIL Reference this paper as: Cação R, “Motivational Gaps and Perceptual Bias of Initial Motivation Additional Indicators of
Additional Indicators of Quality for e-Learning Courses
Rosário Cação
CISUC, University of Coimbra, Portugal [email protected]
Abstract: We describe a study on the motivation of trainees in e-learning-based professional training and on the effect of their motivation upon the perceptions they build about the quality of the courses. We propose the concepts of perceived motivational gap and real motivational gap as indicators of e-learning quality, which reflect changes in both perceived and real students' motivation. These indicators help evaluate the changes in the trainees' motivation, as well as the bias that occurs in the perceptions about initial motivation.
In the sample analyzed, the real motivational gap was more negative when the perceived motivational gap was negative and not so positive when the perceived motivational gap was positive. We found that there is a perceptual bias on initial motivation when the perceived motivational gap is not null. This means that, for the sample analyzed, the trainees may have “adjusted” their perception regarding the initial motivation as a function of their final motivation, bringing it closer to the latter and supporting their final status. We also show that these gaps help explain how the trainees' perception of quality is affected: the gaps were minimized at higher levels of perceptions of quality and when they were positive, the perception of quality was higher than average.
The two proposed conceptual gaps are useful to measure quality in e-learning and implement specific actions to improve it. The results of our study are useful as they create insights on perceptions of quality in an indirect way, i.e., without asking the trainees to think about what they believe quality is, so that they can quantify it. They also enable training companies to create additional and complementary indicators of quality of e-learning courses that can help explain changes in perceptions of quality.
Keywords: attitudes, courses, expectations, e-learning, gaps, motivational gap, motivation, motivation to learn, perception bias, quality, quality indicators, quality of e-learning, satisfaction, service, training management, training motivation
1.
Introduction
Along with innovation, quality is one of the keys to business success and competitive advantage. Yet, the idea of creating, measuring, and improving quality is difficult to put into practice.
Most of the proposed approaches share the idea that what counts is quality as it is perceivedby the customers
(Grönroos, 1990, 2007), namely by the trainees (Ehlers, 2004). This does not mean that other stakeholders who are impacted by the training should not be taken in account (Juran and Gryna, 1993, Kazmer and Haythornthwaite, 2005). This holds true especially when opposite perceptions about the same course may occur among different stakeholders. Measuring quality is difficult because it is a perceptual and multi-dimensional variable. Due to this, quality is measured through indicators. Different factors have been pointed out as dimensions of quality in e-learning, such as increased professional competence, tutoring support, technology, and design process (Donabedian, 1980, Ehlers et al., 2005, Tergan and Schenkel, 2004, Ehlers, 2004, Frydenberg, 2002, Hayes, 2015).
Defining and measuring quality is a hard task no matter the product or service under analysis. Among goods, the concept of quality is often related to technical specifications, such as its durability, reliability, precision, and ease of operation and repair (Kotler et al., 1996, Deros et al., 2009, Dror, 2007). When services are at stake, quality has another meaning, because services are mainly intangible processes where production and consumption cannot be totally separated and the customer actively participates in the production process. This is especially true in educational services: learning occurs mainly due to the efforts made by the learners; a successful learning experience is also constructed by them (Freire, 1985, Freire, 1992, Vygotsky, 1934, Mukhopadhyay, 2005, Freire, 1998) and depends on their ability to learn from that experience (Dewey, 1916, Dewey, 1925). Thus, in e-learning and educational services in general, quality is more related to the process, than to the delivery of finished educational products. Moreover, the outcomes of that service, the learning and the transfer of learning, cannot be foreseen nor determined with accuracy. In this learning process, the
attitudes of the trainees and their motivation are critical. Motivation influences the trainees’ predisposition to learn, their participation, and willingness to learn.
In this paper we propose two indicators of quality in e-learning based on the evolution of the trainees' motivation: the real motivational gap and the perceived motivational gap. We hypothesize that significant changes in the trainees' motivation along the course affect the perception of quality of the course. For instance, if a trainee starts the course with low motivation and progressively his motivation increases during the course, then his perception of quality will be generous. Yet, if he progressively becomes more unmotivated, something must be wrong and his perception of quality will be poor.
We present the results of an empirical study aimed at understanding the impact of the evolution of the motivation of the trainees upon the perceived quality of e-learning-based professional training. We used two online surveys to track the trainees' motivation and perceptions of quality. The article starts discussing motivation as a relevant dimension to understand quality and conceptualizing motivation and quality in a dynamic way. It then discusses the problems related to the process of retrieving initial motivation. Following this theoretical framework, the second part of the article presents the empirical research we have developed at an e-learning-based professional training company.
Our aim was to understand the relation between the motivation for training in e-learning-based professional training and the perception of quality and determine if motivation can be used as an indicator of perceived quality. With that purpose in mind, we draw three hypotheses:
H1: There is no difference between the perceived evolution of motivation and the real evolution of motivationfor training;
H2: Initial motivation can be measured retrospectively at the end of the course, without distortion;
H3: The evolution of the motivation of the trainees can be used as an indicator of perceived quality.
2.
Training Motivation as an Indicator of Quality
The concept of quality is not only difficult to define, but it is also not consensual. If two customers may have different ideas about what quality is, they can be rating different things. Consequently, the comparison between their perceptions of quality may become difficult. Companies have to use several clues to survey the evaluation the customers make about the quality of what they are buying. For that, they need to have a set of
key indicators to help them improve quality. But how can we infer about perceived quality? Specifically, can we use the trainees' motivation as an indicator of quality?
Learning achievements contribute to the perception of quality (Ehlers et al., 2005, Holton III, 1996). Learning is influenced, among other factors, by motivation and, although there is not a perfect relationship between
motivation and learning (Ahl, 2006), there is a tendency to align attitudes, which are predispositions to behaviour, with behaviour itself (Kallgren and Wood, 1986). This means that initial or pre-training motivation
(Cohen, 1990, Noe and Schmitt, 1986) promotes a predisposition to learn and to learning itself. At later stages, it also promotes a predisposition to transfer and make use of the learning outcomes in other contexts (Byrnes, 1996, Mendelsohn, 1994, Packer, 2001) and generates an increased perception of quality. This suggests that training attitudes and motivation can help explain the perception of quality. This also means that, as motivation evolves throughout the course, and the expectations involved may be disconfirmed (Oliver, 1980, 1993, Churchill and Surprenant, 1982), the perception of quality may also change.
Training motivation includes energizing, directing, and maintenance components (Noe and Schmitt, 1986, Colquitt et al., 2000, Kanfer, 1991). It is the force that influences the enthusiasm toward the training program, the stimulus that directs trainees to learn, and the persistence that will lead to the use of the newly acquired knowledge and skills, even in the presence of adversity and lack of reinforcement.
Measuring the perception of quality through motivation has several advantages: At the beginning of a course, the trainees may have a perception of quality based only on the opinions of others. But they are able to rate their motivation, i.e., the internal force that drives them towards the course and their goals. They know if they
are feeling energetic, enthusiastic, and persistent or if they are making a worthless effort, feeling discouraged, without vivacity, and wasting time. They can easily rate their motivation and justify it. After starting a course, the trainees start making their own quality judgments ("this is a good course"), and their motivational reaction to that experience may be considered a secondary effect of the experienced quality. In other words, the evolution of their motivation is an expression of the perceived quality. Another advantage of using motivation to measure quality is that changes in motivation have an immediate impact, while unexpected changes in the perceptions of quality may be revealed too late to let the company take action.
Following motivation can provide clues that help improve quality. For instance, if a trainee says that he feels unmotivated because the platform is often unavailable, the trainer is rude, or the program is of little interest to his current job and his career, that is expressive in terms of the perceived quality. That also points toward objective and specific actions that can be taken to improve the trainee's motivation, and, by the end of the day, his perception of quality.
3.
Conceptualizing Training Motivation and Quality
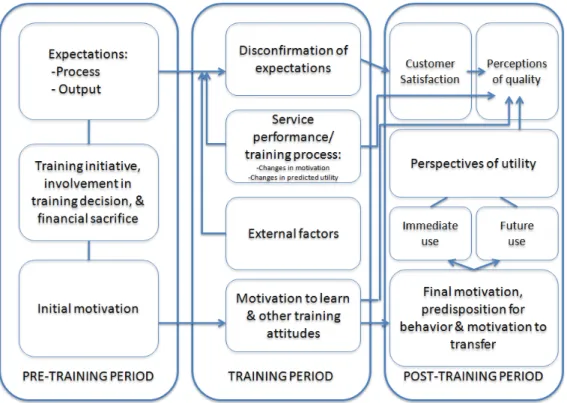
Figure 1 illustrates a dynamic model of training motivation. Initial or pre-training motivation and trainees' attitudes have received very little attention in the literature (Cohen, 1990), but initial motivation is what creates motivation to learn, which, in turn, has a direct impact on learning (Holton III, 1996). The expectations
created by the trainees before they engage in a training course (left panel in Figure 1) are related to the
training process and to the training utility, i.e., to the functional and outcome components of the training service (Grönroos, 1990). The outcomes of the training are valued for their expected utility. Different outcomes may be valued (Holbrook, 1999), such as job opportunities, promotions, fulfilment and self-esteem, fun, and social recognition. These expectations shape the trainingattitudes and the motivations of the trainees before they start a training course and the initial motivation mobilizes them to engage in the learning process. Those expectations are also related to the trainees’ own initiative to receive training, their involvement in the training decision, and the financial sacrifice in which they incur to follow the course.
Expectations created about the course play a relevant part in the motivational process. The individuals are motivated for tasks that are doable (Deci, 1975, Deci and Ryan, 1985, 1991): they will be motivated toward a course that provides the appropriate level of cognitive challenge but that they perceive as achievable. In addition, their expectancy, the predicted instrumentality (which is the belief that if you perform well, a valued outcome will be received), and the valence (which is the value that the individual places on the expected outcome) interact to create a motivational force (Vroom, 1964). This means that the trainees change their level of effort according to the value they place on the outcome of the training process and on the perception of the strength of the relationship between effort and outcome. They will not be motivated if they believe that they will not perform better after the learning effort, if they believe that the increased performance will not increase their rewards, or even if they do not value the rewards they will get.
During the course, the training attitudes, namely motivation, evolve and the initial expectations are disconfirmed (central panel in Figure 1). The disconfirmation of expectations is influenced by the service performance, i.e., the training process. Expectations are also shaped by external factors, which include changes in the workplace environment, the changes that occur in the trainees' job, and the closeness between the training objectives and the functions expected to be performed after the course (Noe and Schmitt, 1986).
At the end of the course (right panel in Figure 1), the perception of quality is influenced by the trainees’
perspectives of utility, which include short-term and long-term expected uses. The perceived utility is reflected on the trainees' predisposition to transfer and on predicted changes. The perception of quality is also influenced by the training process and the trainees' attitudes and these include satisfaction and motivation. At the end of the course, customer satisfaction and trainees' motivation get separate destinations:
a) Customer satisfaction, which depends on the disconfirmation of expectations (Oliver, 1980, 1993, Churchill and Surprenant, 1982), will influence future training decisions and the trainees' perception of quality.
b) Post-training motivation expresses reformulated expectations of utility, i.e., perspectives of utility, which are closer to effective use than the initial expectations of utility.
Figure 1: Dynamic approach to training motivation and perceived quality
4.
Retrieving Initial Motivation
Stated motivations, or needs, may evolve throughout the attendance of the course, especially if we look at education as transformation (Harvey and Green, 1993): as the trainees create their learning paths, they may find new needs or uses they were not considering when they started the course and may influence their motivation. Yet, although expectations have a major impact on the initial motivation to learn, attitudes and feelings may be decided after behaviour (Festinger and Carlsmith, 1959, Bem, 1972, Zanna and Cooper, 1974), i.e., after the trainees have started or completed the course. As a result, the hypothetical differences between the initial motivations and the perceptions about them at a later stage may be affected by the training itself. On the other hand, the opposite may occur, and initial beliefs, affects, or preferences may persist after disconfirmation (Ross et al., 1975, Sherman and Kim, 2002). For example, the trainees may show levels of motivation similar to the initial ones, even if they are disappointed with a course. In other words, we may expect a disconfirmation bias (Edwards and Smith, 1996, Lord et al., 1979), where individuals agree with what supports their beliefs, but also a consistency of beliefs (Higgins, 1987, Higgins et al., 1986a, Higgins et al., 1985, Higgins et al., 1986b). As Edwards and Smith (1996) pointed out, disconfirmation bias combines cognitive process and emotions as people tend to engage in a deliberative search of memory in an attempt to retrieve material for use in refuting the position advocated or the evidences.
Often, expectations, needs, and motivations cannot be identified before the consumption and are measured at the same time as the level of satisfaction, i.e., at the end of the course. Several reasons contribute to explain why researchers rely on ex post facto measures(Cohen et al., 2007): one is that the training companies may not wish to suggest possible service experiences to consumers before use. Another is that most companies do not have access to their customers before they purchase the service. Therefore, attitudes, motivation, and expectations are often measured ex-post. As a result, they are not anticipatory attitudes or expectations, but rather post-service judgments of prior attitudes or expectations. Two problems can arise from this practice. One is the possibility of individuals retrospectively making a biased judgment of their prior situation, influenced by their experience with the service. The other is that the individuals may also have been experiencing other services and living other experiences, and the retrieval of specific attitudes can be disturbed. Retrospective, recalled, or retrieved measures are valid, especially if the anticipations are clear and related to the particular service under analysis (Oliver, 1997). Even so, retrieved attitudes are higher for dissatisfied and complaining customers than for satisfied and non-complaining consumers, as negative experiences create higher expectancies, in retrospect, to justify the dissatisfaction (Halstead, 1993). As a
result, retrieved expectations, and motivations, can be biased and tending to align with experienced performance.
Influenced by Oliver’s (1980, 1993) disconfirmation paradigm of service quality and SERVQUAL (Parasuraman et al., 1988), our study also measures the bias in the process of recalling motivations.
In the perceived motivational gap, we have used a retrospective measurement of initial motivation, and the values of the perceived motivational gap reflect a comparative and conscious judgment. For example, if a trainee rates his final motivation lower than initial motivation, he is expressing, conscientiously, a decrease of his motivation during the course. The alternative to this ex post facto design (Cohen et al., 2007) is to compare
final motivation with the motivation the trainee had stated at the beginning of the course, i.e., the initial motivation stated at the beginning of the course. Table 1 compares the two methods of calculating the motivational gap and the two variables we have created to cover each alternative: the perceived motivational gap and the real motivational gap.
Table 1: Alternative ways of measuring initial motivation
Hypothesis 1 Hypothesis 2
Description Measurement of initial motivation at the beginning of the course and final motivation at the end of the course.
Measurement of both initial and final motivation at the end of the course.
Advantages Attitudes measured in the same time frame to which they are related.
One conscious comparative reaction about two moments of time.
Disadvantages The trainee may not recall how he rated initial motivation (he may be more motivated at the end than at the beginning but believe that he gave a lower rate to initial motivation and rate final motivation in such a way that it suggests a reduction of motivation along the course).
The trainee may not recall exactly what his motivation was at the beginning of the course. He assumes that he can recall it and that it is not influenced by his current (final) motivation.
Variable Real motivational gap Perceived motivational gap
5.
Method
5.1 Participants
We surveyed students of EVOLUI.COM, a provider of asynchronous e-learning for professional training with fifteen years of experience in the consumer e-learning market and 65.000 clients from 30 countries. The reasons for choosing EVOLUI.COM are related to its significant market share in Portuguese speaking countries such as Portugal, Brazil, Angola, Cape Verde, and Mozambique, as well as countries that traditionally welcome Portuguese-speaking immigrants such as France, Luxembourg, Canada, and Switzerland. The diversity of courses offered was also a reason for choosing EVOLUI.COM, as it would increase the study's generalizability: EVOLUI.COM offers about 230 short-term courses, in Portuguese, about diversified topics, such as management, design, foreign languages, healthcare, soft skills, pedagogy, and technology. The courses take up to 30 hours to be completed and range in length between 1 and 9 weeks.
The participants were attending courses at EVOLUI.COM, for which they had paid, and we asked them to answer two surveys, one at the beginning of the course, and the other at the end. None of these surveys were mandatory and the participants did not receive any reward for answering the surveys.
The 343 cases considered included registrations in 127 different courses. The longer courses took 9 weeks to be completed, and the shorter ones took only 1 week. The participants' age ranged from 22 to 64 years and 78.7% held a graduation degree. 11.1% of them were unemployed. The cases analyzed included students living in nine countries: Portugal, Spain, France, Switzerland, Holland, Angola, Cape Verde, and Mozambique. In order to diagnose potential biases, we confirmed that no individual course represented more than 5% of the sample. We also looked at the students who had not answer the surveys and tested if there were differences in terms of age, gender, country of origin, type of course, difficulty, and duration, trainees' situation facing employment, as well as any previous experiences with e-learning courses. We did not find any differences besides that regular students (defined as students who had already completed a course in the past 6 months) tended to decline the invitation to answer the surveys more often than first-time customers/students and that
78,5% of students that rated their motivation equal or lower than 5 at the beginning of the course were reluctant students.
5.2 Instruments and Procedures
We have used two online surveys adapted from Cação (2010). We have decided not to adopt repeated-measures or a longitudinal design, and rather measure motivation in two different surveys. The first survey was introduced at the beginning of the courses, and included questions about the motivations to attend the course, expectations of utility, general attitudes towards training, and (initial) motivation (Appendix 1 lists the relevant questions used in this analysis). The second survey was introduced at the end of the course as a satisfaction survey (Appendix 2). In this survey, the trainees were asked to rate satisfaction, perceptions of quality, final motivation and perceptions of what had been the initial motivation, perceptions of short and long-term utility, and several other issues related to service performance.
Both surveys used a 1 to 10 numeric scale, where 10 was the highest value. The surveys were made available online in a SCORM compliant file. The results were later analyzed with SPSS
.
In order to increase the validity of the study, we have asked other researchers to discuss the theoretical and internal validity of both surveys. We also tested the surveys using a pilot sample of 66 respondents and made minor adjustments based on them.
Over a period of three months, we have collected 582 responses to the first survey and 1099 to the second. 378 answers were paired, which means that, for the same course, the same trainee answered both surveys. Only the paired surveys were considered and the remaining data was discarded.
We faced two types of duplication of records: the first occurred when, for the same registration, the trainee submitted his answers twice in one, or both, surveys. In this situation, we considered the second answer, since the most probable reason for a repeated submission is the correction of an initial appreciation. Yet, we realize that, for the initial survey, we could have kept the first answer, as it could be closer to the initial expectations. The second kind of duplication occurred when the same trainee attended more than one course and, thus, had the opportunity to submit one survey for each registration. In this situation, we considered the first pair of answers and discarded the others, in order to ensure independency. After eliminating the duplicated answers, we kept 343 paired cases. Of these, none had more than 10% of missing values and 225 cases were totally complete. The internal consistency of the data was high (Cronbach alpha of .953).
6.
Results and Discussion
6.1 Perceived Motivational GapThe trainees were asked, at the end of the course, to rate their current motivation for the course and to express what they believed their motivation was at the beginning of the course. In other words, we have asked them to rate, comparatively and in a reflective way, their final motivation and their initial motivation (which was measured at the end of the course). In this way, the trainees were able to rank both motivations comparatively, and we were able to analyze the perception of both motivations at a certain moment of time.
In order to compare the two motivational variables, we have created a dummy variable, which we have labelled perceived motivational gap. The perceived motivational gap was computed as the difference between
final motivation and initial motivation, and was measured at the end of the course (Equation 1)
Perceived motivational gap = Mf – Mi1 Equation 1
where:
Mf = Final motivation
Mi1= Initial motivation perceived at the end of the course
The average perceived motivational gap was about zero (-.26), which suggested that there were no significant changes in the motivational level of the trainees. Even so, the Wilcoxon (1945) signed ranks test rejected, with 95% confidence, the hypothesis of final motivation being equal to initial motivation measured at the end of
the course (p-value = .013) except for the cases where final motivation was low (below 3) or equal to 8, which is the median value of final motivation.
The perceived motivational gap was an ascending curve and had positive values only for levels of final motivation equal to 9 or 10 (Column 6 in Table 2). For levels of final motivation below 9, the perceived motivation gap was negative and the lower the final motivation, the more negative the perceived motivational gap was. This is consistent with attitudes of dissatisfaction or of slight disappointment: if the trainees were not satisfied or had some kind of disappointment, they would state that their initial motivation was higher than the current motivation. This holds true even if the trainees state that their final motivation is moderate (e.g. 7 or 8), i.e., the trainees may report a moderate level of final motivation while stating that final motivation was not as high as initial motivation.
At lower levels of final motivation, a negative perceived motivational gap suggests demotivation and
dissatisfaction. Yet, at moderate levels of final motivation it may just indicate disappointment, tiredness, and minor unfulfilled expectations.
Table 2: Perceived motivational gap, real motivational gap, and perceptual bias of initial motivation Final
motivation
Percentage of cases
Perceived quality
Average Initial motivation
perceived at the end of the course
(Mi1)
Average Initial motivation measured
at the beginning
of the course (Mi0)
Perceived motivational
gap
Real motivational
gap
Perceptual bias of
initial motivation
(1) (2) (3) (4) (5) (6) (7) (8) 1 .30% 1
2 1.48% 4.60 6.60 8.20 -4.6 -6.20 -1.60
3 0.59% 2.00
4 2.96% 5.80 7.40 7.80 -3.40 -3.80 -0.40
5 5.03% 6.65 7.18 7.35 -2.18 -2.35 -0.17
6 9.17% 6.94 7.52 7.52 -1.52 -1.52 -0.00
7 13.31% 7.75 7.64 7.67 -0.64 -0.67 -0.03
8 24.56% 8.31 8.22 8.26 -0.22 -0.26 -0.04
9 24.26% 8.87 8.14 8.56 0.86 0.40 -0.42
10 18.34% 9.69 9.19 9.42 0.81 0.58 -0.23
6.2 Real Motivational Gap
Since we also had measured initial motivation at the beginning of the course, we were able to compare it with
final motivation. For that purpose, we have created a dummy variable, which we have labelled real motivational gap. This gap was computed as the difference between final motivation and initial motivation
measured at the beginning of the course (Equation 2).
Real Motivational Gap = Mf – Mi0 Equation 2
where:
Mf = Final motivation
Mi0= Initial motivation stated at the beginning of the course
The real motivational gap had a median value of 0. Unlike the perceived motivational gap, the real motivational gap had an average of – 4.5, which was highly influenced by very low levels of final motivation. The real motivational gap also followed an ascending curve and had negative values for levels of final motivation below 9, and positive values for levels of final motivation equal to 9 or 10 (Column 7 in Table 2).
Yet, the real motivational gap was always lower than the perceived motivational gap, except when final motivation was 6, in which situation both gaps were equal. Simply put, the real motivational gap was more
negative when the perceived motivational gap was negative and not so positive when the perceived motivational gap was positive.
In this scenario, we hypothesize that there may be some kind of perceptual bias. In other words, the trainees may have “adjusted” the initial perception of motivation as a function of the final motivation, bringing it closer to the latter. For instance, as the perceived motivational gap was higher than the real motivational gap for levels of final motivation equal to 9 or 10, this suggests a positive bias of the perception of what had been the initial motivation. This may hint the thought: ‘As I am very motivated now, at the end of the course, I must have been very motivated at the beginning’, which may cause an exacerbation of the current perception of initial motivation relatively to the one held at the beginning of the course. As the courses analyzed were short-term courses, we believe that the differences in the two measurements of initial motivation are due to a change in the perception rather than to problems in recalling the previous assessment.
In order to confirm H1, the hypothesis that there were no differences between the perceived and the real evolution of the motivation, we used the Mann-Whitney test (1947). The hypothesis of the two gaps being equal was rejected (p-value = 0,01), which suggests that there are differences between the perceived motivation and the real evolution of that motivation, even in short-term courses.
6.3 Perceptual Bias of Initial Motivation
The results of the real motivational gap suggest that service performance could have influenced the perception of the trainees about their initial motivation.
For that purpose, we have compared, for each level of final motivation, the same variable – initial motivation - measured at the beginning and at the end of the course. Our aim was to compare hypothetical changes in the trainees' perceptions of initial motivation and to confirm the existence of a perceptual bias.
We have created a dummy variable, which we have labelled perceptual bias of initial motivation. This bias is the difference between initial motivation perceived at the end of the course and initial motivation measured at the beginning of the course (Equation 3).
Perceptual bias of initial motivation = Mi1 - Mi0 Equation 3
Where:
Mi1= Initial motivation perceived at the end of the course Mi0= Initial motivation measured at the beginning of the course
The average perceptual bias of initial motivation was -.22. It never took positive values, but it was minimized for values of final motivation between 5 and 8 (column 8 in Table 2). The Wilcoxon (1945) signed ranks test rejected the hypothesis of the initial motivation perceived at the end of the course being equal to initial motivation measured at the beginning of the course (p-value = .019). In other words, it rejected the hypothesis of the perceptual bias of initial motivation being zero, which means that, for the sample analyzed, there was some kind of distortion on the perception of initial motivation. The second hypothesis we were aiming to confirm was, then, rejected.
Using Wilcoxon (1945) ranks, we have also tested if the perceptual bias of initial motivation could be zero in three different scenarios: when the perceived motivational gap was negative, zero, and positive. Whenever the perceived motivational gap was zero, we did not reject the hypothesis of the perceptual bias being also zero (Table 3) and we can consider that there was no perceptual bias. Yet, whenever the perceived motivational gap was negative or positive, we rejected the hypothesis of having a perceptual bias of zero.
As a result, whenever there was a perceptual motivational gap, there was also a perceptual bias on initial motivation. Simply put, with a 95% of confidence,
When Mf = Mi1, then Mi1 = Mi0 When Mf Mi1, then Mi1 Mi0 Where
Mf = Final motivation
Mi1= Initial motivation perceived at the end of the course Mi0= Initial motivation measured at the beginning of the course
Table 3: Perceptual bias of initial motivation and the perceived motivational gap Perceptual bias of initial motivation Perceived motivational
gap
N Average perceptual bias
p-value of perceptual bias of initial motivation
Conclusion
Missing cases 8 0.50 -
Negative 118 -0.36 0.002 Perceptual bias
Zero 134 0.09 0.541 No perceptual bias
Positive 83 1.24 0.000 Perceptual bias
Total cases 343
6.4 The Relation between the Gaps and the Perceptions of Quality
In order to test our third hypothesis, we analyzed the relation between the trainees' motivation and their perceptions of quality.
• Final motivation correlated strongly with perceived quality (Spearman rho of .806);
• The perceived quality of the course increased with the final motivation (column 3 in Table 2);
• The perceived and the real motivational gaps were minimized when the perceived quality was equal or higher than 8 (columns 3 and 4 in Table 4);
• The perceptual bias on initial motivation was minimized when the perceived quality was 5, 7, or 8,
and always negative or around zero (column 5 in Table 4).
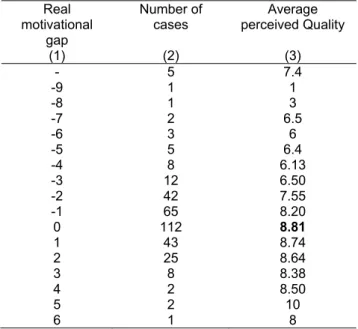
The average perceived quality was 8.23. The perceived quality was always below that average at negative values of the real motivational gap. At positive values of the real motivational gap, the average perceived quality was always higher than that (column 3 in Table 5). This suggests that negative real motivational gaps
can be related to lower perceptions of quality.
The perceived quality was also maximized when the real motivational gap was null (for which the average perceived quality was 8.81). It was also maximized when the real motivational gap was 5 but this scenario is not expressive, since only two cases fulfilled this situation. A similar situation happened with the perceived motivational gap: whenever this gap was negative, the perceived quality was below the average. At positive values of the perceived motivational gap, the average perceived quality was higher than the average (column 3 in Table 6).
Table 4: Perceptual bias of initial motivation and the perceived motivational gap Perceived
quality
Number of cases Perceived motivational gap
Real motivational gap
Perceptual bias on initial motivation
(1) (2) (3) (4) (5)
- 3 -0.67 -0.33 0.33 1 2 -6.00 -6.00
2 0 - - -
3 3 -4.00 -5.33 -1.33
4 0 - - -
5 10 -2.30 -2.30 0
6 18 -1.44 -2.28 -0.83
7 49 -1.33 -1.29 0.04
8 85 -0.21 -0.24 -0.02
9 104 0.34 -0.05 -0.38
Table 5: The real motivational gap and the perceived quality Real
motivational gap
Number of cases
Average perceived Quality (1) (2) (3)
- 5 7.4 -9 1 1 -8 1 3 -7 2 6.5 -6 3 6 -5 5 6.4 -4 8 6.13 -3 12 6.50 -2 42 7.55 -1 65 8.20
0 112 8.81
1 43 8.74 2 25 8.64 3 8 8.38 4 2 8.50 5 2 10 6 1 8
To confirm that the gaps were significant to explain the perceptions of quality, we have used linear regression. We have used the stepwise method (Efroymson, 1960) to follow the successive stages of introduction of variables in the regression model. The first model we have tested (Equation 4) explained 79.8% of the variability of perceived quality. In the second model (Equation 5, with the standardized betas), we have included the initial motivation measured at the beginning of the course, the real motivational gap, and the
perceived motivational gap. The inclusion of these three variables may sound redundant, as they are related. For instance, the real motivation gap includes the final motivation and the initial motivation measured at the beginning of the course, which are already included in the factor. Yet, all these variables helped improve the quality of the regression and multicollinearity was not a concern (VIF 2,77 and tolerance = 0,36). The goodness-of-fit improved from 0.798 to 0.822, which suggests that the added variables are relevant to explain the variability of the perceived quality.
Table 6: The perceived motivational gap and the perceived quality Perceived
motivational gap
Number of cases
Average perceived quality
(1) (2) (3) -
-9 1 1 -8 0 - -7 3 4.67 -6 1 3.00 -5 4 8.00 -4 8 6.50 -3 18 6.50 -2 38 7.34 -1 46 8.11 0 133 8.70 1 35 8.66 2 25 8.65 3 13 8.85 4 2 10.00 5 4 9.00 6 2 9.00 7 2 10.00
The improvement in the goodness-of-fit, as well as the original contribution of motivation to explain quality, confirms our third hypothesis that the motivation can be used as an indicator of quality.
Perceived Quality0 = X1 + X2 + X3 + X4 + X5 +X6 + X7+ X8 + X9 + X10 +Mf +Mi1 Equation 4
Perceived Quality1 = 2,396 + 0,219 X1 + 0,042 X2 + 0,129 X3 + 0,148 X4+ 0,044 X5 + 0,157 X6 + 0, 172 X7 + 0,15 X8 + 0,017 X9 + 0,054 X10 + 0,12 Mf + 0,11 Mi1 + 0,084 Mi0 + 0,106 RMG + 0,162 PMG
Equation 5
Where
Y = Perception of quality X1 = Global satisfaction X2 = Fulfillment of expectations X3 = Immediate professional utility X4 = Future professional utility X5 = Fulfillment of training objectives X6 = The platform and its functions X7 = Training contents X8 = The trainer’s expertise
X9 = The contribution of the forum for the learning process X10 = The dynamics and help from the trainer in the forum X11 = Competence, kindness, and promptness of the staff RMG = Real motivational gap, as defined in equation 2 PMG = Perceived motivational gap, as defined in equation 1
7.
Conclusions
In the online training company of our case, as in many other training companies, worldwide, two main categories of students turn up: those who pay for their tuition and those whose tuition is paid for by their employers. The former follow courses of their own choice, have high initial motivation, complete the courses in over 80% of the cases, come back for additional courses, and recommend them to their friends and family. We call them the willing students. The latter tend to follow courses selected by their employers, mostly on the basis of cost-effectiveness and legal obligations, rather than on relevance for the employees, and they are often required to take them in periods and within schedules that are not of their liking. They tend to attach little value to the courses, complain often, and achieve low rates of completion, or even drop out. We call them the reluctant students.
The motivation of the students influences their perception of quality, which, in turn, influences customer retention and future sales. It is, therefore, of critical importance for the training companies. Given the distinction between the two kinds of students, the perception of quality must be appreciated in context. For instance, a perception of quality of 70% is an unquestionable success if it comes from a reluctant student, but it can be damaging if it comes from a willing student. This means that the company must monitor the perceptions of quality attentively and take corrective actions that are adjusted to the students' profiles. In particular, it must follow carefully the reluctant students, so as to improve as much as possible their perceptions of quality.
As the motivations of the customers can be followed automatically, at the beginning and end of each learning event, by asking the students to fill in a form on the learning platform, the perceived and real motivational gaps, as defined in this paper, can be computed and thus used to help the training companies adjust their offer to the motivations of the students.
Our research lets us conclude that the perceived motivational gap and the real motivational gap can be used as indicators of quality in e-learning courses. They help evaluate the changes in the trainees' motivation, as well as the differences in their perceptions of quality.
We have found out that the real motivational gap was more negative when the perceived motivational gap
was negative and not so positive when the perceived motivational gap was positive. We have also found out that there is a perceptual bias on initial motivation when the perceived motivational gap is not null. This means that the trainees may have “adjusted” their perception regarding the initial motivation as a function of their final motivation, bringing it closer to the latter. The relationship between the proposed gaps and the perceptions of quality was also exposed: the gaps were minimized at higher levels of perceptions of quality and when they were positive, the perception of quality was higher than average.
These results are useful as they create insights on perceptions of quality in an indirect way, i.e., without asking the trainees to think about what they believe quality is, in order to quantify it. They also enable training companies to create additional and complementary indicators of quality of e-learning courses that can help explain changes in perceptions of quality.
The two indicators of quality that we propose are not to be used alone. They must be complemented with other indicators to provide an overall idea of what the student thinks about the quality of the course. Yet, they are easily measured and they can help trainers rethink their pedagogical strategy, which, in turn, can improve the overall perception of quality of the course.
Even so, our study has limitations that we have to acknowledge. We were not able to find what led to the changes in motivation. In addition, we cannot tell if the perceptual bias on initial motivation is due to the training experience itself or to the passage of time and the regular distortions of memory and retrieval. We suggest that the motivational gaps and the perceptual bias on initial motivation should be studied in other learning contexts and even in courses with longer lengths. We also suggest that both gaps, as well as the
perceptual bias on initial motivation, should be included in studies about quality in e-learning.
References
AHL, H. 2006. Motivation in adult education: a problem solver or a euphemism for direction and control? International Journal of Lifelong Education, 25, 385-405.
BEM, D. J. 1972. Self-perception theory. In: BERKOWITZ, L. (ed.) Advances in experimental social psychology. New York: Academic Press.
BYRNES, J. 1996. Cognitive development and learning in instructional contexts, Boston, Allyn and Bacon. CAÇÃO, R. 2010. Perceptions of quality in e-learning: a case study. Available:
https://www.academia.edu/272280/Perceptions_of_quality_in_e-learning_a_case_study [Accessed 11 January 2016].
CHURCHILL, G. A., JR. & SURPRENANT, C. 1982. An investigation into the determinants of customer satisfaction. Journal of Marketing Research, 19, 491-504.
COHEN, D. J. 1990. The pretraining environment: a conceptualization of how contextual factors influence participation motivation. Human Resource Development Quarterly, 1, 129-137.
COHEN, L., MANION, L. & MORRISON, K. 2007. Research methods in education, London, Routledge.
COLQUITT, J. A., LEPINE, J. A. & NOE, R. A. 2000. Toward an integrative theory of training motivation: A meta-analytic path analysis of 20 years of research. Journal of Applied Psychology, 85, 678-707.
DECI, E. L. 1975. Intrinsic motivation, New York, Plenum.
DECI, E. L. & RYAN, R. M. 1985. Intrinsic motivation and self-determination in human behavior, New York, Plenum.
DECI, E. L. & RYAN, R. M. 1991. Intrinsic motivation and self-determination in human behavior. In: STEERS, R. M. & PORTER, L. W. (eds.) Motivation and work behavior. 5th ed. New York: McGraw-Hill, Inc.
DEROS, B. M., RAHMAN, N., RAHMAN, M. N. A., ISMAIL, A. R. & SAID, A. H. 2009. Application of quality function
deployment to study critical service quality characteristics and performance measures. European Journal of Scientific Research [Online]. Available:
http://xa.yimg.com/kq/groups/24709041/207992995/name/TUGAS+SEBELUM+UAS.PDF [Accessed 26 January 2016]. DEWEY, J. 1916. Democracy and education, New York, Kessinger Publishing Co.
DEWEY, J. 1925. Experience and nature, New York, Kessinger Publishing Co.
DONABEDIAN, A. 1980. Explorations in quality assessment and monitoring, Ann Arbor, MI, Health Administration Press. DROR, S. 2007. Deployment of service quality characteristics. World Academy of Science, Engineering and Technology
[Online], 30. Available: http://waset.org/publications/6154/deployment-of-service-quality-characteristics [Accessed 26 January 2016].
EDWARDS, K. & SMITH, E. E. 1996. A disconfirmation bias in the evaluation of arguments. Journal of Personality and Social Psychology, 71, 5-24.
EFROYMSON, M. A. 1960. Multiple regression analysis. In: RALSTON, A. & WILF, H. S. (eds.) Mathematical methods for digital computers. New-York: Wiley.
EHLERS, U.-D. 2004. Quality in e-learning from a learner's perspective. European Journal of Open, Distance and e-Learning [Online]. Available: http://www.eurodl.org/materials/contrib/2004/Online_Master_COPs.html [Accessed 16 January 2016].
EHLERS, U.-D., GOERTZ, L., HILDEBRANDT, B. & PAWLOWSKI, J. M. 2005. Quality in e-learning - Use and dissemination of quality approaches in European e-learning. European Centre for the Development of Vocational Training (CEDEFOP) [Online]. Available: http://www.rcc.gov.pt/SiteCollectionDocuments/Qualitye-learning05.pdf [Accessed 18 January 2016].
FESTINGER, L. & CARLSMITH, J. M. 1959. Cognitive consequences of forced compliance. Journal of Abnormal and Social Psychology, 58.
FREIRE, P. 1985. The Politics of education: Culture, power and liberation, London, Macmillan. FREIRE, P. 1992. Pedagogy of hope, London, Continuum.
FREIRE, P. 1998. Pedagogy of freedom - Ethics, femocracy and civic courage, Oxford, Rowman & Littlefield Publishers Inc. FRYDENBERG, J. 2002. Quality standards in e-learning: A matrix of analysis. The International Review of Research in Open
and Distance Learning, 3.
GRÖNROOS, C. 1990. Relationship approach to marketing in service contexts: The marketing and organzational behaviour interface. Journal of Business Research, 20, 3-11.
GRÖNROOS, C. 2007. Service management and marketing: Customer management in service, West Sussex, England, John Wiley and Sons Ltd.
HALSTEAD, D. 1993. Exploring the concept of retrieved expectations. Journal of Consumer Satisfaction, Dissatisfaction and Complaining Behavior, 6, 56-62.
HARVEY, L. & GREEN, D. 1993. Defining quality. Assessment and Evaluation in Higher Education, 18, 9–34. HAYES, S. 2015. MOOCs and Quality: a Review of Recent Literature. Available:
http://www.qaa.ac.uk/en/Publications/Documents/MOOCs-and-Quality-Literature-Review-15.pdf [Accessed 26 January 2016].
HIGGINS, E. T. 1987. Self-discrepancy: A theory relating self and affect. Psychological Review, 94, 319-340. HIGGINS, E. T., BOND, R. N., KLEIN, R. & STRAUMAN, T. 1986a. Self-discrepancies and emotional vulnerability: How
magnitude, accessibility, and type of discrepancy influence affect. Journal of Personality and Social Psychology, 51, 5-15.
HIGGINS, E. T., KLEIN, R. & STRAUMAN, T. 1985. Self-concept discrepancy theory: A psychological model for distinguishing among different aspects of depression and anxiety. Social Cognition, 3, 51-76.
HIGGINS, E. T., STRAUMAN, T. & KLEIN, R. 1986b. Standards and the process of self-evaluation: Multiple affects from multiple stages. In: SORRENTINO, R. M. & HIGGINS, E. T. (eds.) Handbook of Motivation and Cognition: Foundations of Social Behavior. New York: Guilford Press.
HOLBROOK, M. B. 1999. Introduction to consumer value. In: HOLBROOK, M. B. (ed.) Consumer value: A framework for analysis and research. New York: Routledge.
HOLTON III, E. F. 1996. The flawed four-level evaluation model. Human Resources Quarterly, 7, 5-21. JURAN, J. M. & GRYNA, F. M. 1993. Quality planning and analysis, McGraw-Hill.
KALLGREN, C. A. & WOOD, W. 1986. Access to relevant information in memory as a determinant of attitude-behavior consistency. Journal of Experimental Social Psychology, 22, 328-338.
KANFER, R. 1991. Motivation theory and industrial and organizational psychology. In: DUNNETTE, M. D. & HOUGH, L. M. (eds.) Handbook of industrial and organizational psychology. Palo Alto, CA: Consulting Psychologists Press. KAZMER, M. M. & HAYTHORNTHWAITE, C. 2005. Multiple perspectives on online learning. ACM SIGGROUP Bulletin, 25,
7-11.
KOTLER, P., ARMSTRONG, G., SAUNDERS, J. & WONG, V. 1996. Principles of marketing, Hertfordshire, Prentice Hall. LORD, C., ROSS, L. & LEPPER, M. 1979. Biased assimilation and attitude polarization: The effects of prior theories on
subsequently considered evidence. Journal of Personality and Social Psychology, 37, 2098-2109.
MANN, H. B. & WHITNEY, D. R. 1947. On a test of whether one of two random variables is stochastically larger than the other. Annals of Mathematical Statistics, 18, 50–60.
MENDELSOHN, P. 1994. Le transfert de connaissances: la pierre philosophale de l'enseignant. Conférence introductive au Colloque sur les "Transferts de Connaissances". Lyon.
MUKHOPADHYAY, M. 2005. Total quality management in education, New Delhi, Sage Publication.
NOE, R. A. & SCHMITT, N. 1986. The influence of trainee attitudes on training effectiveness: Test of a model. Personnel Psychology, 39, 497-523.
OLIVER, R. L. 1980. A cognitive model of the antecedents and consequences of satisfaction decisions. Journal of Marketing Research, 17, 460-469.
OLIVER, R. L. 1993. A conceptual model of service quality and service satisfaction: Compatible goals, different concepts. In: SWARTZ, T. A., BOWEN, D. E. & BROWN, S. W. (eds.) Advances in services marketing and management: Research and practice. Greenwich, CT: JAI Press.
OLIVER, R. L. 1997. Satisfaction - A behavioral perspective on the consumer, New York, McGraw-Hill.
PACKER, M. 2001. The problem of transfer, and the sociocultural critique of schooling. Journal of the Learning Sciences, 10, 493-514.
PARASURAMAN, A., ZEITHAML, V. A. & BERRY, L. 1988. SERVQUAL: A multiple-item scale for measuring consumer perceptions of service quality. Journal of Retailing, 64, 12-40.
ROSS, L., LEPPER, M. R. & HUBBARD, M. 1975. Perseverance in self-perception and social perception: biased attributional processes in the debriefing paradigm. Journal of Personality and Social Psychology, 32, 880-892.
SHERMAN, D. K. & KIM, H. S. 2002. Affective perseverance: The resistance of affect to cognitive invalidation. Personality and Social Psychology Bulletin, 28, 224-237.
TERGAN, S.-O. & SCHENKEL, P. 2004. Ein instrument zur beurteilung des lernpotenzials von e-learning. In: TERGAN, S.-O. & SCHENKEL, P. (eds.) Was macht e-learning erfolgreich? Grundlagen und instrumente der qualitätsbeurteilung. Berlin: Springer.
VROOM, V. H. 1964. Work and motivation, New York, Wiley.
VYGOTSKY, L. S. 1934. Thought and language, Cambridge, MA, The Massachusetts Institute of Technology. WILCOXON, F. 1945. Individual comparisons by ranking methods. Biometrics, 1, 80-83.
ZANNA, M. P. & COOPER, J. 1974. Dissonance and the pill: An attribution approach to studying the arousal properties of dissonance. Journal of Personality and Social Psychology, 29, 703-709.
Appendix 1
Using a scale of 1 to 10, where 10 is the highest value, please rate:
1 2 3 4 5 6 7 8 9 10 1. Your motivation towards the course
2. Your expectations of utility about the course
Appendix 2
Using a scale of 1 to 10, where 10 is the highest value, please rate:
1 2 3 4 5 6 7 8 9 10 1. Your global satisfaction
2. The degree of fulfillment of your expectations 3. Your initial motivation
4. Your current motivation
5. The degree of fulfillment of training objectives 6. The quality of the platform and its functions 7. The quality of the training contents
8. The trainer's expertise 9. The contribution of the forum
10. The dynamics and help of the tutor in the forum 11. The competence, kindness, and promptness of the staff 12. The immediate utility of the course to your current job 13. The utility of the course in the future
14. Your global quality perception 15. The quality-price relation
ISSN 1479-4403 17 ©ACPIL
Traditions With Clinical Distance Learning
Laura E Delgaty
School of Medical Education, The Medical School, Newcastle University, Newcaslte Upon
Tyne
Abstract: With the uptake of distance learning (DL), which has actually been marginal for most academics, teaching contexts, traditional power structures and relationships have been transformed, leaving lecturers potentially disenfranchised. Institutional and cultural change is vital, particularly changes concerning academic roles. The advent of DL has caused role ambiguity; however published literature related to academic roles is confusing and lacks clear guidance. For academics involved in post graduate clinical education, information is even more incomplete. Using a framework of communities, this study is a direct response to these concerns. The aim was to systematically and critically evaluate the implementation of clinical DL in an effort to improve practice.
Maintaining a practitioner inquiry methodology, this study investigated the development and delivery of a new DL module. Data collection consisted of documentary analysis of meetings, interviews with staff and students, student evaluations and analytics. Data analysis incorporated both quantitative and qualitative methods to triangulate the research findings. New competencies for academics emerged, including leadership and management. Barriers to staff progress included: ambiguity in roles, lack of leadership and unpreparedness for responsibilities, time, and workload. Student barriers included: time, fear, relevance of learning, isolation and increased autonomy. Explicit planning, organisational support and working within communities were requisite to create a ‘sustaining’ technology.
This study contributes to educational practice on two levels. Firstly, by striving for rigour, it demonstrates that practitioner inquiry is a legitimate research approach that is accessible and valuable to teachers. Secondly, it adds to useful and applied knowledge concerning DL practice. Avoiding traditional workload assumptions that are erroneous and inaccurate, this study provides new models of organisational roles and responsibilities. The results challenge the evolutionary nature of academia, suggesting working in communities and new competencies are required whilst traditional roles and culture must be redefined.
Keywords: Distance learning, clinical education, academic staff, competencies, communities
1.
Introduction to Problem
Learning technologies and distance approaches to teaching are being increasingly deployed in Higher Education (HE). There is pressure for academics to become more involved in distance learning (DL), although there has been both academic resistance (Ellaway, 2011) and lack of acceptance (Baran et al., 2011). This may be related to the well documented difficulties for academics including: confusion concerning the organizational culture (Briggs, 2005), a dearth of clear guidance (Ryan et al., 2004) and poor organisational support (Curtis, 2001) with DL innovations. Interestingly, in DL research, initially, the focus was on technological, practical and pedagogical aspects, but Casanovas (2010) suggests that we have failed to embed these innovations and change into educational institutions and organisational change is required. One of the major changes necessary concerns roles and competencies of academics (Baran et al., 2011). Academic roles have evolved over time and until recently, there was a relatively clear view of what that role encompassed. However, the advent of DL has led to a lack of clarity around academic identities and confusion over both roles and responsibilities (Wilbur, 2016, Baran et al., 2011). This clarity is essential as it is well documented that role ambiguity leads to job dissatisfaction and decreased performance in academics (Delgaty, 2015, Briggs, 2005). To further obscure the picture for those involved in clinical postgraduate education, the majority of research on DL has focused on undergraduates or children and has not focused on health professionals as learners (Cook, 2009).
1.1 Organisational Change
The majority of research on change in HE has not focused on DL, but on the removal of the two-tiered system and internationalisation (Robertson et al., 2009).While the majority of DL research has focused on student experience and implementation strategies, there is a less detailed understanding of how DL impacts the
culture, roles and identities of staff (Hanson, 2009, Conole, 2004). In Rethinking Pedagogy for the Digital Age, Beetham and Sharpe agree and warn in the implementation of e-learning technologies ‘the problem ... is more about the human and organisational aspects…..than it is about the use of technology’ (Beetham and Sharpe, 2007, p. xvi). The challenge for universities is not about how to use technology, but how to manage the changes due to technology.
Unequivocally, with the implementation of DL in HE, given the traditional paradigms that exist, significant modifications of existing models are necessary (Conole, 2002; Nunes & McPherson, 2002) that may threaten the evolutionary model of change within HE. Briggs (2005) warns that clarity concerning DL in HE has actually been insufficiently resilient in the face of change and roles of academics and the environment in which they are expected to work have changed. Finally, Blass and Davis (2003) suggest that the greatest need for change falls on the academic and the academic role must be fundamentally redefined and challenged. It is clear, universities, in general, need to re-examine academic roles related to DL, as the fundamental nature of teaching is changing. When looking specifically at DL and health care education, the findings are similar. Pettersson and Olofsson (2015) suggest that there are organizational conflicts in implementing DL whilst Wilbur (2016) advises there are unresolved challenges at both programme and faculty level when introducing DL into clinical education.
1.2 Role Change
The changing identities of academics involved in DL are supported in the literature (Delgaty, 2015, Pettersson and Olofsson, 2015, Hanson, 2009, Hovenga and Bricknell, 2006, Beaudoin, 1990) and the roles of academics are being threatened (Wilson, 2004) For academics, freedom is being threatened by the drive away from autonomous decisions and academic standards (Peterson, 2001) towards the new pressure of online delivery. However, Wilbur (2016) suggests how these roles are changing and how to actually change them is unclear. Briggs (2005) specifically addressed academic competencies in DL initiatives and warned organisations must define roles and develop frameworks to address the organisational and personal development challenges introduced by DL. A competent online teacher is a new and different role for academics, the competencies required are different and this is an area that is poorly understood. If academics are expected to create effective DL materials for clinicians, how can they plan workloads, create effective learning opportunities and be empowered to argue for resources if they are not prepared for the roles and responsibilities required? Research that informs and shares good practice is one way. Recently, the most cited article in Medical Teacher, a seminal journal in clinical education, was David Cook’s: ‘The Failure of e-Learning Research to Inform Educational Practice, and What We Can Do About It’. Cook (2009) suggests we have been asking the wrong questions and to inform practice, we need to consider issues of both the institutional infrastructure and context.
What little, relevant DL literature that has been published suggests communities may be a practical tool to improve relationships and avoid this role crisis (Holley & Oliver, 2000), as an area essential in future research (Baran et al., 2011) and as a topic that would advance scholarship in DL related to in clinical education (Ellaway, 2011). This paper is a direct response to these arguments. Maintaining a practitioner inquiry (PI) methodology, this study focused on developing and delivering a DL module from both a staff and student perspective. Using a framework of communities, the inquiry questions are outlined below and were focused on informing frontline academic and institutional practice
1.2.1 Inquiry questions:
• What are the collaborative staff experiences when developing a DL module?
• What was the role of the academic during the development and delivery of a DL module?
• What obstacles were encountered by staff and students and how were they overcome during the development and delivery of a DL module?
1.3 Context
When reviewing literature on DL, the lack of information regarding context makes it difficult to apply the results to other settings and as a result difficult to inform practice. In three systematic reviews concerning DL in health care professionals (Lam-Antoniades et al., 2009, Khan and Coomarasamy, 2006, Wutoh et al., 2004) context was not specifically addressed and no effort was made to obtain additional information from authors. Cook et al. (2008), in a meta-analysis of DL and health care professionals, suggested that most of the literature