ISSN: 2252-8938, DOI: 10.11591/ijai.v9.i3.pp429-438 429
Comparison between SVM and KNN classifiers for iris
recognition using a new unsupervised neural approach in
segmentation
Hicham Ohmaid1, S. Eddarouich2, A. Bourouhou3, M.Timouyas4
1National School of Computer Science and Systems Analysis (ENSIAS), Mohammed V University, Rabat/10112,
Morocco
2Regional Educational Center, Rabat/10112, Morocco
3,4Higher Normal School of Technical Education (ENSET), Mohammed V University, ENSET, Rabat/10112, Morocco
Article Info ABSTRACT
Article history: Received Dec 12, 2019 Revised Feb 17, 2020 Accepted Mar 19, 2020
A biometric system of identification and authentication provides automatic recognition of an individual based on certain unique features or characteristics he or she possesses. Iris recognition is a biometric identification method that applies pattern recognition to images of the iris. Owing to the unique epigenetic patterns of the iris, iris recognition is considered one of the most accurate methods in the field of biometric identification. The segmentation algorithm proposed in this article starts with determining the regions of the eye using unsupervised neural approach, after the outline of the eye is found using the Canny edge, The Hough Transform is employed to determine the center and radius of the pupil and the iris. Then the normalization allows transforming the segmented circular iris region into a fixed-size rectangular shape using Daugman’s rubber sheet model. A discrete wavelet transformation (DWT) is applied to the normalized iris to lower the size of iris models and to improve classifier accuracy. Finally, the URIBIS iris database is used for individual user verification by using the KNN classifier or support vector machine (SVM) which based on the analysis of iris code as feature extraction is discussed.
Keywords: Biometric
Discrete wavelet transformation Hough transform
Iris segmentation
K-nearest-neighbor (KNN) Support vector machine (SVM) kernel function
Unsupervised neural approach
This is an open access article under the CC BY-SA license.
Corresponding Author: Hicham Ohmaid,
National School of Computer Science and Systems Analysis (ENSIAS), Mohammed V University, Rabat/10112, Morocco.
Email: [email protected]
1. INTRODUCTION
Nowadays, biometric recognition has become a reliable way to identify and recognize individuals. Conventional authentication methods like passwords and identification cards are not always credible because these methods can be forgotten or stolen. Identification based on physiological or behavioral characteristics of people (such as irises, fingerprints, faces, hand geometry, signatures, fingerprints, et cetera) can accurately authenticate people’s identity [1].
Iris recognition offers the highest accuracy in identifying individuals compared to any other biometric approaches. The iris is defined as the circular part between the pupil and sclera of the eye. It is so unique that no two irises are alike, even among identical twins or between the left and right eye of the same person [2-3]. These visible characteristics are thought to be discriminatory and unique to each eye, as well as stable over an individual’s lifetime. This makes the iris a very useful biometric identifier when it is possible to capture iris images of sufficient quality [4].
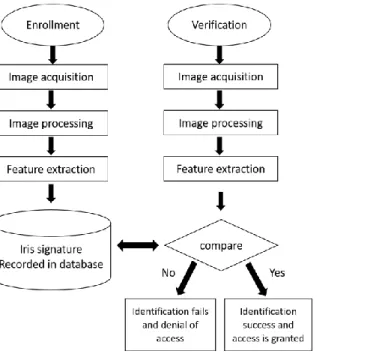
The system is inspired by Daugman’s work [5]. It is composed of a number of sub-systems, which are described in Figure 1 and Figure 2 the contains stages of an iris detection system.
The segmentation step enables the localization of the iris region in an eye image, which consists of finding two contours of the iris (pupil and iris). In other words, the internal contour (pupil/iris) and outer (iris/sclera) are located. Once the iris region is segmented, the next stage is to normalize this segmentation. The normalization transforms the iris texture from Cartesian to polar coordinates in order to limit the problems of variations in the eye (like the optical size of the iris or the position of the pupil in the iris). This step is based on Daugman's rubber sheet model [5]. Feature extraction is a technique used to extract information from the iris image, in order to lower the size of iris models and improve classifier accuracy. These features can not be used to reconstruct images, but these values are used in classification. Finally, matching is performed by comparing the features of a template iris with the feature vectors of templates in the database, and a decision is formulated [6-7].
Figure 1. Iris recognition system Figure 2. Typical stages of iris recognition
The main motivation in this research is to propose a new effective and robust algorithm to segment and classification the clear or noisy iris images. The proposed algorithm added a new pre-processing step using a new unsupervised neural approach to divide the iris image in two regions namely iris and eyelashes region, sclera and skin, in order to facilitate the determination of the iris contour in the phase Canny edge detection [8]. Unlike other iris segmentation algorithms, that process the whole image of the eye (which contains the non-iris regions that generate segmentation errors) such as Daugman algorithms. Then, discrete wavelet transformation (DWT) is used for extracting the optimum features of iris images and reducing the runtime of classification of these iris templates. Finally, a comparison was made between the classifiers SVM and KNN.
2. METHODOLOGY
The iris recognition system consists of the following steps: Image acquisition
Iris segmentation Normalization Feature extraction Classification
In the approach presented here, segmentation was achieved using the Hough transform with the aim of locating the iris region of an eye image. The normalization enabled the transformation of the segmented
circular iris region into a fixed-size rectangular shape using Daugman’s rubber sheet model. Two level discrete wavelet transformation (DWT) was applied to the normalized iris for feature extraction. The support vector machine was used to classify the similarity between the iris templates. Figure 3 shows a diagram of the iris recognition system.
Figure 3. Diagram of iris recognition system
2.1. Iris segmentation
In this section, we present a new iris segmentation approach used as a pre-processing step, based on neural competitive concepts [9]. As shown in Figure 4, this approach allows partitioning the iris image in two regions namely iris and eyelashes region, sclera and skin. Then, the outline of the eye is found using the Canny edge, The Hough Transform is employed to determine the center and radius of the pupil and the iris. Figure 4 shows the iris segmentation steps.
2.1.1. Iris segmentation using the unsupervised neural approach
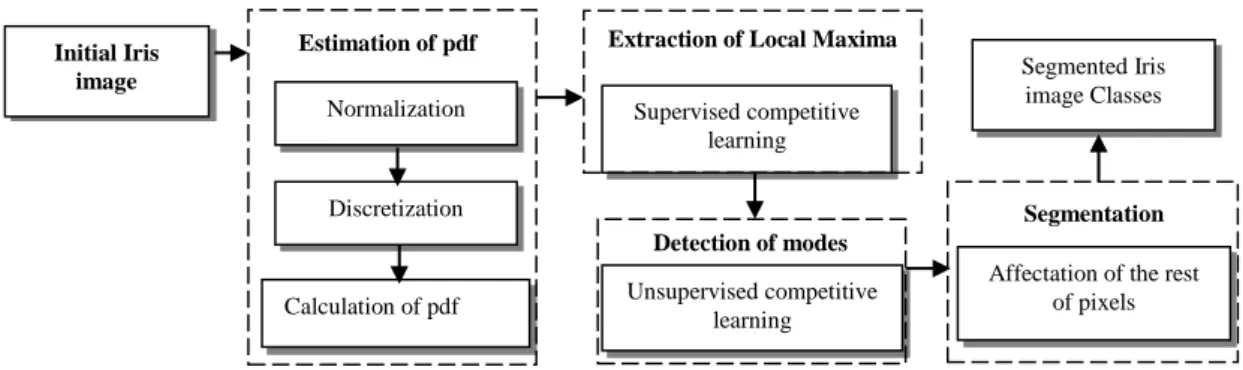
In an unsupervised context, that means when no prior information about the data sample, we involve the neural competitive clustering procedure to the Iris segmentation. The objective of these approaches to classifying the image pixels according to their distribution in the representation space and to assign them a label. As illustrated in Figure 5, it starts first by the organizationIt starts first, by the organization of the pixels of Iris image in an observation matrix (each row represents a pixel and each column represents an attribute) to estimate the underlying probability density function (pdf)of the pixels distribution using a non-parametric estimator. In the second step, the procedure uses an artificial neural network with competitive training (NNCT) to extract the local maxima of the pdf. Following a modes detection method using a technique to detect the existing interneural connection [10]. The last step is for affecting the remaining pixels to their classes.
Figure 5. Architecture of the segmentation procedure
2.1.2. The estimation of underlying probability density function
After constructing the observation matrix of an Iris image pixelsΓ = {𝑋1, 𝑋2, … , 𝑋𝑄}considering as a
set of Q N-dimensional observations (in this case N=3) With X𝑞= [𝑥𝑞,1, 𝑥𝑞,2, … , 𝑥𝑞,𝑛, … , 𝑥𝑞,𝑁], q=1,2,...,Q
and a probability density function P(X), anon-parametric method based on The Parzen [11] window using to estimate this underlying density function. The technique is a fast estimation algorithm that is proposed by Postaire and Vasseur [12]. First, the range of variation of each component of these observations is normalized to the interval [0, R], where R is an integer such as 𝑅 ≥ 2, by means of the transformation defined as:
𝑦𝑛,𝑞=
(𝑥𝑛,𝑞−𝑚𝑖𝑛 𝑞 𝑥𝑛,𝑞) (𝑚𝑎𝑥
𝑞 𝑥𝑛,𝑞−𝑚𝑖𝑛𝑞 𝑥𝑛,𝑞)
∗ 𝑅 (1)
Each axis of the so normalized data space is then partitioned into R exclusive intervals of unit width. This discretization defines a set of 𝑅𝑁hypercube of unit side length. Each hypercube noted 𝐻(𝑋),
is a site defined by its N coordinates 𝑥1, 𝑥2, … , 𝑥𝑛, … , 𝑥𝑁 which are the integer parts of the coordinates
of its centre X. To be more specific, let 𝑌𝑞 = [𝑦1,𝑞, 𝑦2,𝑞, … , 𝑦𝑛,𝑞, … , 𝑦𝑁,𝑞], q=1, 2, Q be the Q observations in
the normalized space. Each observation Yq is found inside a non-empty hypercube with the coordinates 𝑥𝑛= 𝑖𝑛𝑡(𝑦𝑛,𝑞), n=1, 2, N, where 𝑖𝑛𝑡(𝑦𝑛,𝑞) designates the integer parts of 𝑦𝑛,𝑞. If several observations fall in
the same hypercube, this one appears many times on the list of non–empty hypercubes. Furthermore, the number of times the hypercube H(X) appears in that list indicates the number of data points q[H(X)] which falls in this hypercube. Subsequently, the value of the local density estimated is:
𝑝(𝑋) =𝑞[𝐻(𝑋)]
𝑄 (2)
Since the volume of H(X) is equal to unity.
So, this fast procedure allows only the estimation of the underlying probability density function at the centers of the non-empty hypercube whose number never exceeds the number Q of available observations (pixels). At the centers of the hypercube cells, which are not on that list, the density estimates are known to be null. At the end of this fast algorithm, all the available information for clustering is in the discrete set 𝑋 of estimated values of the underlying probability density function 𝑃(𝑋).
Initial Iris image
Normalization
Discretization
Calculation of pdf
Estimation of pdf Extraction of Local Maxima
Supervised competitive learning
Detection of modes
Unsupervised competitive learning
Segmented Iris image Classes
Segmentation
Affectation of the rest of pixels
2.1.3. The extraction of local maxima by neural network
Assimilating the modes to the local maxima of the pdf, the proposed approach uses the Neural Networks with Competitive Training (NNCT) [13]. In the training algorithm, we work only on the pdf by presenting sequentially, the centers of the non-empty hypercube of the set X to the network, instead of the Q observations.
The neural network is composed of two layers: the input layer and the output layer. The first one is made of N units 𝐼𝑛, n=1,2,...,N, such that unit 𝐼𝑛 is solicited by the attribute XN of the non-empty hypercube
H(X) when this one is presented to the network. However, each output neuron materializes a hypercube which represents the site of one local maximum of the pdf in the set X, and presents its weight by the mean vector 𝜇𝑘(𝑋), k=1,2,…,K. The number of the output neuron is first initialized arbitrarily.
During the training phase, the output neurons enter into competition with each other by comparing the distance 𝐷[𝜇𝑘(𝑋) , 𝐻(𝑋)], k=1,2,…,K, between the input hypercube H(X) and each output neuron 𝜇𝑘(𝑋),
the winner is the closest one to the hypercube, then we compare the values of the pdf associated to the winner neuron 𝜇𝑔(𝑋) and to H(X). The distance measure used in this training algorithm is Mahalanobis distance that
gives the best results for the non-Gaussian distribution [14] instead of Euclidian distance as in the (NNCT). 2.1.4. Detection of significant modes of pdf
The aim of this phase is to connect each group of the closest modes in such a way that we get a map which preserves the shape and structure of the classes existing in the image, by an improved Competitive Hebbian Learning method (CHLim) [10] which allows eliminating the influence of the output neural number. To generate the induced Delaunay triangulation, the CHLim, given the K modes detected by CNN as prototypes in RN, successively adds connections among them. The method does not change the weight of prototypes, but only generates topology according to these prototypes. For each mode H(𝑋𝑘),
can be connected to the two closest prototypes by an edge using Mahalanobis distance as a measure of resemblance instead of Euclidian distance, it works as an activation function for competition between neurons. This leads to the induced Delaunay triangulation, which is limited to those regions of the input space 𝑅𝑁.
2.1.5. Classification procedure
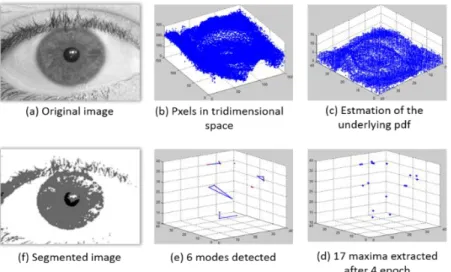
Once the different modes are identified, the classification method [15] that we use in the present work consists first, in defining the pixels falling into any mode of a connected set as the prototype of one cluster. Then, the remaining pixels, which do not fall in one of the detected modes, are assigned to the clusters attached to their nearest neighbor among these prototypes by means of Mahalanobis distance. Figure 6 presents the procedure for classifying the iris image.
Figure 6. Illustration of the Iris segmentation procedure
2.1.6. Hough transform
Hough transform is a standard image analysis tool for finding curves that can be defined in a parametrical form such as lines, circles, parabolas, and hyperbolas [16]. The edge map is then used in a
voting process to maximize the defined Hough transform for the desired contour. Considering the obtained edge points as (xj ; yj), j = 1; 2; ……, n, a Hough transform can be written as:
𝐻(𝑥𝑐, 𝑦𝑐, 𝑟) = ∑𝑛𝑗=1ℎ(𝑥𝑗, 𝑦𝑗, 𝑥𝑐, 𝑦𝑐, 𝑟) (3)
Where
ℎ(𝑥𝑗, 𝑦𝑗, 𝑥𝑐, 𝑦𝑐, 𝑟) = {1 𝑖𝑓 𝑔(𝑥𝑗, 𝑦𝑗, 𝑥𝑐, 𝑦𝑐, 𝑟) = 0
0 𝑜𝑡ℎ𝑒𝑟𝑤𝑖𝑠𝑒 (4)
The limbus and pupil are both modeled as circles and the parametric function g is defined as:
𝑔(𝑥𝑗, 𝑦𝑗, 𝑥𝑐, 𝑦𝑐, 𝑟) = (𝑥𝑗− 𝑥𝑐)2+ (𝑦𝑗− 𝑥𝑐)2− 𝑟2 (5)
Assuming a circle with center (xc; yc) and radius r, the edge points that are located over the circle result in a zero value for the function. The value of g is then transformed to 1 by the h function, which represents the local pattern of the contour. The local patterns are then used in a voting procedure using the Hough transform, H, in order to locate the proper pupil and limbus boundaries. In order to detect the limbus, only vertical edge information is used. The two eyelids usually cover the upper and lower parts; these parts contain horizontal edge information. The horizontal edge information is used for detecting the upper and lower eyelids, which are modeled as parabolic arcs [9].
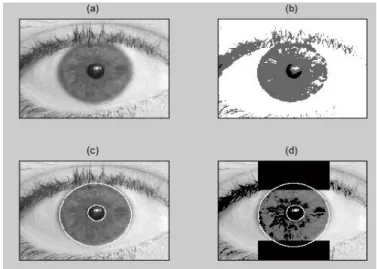
After the Hough Transform process is complete, six parameters are stored: the radius and x and y (the center coordinates for both circles). Eyelids are isolated by first fitting a line to the upper and lower eyelid using the linear Hough transform. A second horizontal line is then drawn that intersects with the first line at the iris edge that is closest to the pupil. This process is completed for both the top and bottom eyelids. The second horizontal line allows maximum isolation of eyelid regions. Figure 7 shows an example of properly segmented iris.
Figure 7. Examples of the segmented iris 2.2. Iris normalization
The size of the iris may change because of variation in the illumination, even for an iris from the same person. This elastic deformation in iris texture must be compensated for to achieve more accurate recognition results. Normalization is a technique to prepare a segmented iris for feature extraction and transforms the segmented circular iris region into a fixed-size rectangular shape. The Cartesian-to-polar transform of the iris region is based on Daugman’s rubber sheet model [5], as illustrated in Figure 8.
Figure 8. Cartesian-to-polar coordinate transform
The Cartesian-to-polar transform of the iris region is modeled by (4).
𝐼(𝑥(𝑟, 𝜃)), 𝑦(𝑟, 𝜃)) → 𝐼(𝑟, 𝜃) (4)
with
𝑥(𝑟, 𝜃) = (1 − 𝑟)𝑥𝑝(𝜃) + 𝑟𝑥𝑖(𝜃)
𝑦(𝑟, 𝜃) = (1 − 𝑟)𝑦𝑝(𝜃) + 𝑟𝑦𝑖(𝜃) (5)
The coordinates of the inner and outer boundaries along the θ direction are xp, yp and xi, yi, respectively. Image-normalized enhancement is required to obtain accurate features because the normalized iris presents many variations due to variations in light illuminations. By using histogram equalization, pixels intensities are spread over the entire iris template. Figure 9 shows an iris template with histogram equalization.
(a)
(b)
Figure 9. (a) Iris normalized into polar coordinates, (b) Enhancement of the iris normalized image
2.3. Feature extraction
In the encoding stage, two level discrete wavelet transformation (DWT) is applied to the normalized iris region, in order to determine DWT coefficients, by passing the signal in different frequency ranges, namely low-low (LL), low-high (LH), high-low (HL) and high-high (HH), as indicated in Figure 10. The frequency range can be represented as LL < LH < HL < HH [17-18].
The LL sub-band represents the feature characteristics of the iris; this sub-band (LL) is used in the classification phase. Figure 11 indicates the resolution of the normalized and enhanced iris image (48x432). After applying DWT to an enhanced iris image, the resolution of sub-band is (24 × 216). This sub-band is used instead of the original normalized iris data to reduce the resolution of the iris model, and the runtime of the classification is similarly reduced.
LL
LH
HL
HH
Figure 10. Iris template using DWT
(a)
(b)
Figure 11. (a) Enhancement of the iris normalized image, (b) DWT transforms normalized
iris image into LL sub-bands
2.4. Support vector machine SVM
The support vector machine (SVM) performs pattern recognition according to the principle of structural risk minimization. The development of SVM as a classifier has two major aspects: the first aspect is to find the hyperplane that optimally separates the two classes, and the second aspect is the transformation of the linearly non-separable classification problem into a linearly separable problem [19].
Given an input entity vector learning set and the class tag (x_i,y_i), i=1,2…,l, where 𝑥𝑖∈ 𝑅𝑛
and y ∈ {1, -1}. In the case of a linearly separable problem, the separating hyperplane (which defines the boundary between class 1 and class 2) can be represented as follows:
𝑚𝑖𝑛𝜔,𝑏,𝜉 1 2𝜔
𝑇𝜔 + 𝐶 ∑ 𝜉 𝑖 𝑙
𝑖=1 (6)
Subject to
𝑦𝑖(𝜔𝑇𝜙(𝑥𝑖) + 𝑏) ≥ 1 − 𝜉𝑖 ; 𝜉𝑖≥ 0 (7)
In the case of a non-linearly separable problem, the training vectors x_i are mapped into higher dimensional space by the function ∅ in order to make the problem linearly separable. The SVM then finds a linear separating hyperplane with the maximal margin in this higher dimensional space. The penalty parameter of the error term is C > 0. Furthermore, 𝐾 (𝑥𝑖, 𝑥𝑗) = ∅ (𝑥𝑖)𝑇 (𝑥𝑗) is called the kernel function [20].
Linear:
𝐾(𝑥𝑖, 𝑥𝑗) = 𝑥𝑖𝑇 𝑥𝑖 (8)
Polynomial:
𝐾(𝑥𝑖, 𝑥𝑗)= (𝛾𝑥𝑖𝑇 𝑥𝑗+ 𝑟)𝑑 , 𝛾 > 0 (9)
Gaussian:
𝐾(𝑥𝑖, 𝑥𝑗) = exp (− ‖𝑥𝑖−𝑥𝑗‖2
2𝛾2 ) 𝛾 > 0 (10)
3. RESULTS
The Classification Learner App (included in the Statistics and Machine Learning Toolbox for MATLAB) is an application that can be used to train models to classify data using supervised machine learning methods. The SVM and KNN classifiers were used for our approach [20-21].
By using Classification Learner, we can explore data, select features, specify validation schemes, and train and export classification models to the MATLAB workspace to generate predictions for new data.
To evaluate the effectiveness of the proposed system, a set of eye images obtained from the UBIRIS databases were used [22]. Figure 12 shows an example of the eye images contained in this database. The total number of iris classes is 100, and each iris class contains three images stored in the database for this experiment. In this work, 300 images were used for training, and 100 images were used for testing purposes.
Figure 12. Eye images in the UBIRIS database
Four kernel functions (Linear, Quadratic, Cubic, and Medium Gaussian) were used, and the classification efficiency of each kernel was measured. Since the highest classification accuracy was obtained by a Medium Gaussian kernel, as shown in Table 1, this kernel was used in our system for classification and recognition purposes. As the simulation result shown in Table 2, the KNN algorithm assured better the accuracy of 95%, as well as the execution time is too low compared to that of the SVM algorithm.
Table 1. Efficiency of various kernel functions (SVM)
Kernel Type Classification
Accuracy (%)
Training Time (sec)
Linear 68.2 430.89
Quadratic 84.3 533.09
Cubic 88.6 580.83
Medium Gaussian 88.9 602.28
Table 2. Efficiency of KNN classifier
Classification Accuracy (%)
Training Time (sec)
KNN 95.00 19.94
The accuracy of our proposed technique is 95%, is shown in Table 3, which is better than the other methods that are used for runtime comparison.
Table 3. Accuracy comparison of our proposed technique with others
Author Classification Accuracy (%)
H Ohmaid et al. (Our proposed) 95
MH Hamd and al. [23] 94
SG Firake and al. [24] 92.85
J poonia and al. [25] 82.5
4. CONCLUSIONS
In this paper, segmentation was achieved using pretreatment step based on an unsupervised neural approach. The normalization enabled the transformation of the segmented circular iris region into a fixed-size rectangular shape using Daugman’s rubber sheet model. Discrete wavelet transformation (DWT) is used for extracting the optimum features of iris images and reducing the runtime of classification of these iris templates. Finally, a comparison was made between the classifiers SVM and KNN. Experimental evaluation using the URIBIS database clearly demonstrated the proposed technique performs in an efficient manner, especially for the KNN classifier that gave an accuracy of 95%.
REFERENCES
[1] Fang, Bin Et Tang, Yuan Yan. Improved class statistics estimation for sparse data problems in offline signature verification. IEEE Transactions on Systems, Man, and Cybernetics, Part C (Applications and Reviews). vol. 35, no 3, pp. 276-286, 2005.
[2] Gao, Xinbo, Zhong, Juanjuan, LI, Jie, et al. Face sketch synthesis algorithm based on E-HMM and selective ensemble. IEEE Transactions on Circuits and Systems for Video Technology, vol. 18, no 4, p. 487-496, 2008.
[3] Yu, Li, Zhang, David, Et Wang, Kuanquan. The relative distance of key point based iris recognition. Pattern Recognition, vol. 40, no 2, p. 423-430, 2007.
[4] Zhang, Taiping, Fang, Bin, Liu, Weining, et al. Total variation norm-based nonnegative matrix factorization for identifying discriminant representation of image patterns. Neurocomputing, vol. 71, no 10, p. 1824-1831, 2008.
[5] Daugman, J. Biometric personal identification system based on iris analysis, United States Patent, US 5291560. 1994.
[6] Daugman, J., “How iris recognition works,” Image Processing. 2002. Proceedings. 2002 International Conference on, vol.1, no., pp.I-33, I-36 vol.1, 2002.
[7] Masek, Libor, et al. Recognition of human iris patterns for biometric identification. 2003.
[8] Ohmaid, Hicham, Eddarouich, S., Bourouhou, A., et al. “Iris segmentation using a new unsupervised neural approach”. Int J Artif Intell (IJAI), vol. 9, no 1, pp.58-64, 2020.
[9] H. Ohmaid, M. Timouyas and S. Eddarouich, "A comparative study of similarity measurement in a new neural model of Unsupervised clustering," 2019 Third International Conference on Intelligent Computing in Data Sciences (ICDS), Marrakech, Morocco, 2019, pp. 1-8, doi: 10.1109/ICDS47004.2019.8942242.
[10] Timouyas M., Eddarouich S. and Hammouch A. “Mode region detection using improved Competitive Hebbian Learning for unsupervised clustering,” Engineering Science and Technology: An International Journal (ESTIJ), ISSN: 2250-3498 Vol.7, No.4, pp. 26-35, 2017.
[11] Parzen, E. “An Estimation of a Probability Density Function and Mode,” Ann. Math. Stat., vol. 33, pp.1065-1076, 1962.
[12] Postaire, J.-G., & Vasseur, C. P. A. “A fast Algorithm for non Parametric Probability Density Estimation,” IEEE, Trans. on Pattern Anal. and Machine Intel. PAMI-4, n 6, pp. 663-666, 1982.
[13] Eddarouich, S., & Sbihi, A. “Neural Network for Modes Detection in Pattern Classification.” ICTIS’07, Morocco, Fez, 3-5 pp. 300-303, 2007.
[14] Timouyas, M., Eddarouich, S., and Hammouch, A. “A new approach of classification for non-Gaussian distribution upon competitive training,” (ICCS’12), Agadir, Morocco, pp.1-6, 2012.
[15] Eddarouich, S., and Sbihi, A. “Détection des Modes par Approche Neuronale pour la Classification des Données d’un Mélange des Distributions Normales,” Proceeding of the 6th African Conference on Research in Computer Science (CARI’02), Yaoundé, Cameroon, pp. 61-68, 2002.
[16] Wildes, Richard P. Iris recognition: an emerging biometric technology. Proceedings of the IEEE, vol. 85, no 9, p. 1348-1363, 1997.
[17] Ma, Li, Tan, Tieniu, Wang, Yunhong, et al. Efficient iris recognition by characterizing key local variations. IEEE Transactions on Image processing, vol. 13, no 6, p. 739-750, 2004.
[18] Ganorkar, Sanjay Et Memane, Mayuri. “Iris recognition using discrete wavelet Transform.” International Journal of Advances in Engineering & Technology, vol. 4, no 1, p. 356, 2012.
[19] Rana, Humayan Kabir, Azam, Md Shafiul, Akhtar, Mst Rashida, et al. “A fast iris recognition system through optimum feature extraction”. Peer J Computer Science, vol. 5, p. e184, 2019.
[20] Czajka, A., Bowyer, K. W., Krumdick, M., & VidalMata, R. G. “Recognition of image-orientation-based iris spoofing”. IEEE Transactions on information Forensics and Security, 12(9), 2184-2196, 2017.
[21] Zhang, Hui and Guan, Xiangfeng. Iris recognition based on grouping KNN and rectangle conversion. In: 2012 IEEE International Conference on Computer Science and Automation Engineering. IEEE. p. 131-134, 2012.
[22] “Ubiris: Noisy Visible Wavelength Iris Image Databases.” [Online]. Available: URL:http://iris.di.ubi.pt/.
[23] Hamd, Muthana H. and Ahmed, Samah K. Biometric system design for iris recognition using intelligent algorithms. International Journal of Modern Education and Computer Science, vol. 11, no 3, p. 9, 2018.
[24] Firake, Sarita G. and Mahajan, P. M. Comparison of iris recognition using gabor wavelet, principal component analysis and independent component analysis. International Journal of Innovative Research in Computer and Communication Engineering, vol. 4, no 6, p. 12334-12342, 2016.
[25] Jyoti, P., Parvati, B., Sandeep, K. G., and al. New improved feature extraction approach of IRIS recognition. International Journal of Computer Systems, vol. 3, no 1, p. 1-3, 2016.