Science, Technology,
engineering, and MaTh
an Update of State actions
Building a
Science, Technology,
engineering, and MaTh
an Update of State actions
John Thomasian, Black Point Policy Solutions, llc
nga center for Best Practices
December 2011
Building a
Acknowledgements
T
his publication was written by John Thomasian of Black Point Policy Solutions, LLC for the National Governors Association Center for Best Practices (NGA Center). He compiled background information and wrote this report. Other education division staff helped develop the project and contributed numerous insights, namely Tabitha Grossman, program director, Dane Linn, division director, Travis Reindl, program director, Ryan Reyna, program director, and Angela Baber, senior policy analyst. Garrett Groves in the economic, human services, and workforce programs division also made contributions to the production of this report. The NGA Center would like to acknowledge the role of the NGA Center’s STEM Advisory Committee in conceptualizing the report, drafting the outline, and providing insightful feedback on early drafts of the report.The NGA Center would like to thank Maria Nosal in the NGA office of communications for editing the report and Naylor Design, Inc. for the report design and layout.
This report was made possible by the Noyce Foundation, the Battelle Memorial Institute, and Carnegie Corporation of New York.
Acknowledgements 2
executive summary 5
1. Introduction 9
2. goals of the stem Agenda 11
Increasing the Number of Students and Professionals in STEM 11
Increasing STEM Proficiency for All Students 12
Summing Up 15
3. why the stem Agenda is Important 17
STEM Salaries Are Above the National Average 17
STEM Knowledge Bolsters Employment Security 18
STEM and Innovation 19
The Payoff 19
4. weak links in the system 21
Inconsistent State Standards in Math and Science 21
Shortfall of Qualified Math and Science Classroom Teachers 21
Lack of Preparation for Postsecondary STEM Study 22
Failure to Motivate Student Interest in Math and Sciences 23
Failure of Postsecondary System to Meet STEM Job Needs 23
5. Implementing a state stem Agenda 25
Adopt Rigorous Math and Science Standards and Improved Assessments 25
Recruit and Retain More Qualified and Effective Teachers 27
Provide More Rigorous Preparation for STEM Students 28
Use Informal Learning to Expand Math and Science Beyond the Classroom 32
Enhance the Quality and Supply of STEM Teachers 33
Establish Goals for Postsecondary Institutions to Meet STEM Job Needs 34
6. moving Forward 37
Taking Stock 38
endnotes 39
4 | Building a SCiEnCE, TEChnOlOgy, EnginEEring and MaTh EduCaTiOn agEnda
some stem Facts
➔ at all levels of educational attainment, STEM job holders earn 11 percent higher wages compared with their same-degree counterparts in other jobs.
➔ The top 10 bachelor-degree majors with the highest median earnings are all in STEM fields.
➔ The average annual wage for all STEM occupations was $77,880 in May 2009, significantly above the u.S. average of $43,460 for non-STEM occupations.
➔ Over the past 10 years, STEM jobs grew three times faster than non-STEM jobs. STEM jobs are expected to grow by 17 percent during the 2008–2018 period versus 9.8 percent growth for non-STEM jobs.
➔ in 2010, the unemployment rate for STEM workers was 5.3 percent; for all other occupations, it was 10 percent.
eXecUTiVe SUMMary
F
or several years, governors and education poli-cy leaders have been working to strengthen science, technology, engineering, and mathe-matics (STEM) education throughout the states. The immediate goals are twofold: increase the proficiency of all students in STEM and grow the number of students who pursue STEM careers and advanced studies. The reasons are straightfor-ward: STEM occupations are among the highest paying, fastest growing, and most influential in driving economic growth and innovation. Individ-uals employed in STEM fields enjoy low unem-ployment, prosperity, and career flexibility. In short, STEM education is a powerful foundation for individual and societal economic success.Unfortunately, the United States has fallen be-hind in fully realizing the benefits of STEM educa-tion. Results from the National Assessment of Edu-cational Progress over roughly the past 10 years show little improvement in high school seniors’ knowledge of math and science. Moreover, the Pro-gram for International Student Assessment, which provides cross-country comparisons, shows that U.S. students currently rank behind 25 countries in math scores and behind 12 countries in science scores. These factors may have contributed to an-other problem: the slow growth in postsecondary degrees awarded in STEM fields over approxi-mately the past decade. This lack of strong degree growth is causing the United States to fall behind other countries that are surging ahead to create a STEM talent pool. For example, U.S. STEM degrees represent only about one-third of bachelor’s de-grees, but they represent more than half of the first degrees awarded in Japan, China, and Singapore.
The reasons the United States lags behind its competitors in producing STEM graduates have been well documented. They include:
• Lack of rigorous K–12 math and science
stan-dards. Standards in math and science have
var-ied greatly across states and, in many cases, do not test students’ abilities to utilize concepts and solve problems.
• Lack of qualified instructors. A shortfall in the
numbers of qualified math and science teachers in the classroom is a chronic problem in the K–12 system; many classrooms are staffed by teachers with neither a certificate nor a degree in their as-signed subject area.
• Lack of preparation for postsecondary STEM
study. A student’s ability to enter and complete a
STEM postsecondary degree or credential is of-ten jeopardized because the pupil did not take sufficiently challenging courses in high school or spend enough time practicing STEM skills in hands-on activities.
• Failure to motivate student interest in math
and science. In most K–12 systems, math and
science subjects are disconnected from other subject matters and the real world, and students often fail to see the connections between what they are studying and STEM career options.
• Failure of the postsecondary system to meet
STEM job demands. Although STEM jobs are
expected to grow by 17 percent between 2008 and 2018, many higher education institutions— including community colleges, four-year colleg-es, and research universities—have not made an effort to increase their output of STEM degrees or certificates.
6 | Building a SCiEnCE, TEChnOlOgy, EnginEEring and MaTh EduCaTiOn agEnda States and their educational institutions have taken
the following actions to address these challenges:
• Adopted rigorous math and science standards
and improved assessments. Through the
Com-mon Core State Standards Initiative, led by gov-ernors and chief state school officers, states are implementing more rigorous, internationally benchmarked math standards. A separate state-led effort soon will produce improved science standards.
• Recruited and retained more qualified
class-room teachers. Several states and districts are
using financial incentives, support systems, pro-fessional development, and improved institu-tional conditions to recruit, retain, and reward high-performing math and science teachers.
• Provided more rigorous preparation for
STEM students. Through new school and
in-structional designs—STEM-specialty schools and academies, early college programs, linked learning, and online courses—states and schools are providing students with more focused and rigorous STEM curricula with real-world appli-cations.
• Used informal learning to expand math and
science beyond the classroom. Many public
and private institutions, such as museums, sci-ence centers, and after-school programs, pro-vide valuable out-of-class experiences that dem-onstrate how math and science connect to everyday life and careers and allow students and teachers to expand their skills. These programs are proving to have a positive effect on STEM in-terest and achievement.
• Enhanced the quality and supply of STEM
teachers. A number of higher education
institu-tions have established goals to improve teacher preparation programs, provide support systems and professional development, and generate more qualified math and science teachers.
• Established goals for postsecondary
institu-tions to meet STEM job needs. A number of
states have worked with postsecondary institu-tions to boost the number of certificates and de-grees in STEM fields.
The above actions should begin to increase the number of students and professionals engaged in STEM fields and occupations, but it will take time to see results. Data through 2008 show only slight growth in STEM degree enrollment. And the per-centage of STEM degrees awarded out of all degrees fell from 12.4 percent in 2000–2001 to 10.7 percent in 2008–2009. Because more individuals are at-tending college each year, the absolute number of STEM degree holders in the United States is ex-pected to grow but not nearly at the rate of some international competitors.
For these reasons, states must push ahead with their STEM initiatives. Fortunately, most elements of the STEM agenda—improved standards, more qualified teachers, and access to advanced course-work—directly align with the larger education re-form efforts underway. Where unique actions are needed to boost STEM education, such as the cre-ation of STEM-focused schools and support sys-tems for teachers and students, states at times are combining their own resources with those of the private sector, philanthropic community, and fed-eral government. By more efficiently allocating re-sources in the K–12 system and improving the pro-ductivity of postsecondary institutions, states can find ways to advance STEM education without ad-ditional expense.
A note on stem definitions
no standard definition exists of what constitutes a STEM job, and different studies often use slightly different groupings. Science, technology, engineering, and math positions appear consistently, but some studies include management and sales in STEM fields, while other research does not. additional workers not consistently repre-sented are STEM education employees, social scientists, certain health care professionals, and economists. in general, most studies tend to
under-represent the total number of positions that involve STEM knowledge, such as understanding quantitative analysis.
“ one of my favorite quotes is from carl Sagan, who said it’s suicidal to create a society that
depends on science and technology in which no one knows anything about science and technology
—and that’s the road that we are headed down. . . . you need to generate the scientists and
engineers, starting in school—elementary school, middle school, you have to fund the research
that those scientists go on to do—the fundamental research. you have to generate the
engineers that can turn those scientific breakthroughs into products and services.”
—Sally Ride
inTroDUcTion
S
TEM—science, technology, engineering, and mathematics—is critical to and supportive of many education reforms being undertaken today, from adoption of common internationally benchmarked standards to better teacher prepara-tion to enhanced coordinaprepara-tion across the entire K–20 education system. In fact, STEM is not a sep-arate reform movement at all; rather, it is an em-phasis. It stresses a multidisciplinary approach for better preparing all students in STEM subjects and growing the number of postsecondary graduates who are prepared for STEM occupations.The motivation behind this new emphasis on STEM is simple. Increasing the number of students versed in STEM and growing the number of gradu-ates pursuing STEM careers or advanced studies are critical to the economic prosperity of every state and the nation. A labor force without a rich supply of STEM-skilled individuals will face stagnant or even declining wealth by failing to compete in the global economy, where discovery, innovation, and rapid adaption are necessary elements for success. To en-sure that the United States does not follow that path, governors, education leaders, and policymakers at all levels have called for a new emphasis on STEM education in our nation’s schools, from K–12 through postsecondary education. How states are working to achieve these goals is the subject of this report.
The National Governors Association (NGA) first addressed STEM in its 2007 report, Building a
Sci-ence, Technology, Engineering and Math Agenda.
That report provided an overview of the STEM-related challenges, opportunities, and actions from the state perspective. This report updates those recommendations in light of recent state progress to improve education standards and other efforts to advance STEM education. In addition, this report
incorporates recent data from studies that make the economic case for pursuing a STEM agenda even more compelling than before.
The report’s six brief chapters cover the follow-ing issues:
• Chapter 2 defines the goals of the STEM agenda,
focusing on specific measures.
• Chapter 3 examines why STEM is important in
terms of jobs, prosperity, and future economic success.
• Chapter 4 reviews where the current system is
preventing the graduation of more high school and college students with STEM skills.
• Chapter 5 examines what is being done and can
be done to counter these trends.
• Chapter 6 concludes with a look at the work
ahead.
Governors, state education policy staff, and state education leaders can use this guide to further the implementation of STEM agendas. Fortunately, as current state actions demonstrate, emphasizing STEM does not shift the direction of education re-forms already underway. The majority of actions called for in this report complement changes initi-ated in both the K–12 and postsecondary systems over the past several years. A STEM focus merely provides coherence to many of these reforms, unit-ing them under a common set of goals.
Finally, this report also is designed to inform the public. Public commitment and public will are nec-essary to mobilize the efforts needed for change and to set higher expectations for the nation’s youth. Without it, we will simply run in place while others pass us by.
10 | Building a SCiEnCE, TEChnOlOgy, EnginEEring and MaTh EduCaTiOn agEnda
“ Because the major pathway to a STeM career is through postsecondary study, boosting
the number of individuals in STeM jobs means more individuals graduating from college
with STeM degrees or certificates.”
goalS oF The STeM agenDa
T
he STEM agenda has two basic goals. The first goal is to expand the number of students prepared to enter postsecondary study and pursue careers in the areas of science, technology, engineering, and mathematics. This goal is designed to bolster the innovative capacity of the U.S. work-force, which is falling behind other nations that are creating higher numbers of STEM-trained individ-uals each year compared to the United States.The second goal is to boost the proficiency of all students in basic STEM knowledge. This goal is de-signed to improve the ability of students and work-ers to assess problems, employ STEM concepts, and apply creative solutions in their daily lives. This second goal requires that all high school grad-uates be ready with the basic skills to pursue work or study in both STEM and non-STEM fields and meet the demands of most jobs today.
Together, both goals are intended to enhance the global competitiveness of the U.S. economy and help individuals achieve economic security in their careers.
Increasing the number of students and Professionals in stem
A major goal of the STEM agenda is to increase the number of individuals pursuing STEM careers. Be-cause the major pathway to a STEM career is through postsecondary study, boosting the number of individuals in STEM jobs means more individu-als graduating from college with STEM degrees or certificates.
Unfortunately, the growth in postsecondary STEM degrees awarded in the United States over the past decade has been anemic (Figure 2–1).2 In the 2000–2001 academic year, postsecondary insti-tutions awarded approximately 386,000 STEM
de-grees out of nearly 3 million dede-grees in all fields. By 2008–2009, the total number of STEM degrees awarded rose to about 435,000 out of more than 4.1 million. Thus, although the number of degrees awarded in all disciplines grew by 35.5 percent, the number of STEM degrees edged up by just 12.4 per-cent. Moreover, the percentage of all degrees that represent STEM fields fell from 12.9 percent in 2000–2001 to 10.7 percent in 2008–2009.
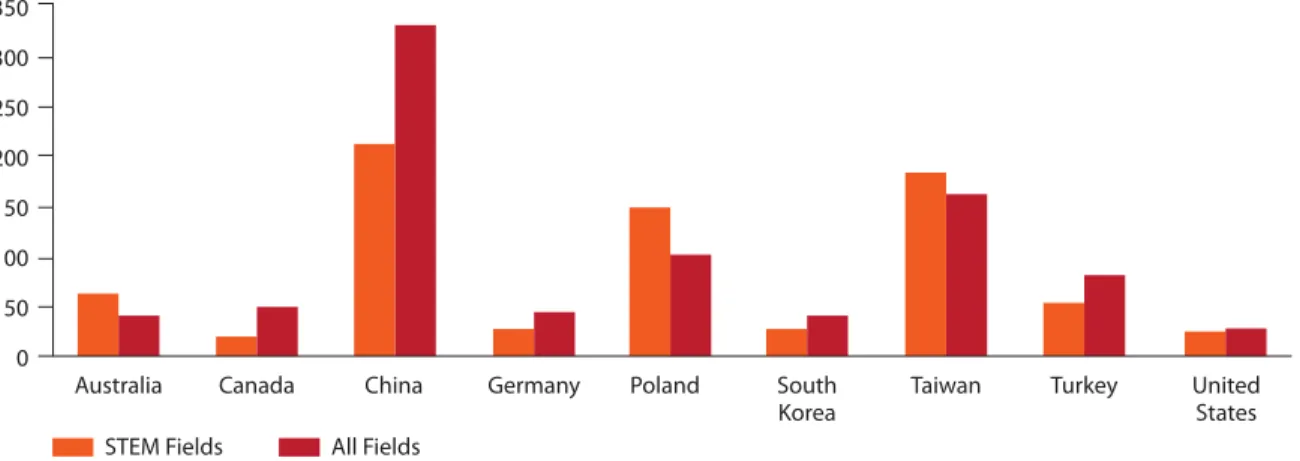
When these figures are compared international-ly, the numbers look worse (Figure 2–2).3 Between 1998 and 2006—the years of available data to com-pare the countries listed—the total number of U.S. undergraduate degrees awarded in all fields grew by 25 percent, while those awarded in STEM grew by 23 percent. In contrast, over the same period, STEM degrees in Poland grew by 144 percent; in Taiwan, by 178 percent; and in China, by more than 200 percent. Moreover, the data show that by 2006, China was already awarding almost twice as many first university degrees in STEM (911,846) com-pared to the United States (478,858), even though
2
4,500,000 4,000,000 3,500,000 3,000,000 2,500,000 2,000,000 1,500,000 1,000,000 500,000 0 2000–01All Degrees STEM Degrees 2008–09
12 | Building a SCiEnCE, TEChnOlOgy, EnginEEring and MaTh EduCaTiOn agEnda the quality and number of some of the Chinese
de-grees has been questioned. Nevertheless, given this trend, the degree gap has surely grown.
When comparing U.S. postsecondary STEM- degree attainment with that of rising competitors, other troubling developments come to the fore:4 • In China, the number of first university degrees
awarded in natural sciences and engineering has risen sharply since 2002, while the number awarded in Germany, Japan, the United King-dom, and the United States has remained rela-tively flat.
• In the United States, STEM degrees have for a long time represented about one-third of bache-lor’s degrees. Countries where more than half of first degrees are now awarded in STEM fields include Japan (63 percent), China (53 percent), and Singapore (51 percent).
• In the United States, about 5 percent of all bach-elor’s degrees are in engineering. In Asia, about 20 percent are in engineering; specifically, in China, about one-third of bachelor’s degrees are in engineering (although the percentage has de-clined in recent years).
Despite these statistics, the United States continues to be a significant producer of STEM degrees. In fact, when the Organisation for Economic Coopera-tion and Development (OECD) looks at the top 10 countries with the largest shares of advanced sci-ence and engineering degrees, the United States is
the largest single contributor of new doctorates, with more than one-quarter of the nearly 89,000 to-tal in 2009 (followed by Germany, the United King-dom, and France).5 However, other nations are quickly catching up by awarding STEM advanced degrees at a much higher rate than the United States (Figure 2–3). This is partly why a few corpo-rations have moved some research and develop-ment activities overseas.
Increasing stem Proficiency for All students Another goal of the STEM agenda is to improve the proficiency of all students in STEM, even if they choose not to pursue STEM careers or postsecond-ary studies. The ability to understand and use STEM facts, principles, and techniques are highly transferable skills that enhance an individual’s abil-ity to succeed in school and beyond across a wide array of disciplines. These skills include:
• Using critical thinking to recognize a problem; • Using math, science, technology, and
engineer-ing concepts to evaluate a problem; and
• Correctly identifying the steps needed to solve a problem (even if not all the knowledge to com-plete all steps is present).
Achieving greater STEM proficiency begins in the K–12 system, where U.S. students have not demon-strated significant gains in math and science knowl-edge for almost 15 years, according to the National
Australia Canada China Germany Poland South
Korea Taiwan Turkey UnitedStates STEM Fields All Fields
350 300 250 200 150 100 50 0
0.0 5.0 10.0 15.0 20.0 25.0 30.0 35.0 40.0 45.0 50.0 Science Engineering Franc e Israe l Cana da (2 008) Spain India (2005 ) Unite d King dom Switz erlan d Germ any Czec h Rep ublic Austr alia ( 2008 ) Icelan d Austr ia OECDNorwaySweden Unite d Stat es Hung ary
ChinaFinlan d Denm ark Turke y Polan d Japan Neth erlan ds Kore a
Figure 2-3: science and engineering graduates at doctorate level (2009) (as percentage of all new degrees awarded at doctorate level)
Assessment of Educational Progress (NAEP). (Note: Currently, the NAEP measures math and science knowledge but does not measure technology and engineering knowledge. Testing of the latter two subjects will begin in 2014 [see sidebar].)6
Since 1990, the NAEP has reported performance in terms of three educational levels: basic, profi-cient, and advanced. At least among 12th-grade stu-dents, the results are decidedly mixed.
In math, the percentage of students achieving proficiency or greater more than doubled from 1990 to 2009—from 12 percent to 26 percent. How-ever, over the same period, the proportion of stu-dents at or above basic dipped from a peak of 69 percent in 1996 to 64 percent in 2009; only 3 per-cent of all students scored at advanced in the latest test (Figure 2–4).7
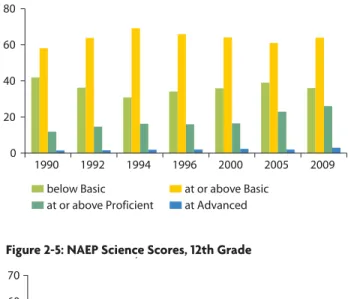
Even less promising trends can be found in the 1996–2009 science assessment figures. Although students judged at or below basic fell slightly, those scoring at or above proficient stayed the same (21 percent). Over the same period, the percentage of students at the advanced level fell from 3 percent to 1 percent (Figure 2–5).
Taken together, the numbers suggest that stu-dent achievement in math and science has not changed much for almost 15 years—the percentage of 12th-grade students scoring at or above profi-ciency in math has shown only modest progress, while science skills have remained static over the
technology And engIneerIng lIterAcy
according to the framework guiding the development of the first naEP Technology and Engineering literacy assessment, students will be evaluated in these three major areas:
• technology and society involves the effects that technology has
on society and on the natural world and the resulting ethical questions that arise.
• design and systems covers the nature of technology, the
engineering design process used to develop technologies, and the basic principles of dealing with everyday technologies, including maintenance and troubleshooting.
• Information and communication technology includes computers
and software learning tools; networking systems and protocols; handheld digital devices; and other technologies for accessing, creating, and communicating information and for facilitating creative expression.
NAEP testing years. More importantly, the nation has made almost no headway in increasing the number of students that reach the advanced level.
Within the data is another troubling aspect— a persistent achievement gap in the math and sci-ence scores between white students and African-American and Hispanic youth. Since 1990, the gap in mean scores between African-American
stu-14 | Building a SCiEnCE, TEChnOlOgy, EnginEEring and MaTh EduCaTiOn agEnda dents and their white counterparts has averaged
27 for math and 34 for science; for Hispanic youth, the average difference has been 22 for math and 26 for science. Because these minority youth rep-resent an increasing share of the nation’s student population, the need to close this gap and the challenge it presents to raising overall math and science scores will only grow.
International Comparisons
Cross-national comparisons shed additional light on the math and science proficiency of U.S. stu-dents. The Program for International Student As-sessment is an OECD test that measures math and science literacy among students 15 years of age. The results of the most recent tests are shown in Figure 2–6.8 The tests show that in math, the
Unit-ed States rankUnit-ed below 25 other countries that par-ticipated. The U.S. average math score of 487 also was lower than the OECD average of 496.
For science, the U.S. average score of 502 was not measurably different than the OECD average of 501, but 12 OECD countries had higher scores. At the very least, the numbers suggest that the United States is not dominating its competitors.
Two important measures are the numbers of students at both the bottom and top of the spec-trum. In terms of math proficiency, the OECD con-siders scores below level 2 to indicate that students may not be able to consistently employ basic algo-rithms or make literal interpretation of the results of mathematical operations in real-life settings. Scores above level 4 indicate that students can com-plete higher order tasks, such as solving problems that involve visual or spatial reasoning in unfamil-iar contexts. Twenty-three percent of U.S. students scored below level 2 in 2009, which was similar to other OECD countries. However, only 27 percent of U.S. students scored at or above level 4, which is be-low the OECD average of 32 percent.
The 2007 Trends in International Mathematics and Science Study (TIMSS) found similar results in its international comparisons.9 At eighth-grade, the average U.S. math score for students taking the test was lower than the average score of students in five countries, higher than 37 countries, and essentially the same as five countries. Similarly, the U.S. aver-age science score for eighth-graders was lower than the average score of students in nine countries, higher than 35 countries, and about equal to three countries.
Perhaps the most striking result is the differ-ence among countries in the percentage of stu-dents scoring at or above the advanced benchmark. Figure 2–7 depicts the percentage of eighth-grade students that scored at or above advanced in math. Nine countries had higher percentages of students with advanced scores than the United States, and some of the differences in percentages were dra-matic (e.g., the Chinese Taipei percentage was more than seven times that of the United States’ percentage).
Figure 2-4: nAeP math scores, 12th grade
Figure 2-5: nAeP science scores, 12th grade
0 20 40 60 80 1990 1992 1994 1996 2000 2005 2009
2-4. NAEP Math Scores, 12th Grade
below Basic at or above Basic at or above Proficient at Advanced
0 10 20 30 40 50 60 70 1996 2000 2005 2009
2-5. NAEP Science Scores, 12th Grade
below Basic at or above Basic at or above Proficient at Advanced
0 100 200 300 400 500 600 Korea, Rep. of Finland Switzerland Japan Canada Netherlands New Zealand Belgium Australia Germany Estonia Iceland Denmark Slovenia Norway France Slovak Republic Austria OECD average Poland Sweden Czech Republic United Kingdom Hungary Luxembourg United States Ireland Portugal Spain Italy Greece Israel Turkey Chile Mexico
2-6. PISA 2009 Results (age 15) Ranked by Math Scores
Science Math
Eighth-grade results for advanced science scores in the 2007 TIMSS were similar: six countries— Singapore, Chinese Taipei, Japan, England, Korea, and Hungary—had higher percentages of students performing at or above the advanced science bench-mark than the United States.
summing Up
The goals of the STEM agenda are straightforward: increase the number of individuals in the United States in STEM occupations, and increase the
Figure 2-6: PIsA 2009 results (Age 15) (ranked by Math Scores)
Figure 2-7: Percent of 8th grade students scoring at or Above Advanced on 2007 tImss
Math for Selected Countries
0 5 10 15 20 25 30 35 40 45 50 Egypt Italy Ukraine Thailand Scotland Romania Israel Slovenia Malta Turkey Czech Republic Australia United States Lithuania Russian Federation England Hungary Japan Hong Kong SAR Singapore Korea, Rep. of Chinese Taipei
STEM proficiency of all individuals, even if they choose non-STEM careers. Unfortunately, the data show that the United States is not producing enough college graduates to boost the STEM labor force. Our ability to graduate high school students with good math and science skills has only modest-ly improved at best. In addition, of growing concern is the trend that, compared with key international competitors, the United States is falling behind in producing the best students in math and science who are prepared for college or careers.
16 | Building a SCiEnCE, TEChnOlOgy, EnginEEring and MaTh EduCaTiOn agEnda
“ . . . individuals with STeM degrees who enter STeM careers experience lower unemployment
rates compared with workers who enter other fields, which means STeM workers enjoy greater
job security.”
Why The STeM agenDa iS iMPorTanT
i
ncreasing the number of high school, college, and postgraduate students majoring in STEM subjects is critical for economic prosperity. Most STEM graduates go into STEM jobs, occupations that are among the highest paying and fastest grow-ing. Moreover, individuals with STEM degrees who enter STEM careers experience lower unemploy-ment rates compared with workers who enter oth-er fields, which means STEM workoth-ers enjoy great-er job security. Students who study STEM also are able to enter a variety of fields and earn a salary premium even when they pursue non-STEM occu-pations. Finally, STEM education boosts the com-petitive edge and innovative capacity of states and regions, which sustain economic growth.stem salaries Are Above the national Average A sure way to raise the per capita earnings of a state or region is to increase the number of STEM graduates who reside there. STEM occupations are high paying, with wages significantly above the U.S. average.10
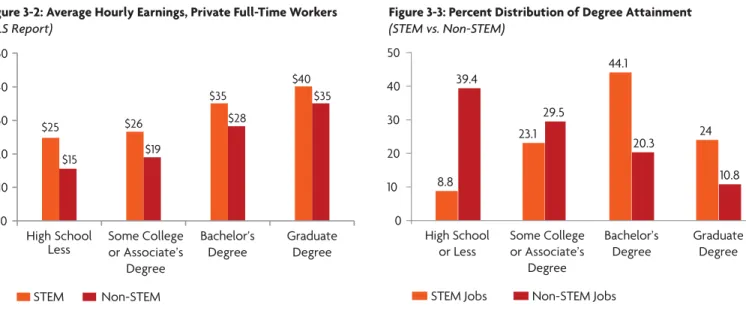
According to a recent analysis by the Bureau of Labor Statistics (BLS), the average annual wage for all STEM occupations was $77,880 in May 2009, and only four of 97 STEM occupations had mean wages below the U.S. average of $43,460. Moreover, the top 10 bachelor-degree majors with the highest payoff are all in STEM fields, according to the Georgetown University Center on Education and the Workforce (Figure 3–1).11
A STEM wage premium seems to hold even when comparing STEM and non-STEM workers at different levels of educational attainment. At each level, STEM job holders enjoy 11 percent higher wages than their same-degree counterparts in other occupations (Figure 3–2).12 For example, STEM workers with some college or an associate’s degree earn $7.61 more per hour than their non-STEM counterparts. STEM workers with graduate degrees earn $4.50 more per hour than those in non-STEM jobs.
Similarly, an individual with a STEM education seems to experience a wage advantage even when working in a non-STEM field. According to a recent
3
Figure 3-1: top 10 majors with the highest median earnings (full time students)
earnings at earnings at
major median 25th Percentile 75th Percentile
Petroleum Engineering $120,000 $82,000 $189,000 Pharmaceutical Sciences and administration $105,000 $83,000 $120,000 Mathematics and Computer Science $98,000 $75,000 $134,000 aerospace Engineering $87,000 $60,000 $115,000 Chemical Engineering $86,000 $60,000 $120,000 Electrical Engineering $85,000 $60,000 $110,000 naval architecture and Marine Engineering $82,000 $44,000 $120,000 Mechanical Engineering $80,000 $59,000 $105,000 Metallurgical Engineering $80,000 $50,000 $106,000 Mining and Mineral Engineering $80,000 $52,000 $125,000
18 | Building a SCiEnCE, TEChnOlOgy, EnginEEring and MaTh EduCaTiOn agEnda study that examined Census data over time, the
ad-justed earnings premium of college-educated workers with a STEM degree was 11 percent higher relative to other college graduates, whether or not they ended up in a STEM job. That premium, how-ever, rose to 20 percent when a STEM degree-hold-er ended up in a STEM job.13 Although a STEM de-gree is the typical path to a STEM job, it is not the only path. Although more than two-thirds of the 4.7 million STEM workers with a college degree have an undergraduate STEM degree, the rest do not. Nevertheless, some level of postsecondary study is critical for landing a STEM job: 91.2 percent of all STEM job holders have some college training or an associate’s degree, and more than 68 percent have a bachelor’s or graduate degree (Figure 3–3). Thus, the ability to successfully complete postsecondary work is key for pursuing a STEM career.
stem knowledge Bolsters employment security Although they make up only 6 percent of U.S. em-ployment, STEM jobs are growing much faster than other job categories. This means the supply of STEM workers is unlikely to outstrip demand. Over the past 10 years, STEM jobs grew three times fast-er than non-STEM jobs. From 2008 to 2018, STEM jobs are expected to grow by 17 percent compared to just 9.8 percent for non-STEM jobs.
Equally important, workers in STEM jobs tend to experience lower unemployment rates than workers in other fields. For example, the unem-ployment rate for STEM workers rose from 1.8 percent in 2007 to 5.5 percent in 2009 before fall-ing to 5.3 percent in 2010. In contrast, the unem-ployment rate for non-STEM workers jumped from 4.8 percent in 2007 to 9.5 percent in 2009 and 10 percent in 2009.14
Some of this premium can be attributed to the fact that the STEM workforce tends to possess higher educational attainment on average (Figure 3–3) than the non-STEM workforce, and this high-er educational attainment usually leads to lowhigh-er unemployment. This fact alone helps lead to lower unemployment levels for STEM workers; for ex-ample, the unemployment rate for college-educated workers in both STEM and non-STEM fields hov-ered around 4.7 percent in 2010. As most business leaders would attest, individuals who can fill STEM jobs remain in high demand and face excellent em-ployment prospects throughout their careers.
Finally, it is important to note that STEM skills are highly transferable and provide individuals with many career options. A 2011 report15 on STEM from the Georgetown University Center on Educa-tion and the Workforce describes STEM knowl-edge, skills, and abilities and how those assets add value to a wide variety of vocations:
Figure 3-2: Average hourly earnings, Private Full-time workers
(BLS Report)
Figure 3-3: Percent distribution of degree Attainment
(STEM vs. Non-STEM) $0 $10 $20 $30 $40 $50 High School Less $25 $15 $26 $19 $35 $28 $40 $35 STEM Non-STEM Some College or Associate’s Degree Bachelor’s
Degree GraduateDegree
Some College or Associate’s Degree 8.8 23.1 44.1 24 39.4 29.5 20.3 10.8 0 10 20 30 40 50 High School
or Less Bachelor’sDegree GraduateDegree STEM Jobs Non-STEM Jobs
[STEM] knowledge tends to be highly specialized, [and] it is both transferable and useful in contexts outside the traditional STEM disciplines and oc-cupations. Ultimately, this dynamic gives rise to careers that mix essentially different academic preparation and occupations. A mix of technical preparation and preparation in other disciplines is increasingly advantageous across a wide array of occupations. In addition, the transferability of knowledge allows STEM professionals to shift into other careers, especially into managerial roles midcareer in which their technical competencies are an advantage.
stem and Innovation
Linkages between innovation and economic growth are fairly well established. Economists broadly agree that more than half of economic growth since World War II has come from technological innova-tion.16 According to the Milken Institute’s Best-
Performing Cities 2010, “A rich innovation pipeline plays a pivotal role in a region’s industrial develop-ment, commercialization, competitiveness, and ability to sustain long-term growth.” 17
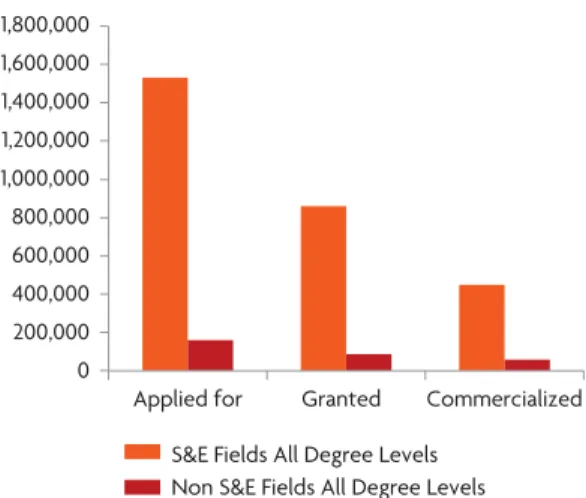
The STEM workforce is a powerful component of this innovation pipeline. STEM occupations em-ploy individuals who create ideas and applications that become commercialized and yield additional jobs. STEM fields overwhelmingly dominate other fields in generating new patents, including those that enter the marketplace. For example, during 1998–2003, scientists and engineers (S&E) applied for nearly 10 times more patents and commercial-ized almost eight times more patents than appli-cants from all other fields (Figure 3–4).18
STEM workers also contribute to the creation of innovation hubs—areas that usually include tech-nology centers and research parks—that are impor-tant sources of economic activity. STEM workers are often found in high concentrations in these
ar-Figure 3-4: Patenting Indicators for scientists and engineers and other degrees, 1998–2003
1,800,000 1,600,000 1,400,000 1,200,000 1,000,000 800,000 600,000 400,000 200,000 0 Applied for
S&E Fields All Degree Levels Non S&E Fields All Degree Levels
Granted Commercialized
eas. In addition, research universities and other postsecondary institutions typically are nearby, providing new supplies of STEM graduates and op-portunities for collaboration. Innovation hubs can spawn clusters of associated businesses and suppli-ers in both STEM and non-STEM fields while also rapidly growing jobs.19
the Payoff
Growing a STEM workforce is a sound economic development strategy. The STEM workforce is a key component of an innovation economy and a key ingredient for creating new business clusters and jobs. STEM jobs also are fast growing and pay significantly above the national average. In addi-tion, a STEM education provides individuals with a wage advantage and higher employment security throughout their careers, even if they pursue non-STEM occupations. As a recent U.S. Department of Commerce report concluded, “Although still rela-tively small in number, the STEM workforce has an outsized impact on a nation’s competitiveness, eco-nomic growth, and overall standard of living.” 20
20 | Building a SCiEnCE, TEChnOlOgy, EnginEEring and MaTh EduCaTiOn agEnda
seeing connections
“ When students discussed their career ambitions, many did not connect their aspirations with
required high school math and science coursework, suggesting a need to help students see the
relevance of upper-level math and science coursework in secondary school and beyond.”
—FromThe Opportunity Equation (2007), carnegie corporation of new york
Weak linkS in The SySTeM
4
a
number of studies and blue-ribbon com-missions over the past decade have identi-fied problems in the current system that hinder states and the nation from meeting STEM education goals. Many gaps exist, but this report briefly highlights five that states are addressing: • Inconsistent state standards in math and science; • Shortfall of qualified math and scienceclass-room teachers;
• Lack of preparation for postsecondary stem study;
• Failure to motivate student interest in math and sciences; and
• Failure of the postsecondary system to meet STEM job needs.
Inconsistent state standards in math and science For many years, policymakers have called on states to adopt more academically rigorous common math and science standards, which vary greatly. In many cases, they are too numerous and too broad to correctly define what students need to know.
More-over, many current standards lack the clarity and rigor of standards in other countries, which con-tributes to the lack of U.S. student gains in interna-tional testing.
As discussed in Chapter 5, a national, state-led effort is underway to correct these concerns; there-fore, this report does not discuss in great detail the current problems surrounding standards. Never-theless, because the new standards will take several years to implement, interim steps are needed to make certain that students are properly prepared for postsecondary STEM study. Meanwhile, states must forge ahead with the adoption of the more rig-orous math and science standards and assessments to ensure that progress is not delayed.
shortfall of Qualified math and science classroom teachers
A shortfall in the numbers of qualified math and science classroom teachers has been a chronic chal-lenge in the K–12 system.21 For example, only 63.1 percent of high school math teachers in 2007–2008
Figure 4-1: Percent of high school math and science teachers certified or not certified in their Assignment
major in main assignment no major in main assignment selected main Assignment total certified not certified total certified not certified
Mathematics 72.5 63.1 9.4 27.5 16.4 11.1 Science 84.0 73.6 10.4 16.0 12.0 4.0 Biology/life science 76.1 60.2 16.0 23.9 17.2 6.7 Physical science 48.5 39.5 9.0 51.5 29.9 21.6 Chemistry 48.5 36.8 11.4 51.8 34.6 17.3 Earth sciences 33.2 27.2 6.0 66.8 23.3 43.5 Physics 57.7 42.7 15.0 42.3 28.1 14.1
22 | Building a SCiEnCE, TEChnOlOgy, EnginEEring and MaTh EduCaTiOn agEnda both majored in math and were certified to teach
math (Figure 4–1).22 For science high school teach-ers, the statistics are better: 73.2 percent both ma-jored in science and were certified. (In comparison, the percentage of teachers that neither majored in the subject nor were certified was 11 percent and 4 percent, respectively.)
The lack of teacher qualification becomes more acute in some of the physical sciences. In chemis-try, only 36.8 percent of teachers held a major and certification in the subject. In earth sciences, only 27.4 percent of teachers majored and held a certifi-cate in the subject. Of more concern, 21.6 percent of teachers in the physical sciences and 43.5 percent
of the teachers in the earth sciences held neither a degree nor a certificate in the subject.
To increase the number of qualified STEM teachers in the classroom, states will need to focus on policies that recruit, retain, and grow the supply of qualified math and science teachers. In addition, they will need to promote policies that help retain teachers who are most effective in raising math and science achievement.
lack of Preparation for Postsecondary stem study New, improved math and science standards will go a long way in preparing students for college and
ca-reers, but more is needed to prepare students for postsecondary STEM study and STEM careers. For these students, stronger academic preparation rais-es their chancrais-es for succrais-ess but is frequently not available.
Research has shown that strong academic prep-aration in high school improves STEM degree com-pletion rates. For example, students who took trigo-nometry, pre-calculus, or calculus in high school; earned a high school grade-point average of B or higher; obtained college entrance exam scores in the highest quarter; and expected to attain a gradu-ate degree in the future experienced higher rgradu-ates of STEM degree completion (including STEM bache-lor’s degrees) and lower rates of leaving college without earning any credential than did their peers without these characteristics.23
In addition, research suggests—at least with re-gard to science—that certain instructional practices appear to be more effective than others in raising achievement.24 These include:
• Doing hands-on activities in science;
• Writing long answers to science tests and assign-ments;
• Talking about measurements and results from hands-on activities; and
• Working with others on a science activity. Unfortunately, many students who wish to study STEM leave high school without taking sufficiently challenging courses, participating in hands-on and group projects, or practicing concepts learned in math and science by applying them to real-world problems.
Failure to motivate student Interest in math and sciences
In most K–12 systems, science and math are taught as discrete subjects unconnected to other course-work. Students are not often exposed to the con-nections between the work they are doing currently in math and science and postsecondary fields of study and STEM occupations. Most of what stu-dents learn about the real-world connections to
math and science is relegated to the once-a-year field trip to a museum or planetarium. Yet these stu-dents rely on technology every day in smart phones, computers, and televisions without understanding the underlying connections to math and science.
Helping students see the connections between math and science and future career opportunities is a critical aim of the STEM pipeline. Students typically form notions of their career path in sec-ondary school. Without the right information, fully capable students may bypass STEM study because they could not foresee the applications of STEM knowledge.
Motivating interest in math and science requires improved teaching strategies in the classroom and opportunities outside the classroom to demonstrate linkages between math and science, real-world ap-plications, and future careers. Teachers and other school staff will need help in making students see these linkages.
Failure of Postsecondary system to meet stem Job needs
As mentioned in Chapter 3, between 2008 and 2018, STEM jobs are projected to grow by 17 percent, al-most twice as fast as non-STEM jobs. Although it represents only 5 percent of the total workforce, STEM employment will expand by more than 1.5 million workers in 2018. More than 90 percent of these jobs will require postsecondary study, with 68 percent requiring a bachelor’s degree or more.
However, in many cases, the higher education system—community colleges, four-year colleges, and research universities—fails to see the connec-tion between academic outputs and the needs of the marketplace. Policymakers, including gover-nors and state legislators, contend that more atten-tion must be paid to the job demands of the region-al economy. Programs and degree outputs must be better matched to the job market to sustain eco-nomic growth. This is particularly important with regard to STEM education, where supplies of STEM teachers are tight and global competition is strong.
24 | Building a SCiEnCE, TEChnOlOgy, EnginEEring and MaTh EduCaTiOn agEnda
“ To realize the goals of a STeM agenda, states will need to adopt improved k–12 math and
science standards and the assessments that test student knowledge and problem solving.
Fortunately, states have made marked progress in this area over the past five years.”
iMPleMenTing a STaTe STeM agenDa
5
D
espite the financial downturn and tight fis-cal situation, states are continuing their ef-forts to advance a STEM agenda. In addi-tion to state and local government resources, many of these efforts are leveraging support from the philanthropic community, businesses, and, in some cases, the federal government.Although many simultaneous actions are need-ed to grow participation and outcomes in STEM education, this report focuses on six key steps that states are or should be taking across the entire K– postsecondary education continuum:
• Adopt rigorous math and science standards and improved assessments;
• Place and retain more qualified teachers in the classroom;
• Provide more rigorous preparation for STEM students;
• Use informal learning to expand math and sci-ence beyond the classroom;
• Enhance the quality and supply of STEM teach-ers; and
• Establish goals for postsecondary institutions to meet STEM job needs
Adopt rigorous math and science standards and Improved Assessments
To realize the goals of a STEM agenda, states will need to adopt improved K–12 math and science standards and the assessments that test student knowledge and problem solving. Fortunately, states have made marked progress in this area over the past five years.
Common Core Math Standards
In 2009, a coalition led by governors and chief state school officers released new, rigorous, and interna-tionally benchmarked math and English language arts standards to widespread praise. Called the Common Core State Standards Initiative, the effort was coordinated by the National Governors Asso-ciation Center for Best Practices and the Council of Chief State School Officers.25 The standards were developed in collaboration with teachers, school administrators, and nationally recognized experts. As of late 2011, 46 states and territories had adopted the Common Core Standards and were in the midst of a two- to four-year process of bringing them into the classroom.
The standards define the knowledge and skills students should have along their K–12 education progression so that they will graduate high school able to succeed in entry-level, credit-bearing aca-demic college courses and in workforce training programs. The standards:
• Are aligned with college and work expectations; • Are clear, understandable, and consistent; • Include rigorous content and application of
knowledge through high-order skills;
• Build on strengths and lessons of current state standards;
• Are informed by other top-performing countries so that all students are prepared to succeed in the global economy and society; and
• Are evidence-based.
With regard to the math standards, the Common Core includes a number of improvements that will raise student STEM proficiency:
26 | Building a SCiEnCE, TEChnOlOgy, EnginEEring and MaTh EduCaTiOn agEnda • The K–5 standards provide students with a solid
foundation in whole numbers, addition, subtrac-tion, multiplicasubtrac-tion, division, fractions, and deci-mals. They are designed to help young students build the foundation to successfully apply more demanding math concepts and procedures and to move into applications.
• The standards stress not only procedural skill but also conceptual understanding. They aim to ensure that students are learning and absorbing the critical information they need to succeed at higher levels.
• The high school standards call on students to
practice applying mathematical ways of thinking to real-world issues and challenges; in short, they prepare students to think and reason mathematically.
• The high school standards set a rigorous
defini-tion of college and career readiness by helping stu-dents develop a depth of understanding and abil-ity to apply mathematics to novel situations, as college students and employees regularly do.
Assessments
States also need to adopt and implement new and improved assessments that are aligned to the Com-mon Core. Many current assessments do not fully reflect state standards, do not test problem-solving abilities, and rely too much on questions that test the acquisition of specific information and not more sophisticated skills and concepts. The new assess-ments will test deeper levels of knowledge and ap-plication of concepts. In addition, they will:
• Provide a common and consistent measure of student performance across states, which will al-low states to compare performance on a com-mon metric; and
• Offer an opportunity for states to pool financial and intellectual resources to develop better as-sessments while reducing the cost to each state. The new assessments, scheduled to be released in 2014–2015, are being designed by two state coali-tions: the Partnership for Assessment of Readiness in College and Careers and the SMARTER Bal-anced Assessment Consortium.
Science Standards
Developing and adopting new, rigorous, and interna-tionally benchmarked science standards is the next crucial step in improving STEM education. A joint effort led by NGA and the Council of Chief State School Officers, with support from the National Sci-ence Teachers Association and the American Asso-ciation for the Advancement of Science, has led to the development of a consensus report from the Na-tional Research Council that is a blueprint for the development of new K–12 science standards. The re-port, A Framework for K–12 Science Education:
Prac-tices, Crosscutting Concepts, and Core Ideas, proposes a stronger role for technology and engineering in sci-ence education. It also places a greater emphasis on teaching students not only the content and practice
Use Financial Incentives to Recruit and Retain
Salary certainly plays a role in teacher recruitment. A number of states have used signing bonuses in ad-dition to a teacher’s salary to attract teachers to hard-to-serve areas or to hard-to-place positions, such as math and science. The Mission Possible ini-tiative in Guilford County, North Carolina, is one such program that provides recruitment bonuses. A math teacher can earn a recruitment bonus of $5,000 per year for working in a hard to staff school and a performance bonus of up to $12,000 each year (see sidebar, Mission Possible).28
These financial incentives can play an even greater role in retaining teachers and targeting those who are most effective in raising achieve-ment. A 2010 review of math and science teacher turnover found that 46.3 percent of science teach-ers and 59.9 percent of math teachteach-ers reportedly left their school because of salary reasons.29 A fur-ther analysis found that low salaries were the pri-mary determinant for science teacher departures, although salary did not play as significant a role for math teacher departures.
In 2005, Denver, Colorado, implemented Pro-Comp, a compensation system that links teacher pay to the school district’s instructional mission.30 Under the ProComp program, teachers can receive salary increases and/or bonuses by meeting mea-sures such as:
• Working at a to-serve school or in a hard-to-staff position (e.g., math);
of science but also how to apply science to real-world problems.26 The framework’s introduction states:
We anticipate that the insights gained and inter-ests provoked from studying and engaging in the practices of science and engineering during their K–12 schooling should help students see how sci-ence and engineering are instrumental in address-ing major challenges that confront society today, such as generating sufficient energy, preventing and treating diseases, maintaining supplies of clean water and food, and solving the problems of global environmental change. In addition, al-though not all students will choose to pursue ca-reers in science, engineering, or technology, we hope that a science education based on the frame-work will motivate and inspire a greater number of people—and a better representation of the broad diversity of the American population—to follow these paths than is the case today.
The next step is for the states to translate the frame-work into a set of educational standards that can guide the work of curriculum development, assess-ment, and teaching. This work is being carried out by Achieve in collaboration with teams from 20 states. The goal is to complete the development of what are being called the Next Generation Science Standards by the end of 2012.27
recruit and retain more Qualified and effective teachers
To improve K–12 STEM instruction, states will need to recruit more qualified math and science teachers to the classroom. In addition, states will need to focus on policies that retain their most ef-fective instructors. Although more qualified math and teachers are needed, a major problem affecting the supply-and-demand balance today is the high number of skilled teachers who depart for non-re-tirement reasons.
To reduce departures and fill these hard-to-place jobs, states can utilize financial incentives, provide support systems, and improve institutional conditions. In particular, once placed, polices must focus on retaining the teachers who prove most ef-fective in raising achievement.
mIssIon PossIBle
The Mission Possible program in guilford County, north Carolina, awards both recruitment and retention as well as performance bonuses to qualifying teachers. a math teacher can earn a recruitment bonus of $5,000 per year for working in a hard to staff school and a perfor-mance bonus of up to $12,000 each year. One month after the program was approved in 2006, the district had 174 applicants to teach math, compared with just seven the year before. Moreover, 87 percent of the teachers from the 2006–2007 school year returned the next year.
28 | Building a SCiEnCE, TEChnOlOgy, EnginEEring and MaTh EduCaTiOn agEnda • Obtaining advanced degrees and certifications
or completing specialized professional develop-ment;
• Exceeding student achievement expectations on the state assessment; and
• Working in a school with a significant growth rate in achievement.
A 2010 evaluation of the program found:
• Mathematics and reading achievement has in-creased substantially from 2002–2003 to 2002– 2009;
• Schools with greater rates of ProComp partici-pation experienced higher rates of retention (11 percent since the program started);
• Schools designated “hard to serve” with greater rates of ProComp participation experienced a sharp increase in retention rates in 2006–2007, the first full year ProComp was implemented; and • In 2009, annual combined salary incentives per
teacher averaged $7,000.
Other incentive pay models similar to the above examples are in use throughout the country, and many have shown positive results in terms of placement, retention, and—most notably—teacher performance.
Improve Institutional Conditions to Promote Retention
Institutional conditions also can be a major factor in retaining math and science teachers. Institution-al conditions include student behaviorInstitution-al problems, the effectiveness of the school leadership and ad-ministrative support, the availability of classroom resources, the degree of faculty input into school-wide decisions, the degree of classroom autonomy held by teachers, and the usefulness of professional development in subject-content areas. Many of these conditions are statistically related to math and science teacher turnover.31
For math teachers, studies show that strong de-terminants for leaving include the amount of
au-tonomy a teacher is given in the classroom, degree of student discipline problems in the school, and the extent to which there is useful professional de-velopment. Surprisingly, math teachers also pre-ferred larger schools and were more likely to depart small schools.
As mentioned before for science teachers, the strongest factor in leaving is the potential salary of-fered by school districts. Other factors affecting sci-ence teacher turnover are the degree of student dis-cipline problems in the school and the usefulness of professional development.32
The findings suggest that, beyond salary, states, schools, and districts can take several actions to help retain more math and science teachers that may not involve increased investments. These include main-taining discipline, providing strong leadership, giv-ing teachers input regardgiv-ing schoolwide decisions, providing some classroom autonomy, and—most importantly—providing relevant and useful profes-sional development opportunities.
Some states have created special support sys-tems for math and science teachers. For example, the Dayton Regional STEM Center coordinates an established network of regional institutions and professionals that provides STEM teachers with training and curriculum support.33 Similarly, the Arizona Center for STEM Teachers provides K–12 teachers with professional development courses to improve STEM instruction and online forums for teachers to share experiences. Centers like these often are created with the help of federal and private grants.34
Provide rigorous Preparation for stem students Students pursuing STEM postsecondary study need strong preparation in high school to succeed in their studies and obtain a STEM degree. Data show that 54.9 percent of students entering STEM postsecondary fields obtain a degree within six years, but only 41 percent complete their degree in that field within six years.
Strong academic preparation in high school leads to higher STEM completion rates. Thus, students
who take more rigorous courses like trigonometry, pre-calculus, or calculus have higher rates of STEM degree completion. In addition, new studies are be-ginning to show that students who had research ex-perience in high school, who were mentored as an apprentice or intern, and whose teachers connected content across different STEM courses were more likely to complete a STEM major than their peers who did not have these experiences.35
States have taken a number of actions to promote programs that can give students access to strong preparation, rigorous courses, and opportunities to apply STEM in hands-on projects. These new ap-proaches to teaching STEM include:
• STEM-themed specialty schools;
• Opportunities for earning early college credit; • Studies linked to future certificate and degree
paths in key industrial sectors; and • Access to online courses in STEM.
Many of these programs work together. For exam-ple, a STEM school may offer both online STEM courses and access to early college credit.
STEM Schools
STEM specialty schools provide students with a rigorous, college-ready, STEM-focused curriculum while also preparing pupils for higher level study and professional futures in STEM.
Although the STEM school model varies across the country, most focus on high school. The schools place a heavy emphasis on science, technology, en-gineering, and math and the teaching environment goes beyond the classroom. Students usually spend significant time working on group projects, and they often receive help from practicing engineers, inventors, and scientists. Many schools also place students in study-related jobs after school.
High Tech High (HtH) in California is an ex-ample of a specialty STEM school. HtH began in 2000 as a charter high school launched by a coali-tion of San Diego business leaders and educators. It is now an integrated network of schools spanning grades K–12. It houses a comprehensive teacher certification program and a new, innovative Gradu-ate School of Education.
30 | Building a SCiEnCE, TEChnOlOgy, EnginEEring and MaTh EduCaTiOn agEnda Students pursue personal interests through projects and compile their work in personal digital portfolios. Facilities are tailored to individual and small-group learning, including networked wire-less laptops, project rooms for hands-on activities, and exhibition spaces for individual work. Stu-dents go outside the classroom to learn. Juniors complete a semester-long academic internship in a local business or agency, and seniors develop sub-stantial projects that address problems of interest and concern in the community. In earlier grades— ninth and 10th grade as well as middle school—stu-dents may “shadow” an adult through a workday, perform community service in a group project, or engage in “power lunches” with outside adults on issues of interest.
Since 2008, HtH has partnered with the Nation-al Student Clearinghouse to examine the college completion rates for each of its students. In 2011, National Student Clearinghouse data indicated that 77 percent of HtH alumni are still enrolled or have graduated from a postsecondary institution, with
25 percent of these college graduates earning STEM degrees. In comparison, fewer than 30 percent of California adults in their twenties have a college de-gree, according to data from the U.S Census Bureau, and only 17 percent of the state’s college students earn degrees in the STEM fields.36
There are many examples of STEM schools throughout the country and a variety of ways to de-sign the schools and curricula (e.g., see the Linked
Learning sidebar).37 They can be created as charters, as magnet schools, or as academies within or sepa-rate from existing schools. The vast majority are in the public school system. An excellent overview of the different types of STEM specialty schools can be found in the report, Successful K–12 STEM
Edu-cation: Identifying Effective Approaches in Science, Technology, Engineering, and Mathematics.38
Early College
Early college high schools blend high school and college in a rigorous and supportive program that compresses the time it takes to complete a high
lInked leArnIng
ConnectEd: The California Center for College and Ca-reer uses a “linked learning” model for STEM. linked
learning students follow industry-themed pathways in a wide range of fields, such as engineering, arts and me-dia, biomedicine, and health. These pathways prepare high school students for careers through a range of postsecondary options, including attending a two- or four-year college or university, an apprenticeship, the military, and formal employment training. as described on the ConnectEd website, the four core components of linked learning are:
• an academic component that includes English, mathematics, science, history, and foreign language courses that prepare students to transition, without remediation, to the state’s community colleges and universities as well as to apprenticeships and formal employment training programs.
• a technical component of three or more courses that help students gain the knowledge and skills that can give them a head start on a successful career. • a series of work-based learning opportunities that
begin with mentoring and job shadowing and evolve into intensive internships, school-based en-terprises, or virtual apprenticeships.
• Support services such as counseling and supple-mental instruction in reading, writing, and mathe-matics that help students master the advanced academic and technical content necessary for suc-cess in college and career.
a number of school districts in California are imple-menting linked learning pathways in their high schools. To implement a certified pathway, the schools must show adherence to several criteria, including providing professional development and growth opportunities for pathway teachers.
school diploma by providing the opportunity to earn college credits, often tuition-free.
A newly opened example is the Wake NC State STEM Early College High School, a joint project of the Wake County (North Carolina) Public School System, North Carolina State University, and the North Carolina New Schools Project. STEM is the theme of the school’s program. The early college high school lets Wake County students earn a high school diploma and up to two years of college cred-it at the same time. Students must be interested in science, technology, engineering, and/or math. Stu-dents who will be the first in their family to earn a college degree are encouraged to apply. The pro-gram is free to students, even when they are taking college classes.
Another example is the Metro Early College High School in Ohio, initially funded by a $560,000 operating grant from Battelle and supported by a $1.2 million infrastructure gift from the Ohio State University.39 The school is operated by the Educa-tional Council, a partnership of Franklin County’s 16 school districts.
The learning experience is divided into two dif-ferent phases: preparation and exploration (called Core Prep) and internships and access to college (called College Access). During the Core Prep phase, ninth- and 10th-grade students focus on learning that promotes performance. To exit the preparatory phase, students must demonstrate performance in mathematics, science, social stud-ies, and language arts. This performance demon-stration includes successfully passing the Ohio Graduation Tests and completing tasks that show-case a student’s ability to work independently and in groups to investigate solutions to real-world problems.
After demonstrating mastery of the Core Prep phase, 11th- and 12th-grade students participate in a curriculum that is focused on “learning outside of the school walls.” For example, students may choose a math- or science-focused curriculum where they work with field engineers and take corresponding engineering courses at the Ohio State University or Columbus State Community College.
Student experiences go beyond traditional in-ternships by including demonstrations of problem solving and critical thinking in partnership with the learning lab. The result is a holistic program: Core Prep focuses on capacity building, and College Ac-cess focuses on practical experiences, skill develop-ment, social maturity, critical thinking, and respon-sibility.
STEM schools and early college programs often are not overly selective and have been shown to sig-nificantly boost high school and college achieve-ment for both minority and disadvantaged students who participate.
Online STEM Learning
Online learning gives students access to STEM courses they may not have in their current school. These courses can supplement the current learning environment by allowing students to practice skills they studied in the classroom. Online learning often is combined with on-site study in STEM high schools and early college environments, although some states have entirely virtualized high schools and STEM curricula.