TRAIT-BASED INFERENCE OF ENVIRONMENTAL CONSTRAINTS ON LICHEN EPIPHYTE COMMUNITIES AT MULTIPLE SPATIAL SCALES
Jessica Coyle
A dissertation submitted to the faculty at the University of North Carolina at Chapel Hill in partial fulfillment of the requirements for the degree of Doctor of Philosophy in the Department
of Biology.
Chapel Hill 2016
Approved by:
Allen Hurlbert
Charles Mitchell
Robert Peet
Joel Kingsolver
ii © 2016 Jessica Coyle
iii
ABSTRACT
Jessica Coyle: Trait-based inference of environmental constraints on lichen epiphyte communities at multiple spatial scales
(Under the direction of Allen Hurlbert)
Ecological systems respond to processes that operate at a variety of spatial scales.
Epiphytic lichens are a useful group for studying community response to cross-scale
environmental variation because tree and forest architecture organize epiphyte communities into discrete hierarchical scales and because lichens’ limited homeostatic ability makes them
potentially sensitive environmental indicators. Examining variation in the functional traits of
organisms can elucidate the role of the environment in structuring communities because these
traits provide a direct link between organismal fitness and environmental filters. For lichens,
such trait-based approaches are not yet fully developed.
This dissertation examines how lichen traits can provide insight into environmental
constraints on communities across multiple spatial scales. The primary goals of this research
were to 1) evaluate the extent to which larger-scale processes influence lichen epiphyte
communities at smaller scales and 2) assess the utility of functional versus morphological
trait-based approaches for understanding community assembly in lichen epiphytes. I utilized a
national forest inventory (U.S. Forest Service) and conducted two field-based surveys in
temperate deciduous forests across North Carolina (U.S.A.) to assess environmental factors
affecting lichen assemblages at three focal scales: forest patches, tree trunks, and individual
branches within tree canopies. To evaluate trait-based approaches, I quantified the response of
iv
whether observed relationships were consistent with hypothesized environmental constraints.
Results highlighted a previously underappreciated role for larger-scale processes in
determining the composition of lichen epiphyte assemblages at multiple scales, but also revealed
high community variability at small scales, which was not well accounted for by linear
environmental models. This suggests a potentially important role for stochasticity in lichen
community formation. Analyses also indicated that future development of trait-based approaches
to lichen community studies should focus on quantifiable and functionally interpretable traits
rather than the categorical characters used for species identification. This research demonstrates
that traits are a useful, but not powerful, tool for understanding processes shaping lichen
ACKNOWLEDGEMENTS
I thank my advisor, Allen Hurlbert, for his consistently insightful advice and mentorship
as I dove headlong into a study system new to both of us. Allen has had a profound impact on
my writing and approach to research and mentoring. I also thank my thesis committee; François
Lutzoni, Robert Peet, Charles Mitchell, and Joel Kingsolver for their enthusiasm and willingness
to provide guidance on a topic outside of their primary areas of expertise as well as for helpful
reviews of previous drafts of dissertation chapters. In addition, all members of my committee
generously provided field equipment and laboratory facilities critical to the success of this
research. The direction of my thesis and my thinking on traits and community assembly were
initially developed and shaped by discussions with the Dimensions of Biodiversity Distributed
Graduate Seminar team: Bianca Lopez, Kyle Palmquist, Fletcher Halliday, and Peter Wilfahrt. I
am fortunate to have them as colleagues and friends. This research concluded in a timely manner
only through the work of several field- and lab-assistants and I am grateful for their efforts:
Mariah Goodman, Holly Pittard, Elias Athey, Jesse Fitzpatrick, Zach Mackenzie, Alex Gerber,
Brian Sherman, Michael Auriemma, Sarah Krantz, Shelly Guo, Saloman Ariza, Ivy Somocurcio,
Miguel Sandoval, and Bolu Aluko. This research also relied heavily on existing data on lichen
distributions and climate and I want to acknowledge all those involved in collecting these data
and making them publically accessible. In particular, thanks to Sarah Jovan for assistance
locating data associated with the former Forest Health Monitoring Program. I would like to thank
Water Dog Farms, Duke Forest, the U.S. Forest Service, North Carolina State Parks and the
vi
Herbarium for access to research facilities. This research was financially supported by the
National Science Foundation, the Royster Society of Fellows, and Highlands Biological Station.
Finally, I would like to express my deep gratitude to Joseph E. Pogue for endowing the
TABLE OF CONTENTS
LIST OF TABLES ... x
LIST OF FIGURES ... xii
INTRODUCTION ... 14
CHAPTER 1: ENVIRONMENTAL OPTIMALITY, NOT HETEROGENEITY, DRIVES REGIONAL AND LOCAL SPECIES RICHNESS IN LICHEN EPIPHYTES ... 17
Introduction ... 17
Methods... 20
Data ... 20
Models... 22
Results ... 25
Geographic distribution of lichen richness ... 25
Variation partitioning ... 25
Multi-model inference and parameter estimation ... 27
Discussion ... 28
Regional control of local communities ... 28
Dominance of environmental optimality over heterogeneity across scales ... 30
Implications beyond lichen ecology ... 33
CHAPTER 2: SPATIAL VARIANCE IN DIVERSITY AND FUNCTIONAL STRUCTURE OF LICHEN EPIPHYTE ASSEMBLAGES IN DECIDUOUS FORESTS OF THE SOUTHEASTERN UNITED STATES ... 44
Introduction ... 44
Methods... 46
Study location ... 46
Environmental data ... 47
Lichen community assessment ... 48
viii
Results ... 52
Community variation across scales ... 52
Community response to environment ... 53
Discussion ... 54
Epiphyte community assembly ... 54
Utility of taxon-free surveys of lichens ... 56
Future directions ... 58
CHAPTER 3: DETECTION OF ASSEMBLY PROCESSES IN OBLIGATE MUTUALIST COMMUNITIES USING MORPHOLOGICAL TRAITS ... 67
Introduction ... 67
Methods... 71
Data collection ... 71
Evaluation of hypotheses ... 72
Results ... 75
Discussion ... 77
CHAPTER 4: INTRASPECIFIC VARIATION IN EPIPHYTE FUNCTIONAL TRAITS REVEALS LIMITED EFFECTS OF MICROCLIMATE ON COMMUNITY ASSEMBLY IN TEMPERATE DECIDUOUS OAK CANOPIES ... 90
Introduction ... 90
Methods... 93
Study Location and Data Collection ... 93
Lichen Functional Traits ... 95
Analysis of taxonomic community composition ... 96
Analysis of functional trait variation ... 97
Results ... 99
Taxonomic community composition ... 99
Variation in traits of individuals ... 100
Variation in sample-mean traits ... 101
Discussion ... 102
CONCLUSIONS... 116
ix
Utility of morphological and functional traits ... 117
DATA ACCESSIBILITY ... 120
APPENDIX 1: ADDITIONAL INFORMATION FOR CHAPTER 1 ... 121
Additional methodological information ... 121
Derivation of environmental covariates ... 121
Calculation of regional species richness ... 123
Additional results ... 129
APPENDIX 2: ADDITIONAL INFORMATION FOR CHAPTER 2 ... 132
Site characteristics and locations ... 132
Estimation of light transmittance from canopy photographs ... 134
Trait variation across plots ... 136
APPENDIX 3: ADDITIONAL INFORMATION FOR CHAPTER 3 ... 142
Within-sample trait dispersion along environmental gradients ... 142
Effects of tree size on lichen abundance and growth form ... 146
APPENDIX 4: ADDITIONAL INFORMATION FOR CHAPTER 4 ... 148
Trait differences among genera ... 148
Species distributions along environmental gradients ... 160
Individual trait models ... 164
Mean trait models ... 171
LIST OF TABLES
Table 1.1- Environmental variables included in analyses ... 36 Table 1.2- Linear models of macrolichen species richness used for variation
partitioning ... 37 Table 1.3- Importance and effects of local scale environmental variables on
local macrolichen species richness ... 38 Table 1.4- Importance and effects of regional scale environmental variables
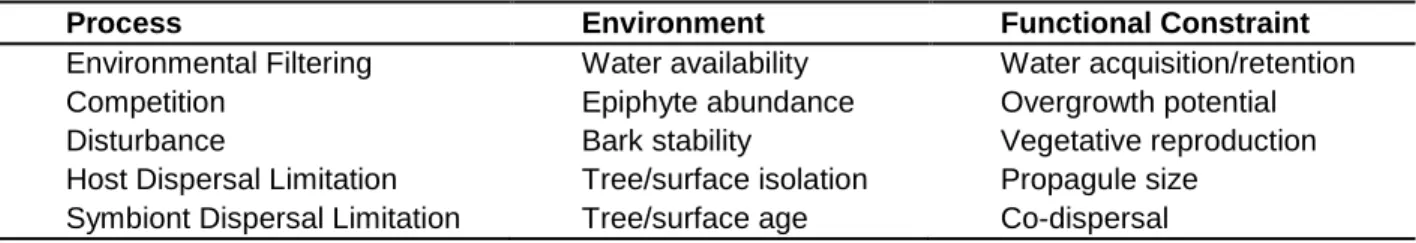
on regional macrolichen species richness ... 39 Table 2.1- Descriptions of morphological traits ... 60 Table 2.2- Variance in sample-level trait values across scales ... 61 Table 3.1- Environmental factors driving assembly processes in epiphyte
communities and their associated functional constraints on lichens ... 83 Table 3.2- Trait-environment relationship hypotheses and an evaluation
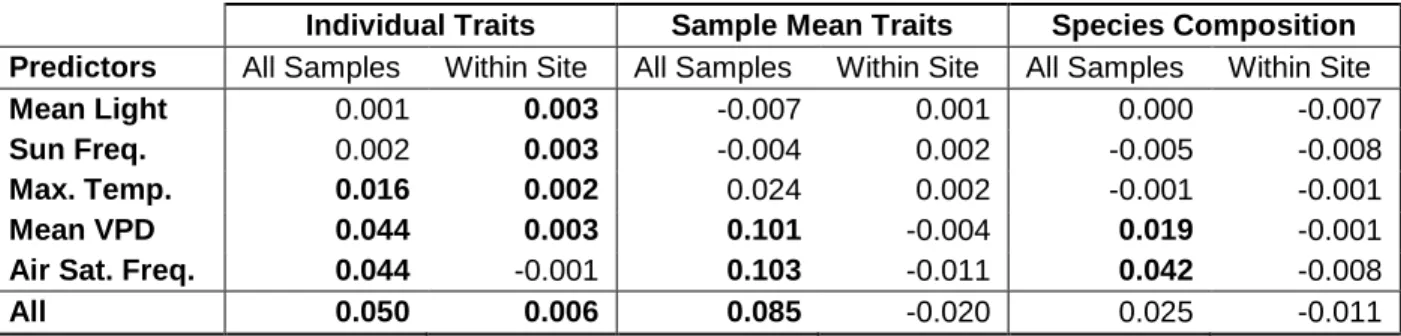
of supporting evidence ... 84 Table 3.3- Effects of water-availability on lichen traits ... 85 Table 4.1- Lichen functional traits ... 108 Table 4.2- Taxonomic and functional community variation explained by
environmental covariates ... 109 Table A1.1- Percentage of FIA plots with different numbers of CNALH
records within different distances ... 126 Table A1.2- Support for unimodal versus linear relationships between local
lichen richness and local-scale environmental variables ... 127 Table A1.3- Support for unimodal versus linear relationships between
regional lichen richness and regional-scale environmental variables ... 128 Table A1.4- Importance and effects of environmental optimality variables
on local macrolichen species richness ... 129 Table A1.5- Importance and effects of environmental heterogeneity variables
on local macrolichen species richness ... 130 Table A1.6- Importance and effects of variable quadratic terms on local or
xi
Table A2.2- PCA of plot-level climate variables... 132
Table A2.3- Tree species sampled across ecoregions ... 133
Table A2.4- Estimated effects of environmental variables on community structure metrics ... 139
Table A4.1- Number of thalli of each species used for trait measurements ... 148
Table A4.2- Linear model slopes for individual trait models fit to each genus separately ... 157
Table A4.3. Environmental differences between sites ... 160
Table A4.4- Logistic models of species’ occurrence along canopy microclimate gradients in Duke Forest ... 161
Table A4.5- Trait loadings and eigenvalues of a PCA of individual thallus traits ... 168
Table A4.6- Trait loadings and eigenvalues of PCA of individual thallus traits from foliose taxa only ... 168
Table A4.7- Statistics from RDAs of individual thallus traits constrained by environmental variables ... 170
xii
LIST OF FIGURES
Figure 1.1- Map of lichen species richness in 1,923 forest plots ... 40
Figure 1.2- Proportion of variation in lichen species richness explained by different sets of environmental variables ... 41
Figure 1.3- Effects of local and regional climate variables on local macrolichen species richness ... 43
Figure 2.1- Nested survey design... 62
Figure 2.2- Variation in community structure across scales ... 64
Figure 2.3- Distribution of average frequency, morphotype richness and functional diversity across plots ... 65
Figure 2.4- Variation in community structure explained by environmental variables ... 66
Figure 3.1- Interaction between effects of bryophyte cover and site maximum annual vapor pressure deficit (VPD) on community-weighted mean level of lichen attachment to the bark .... 86
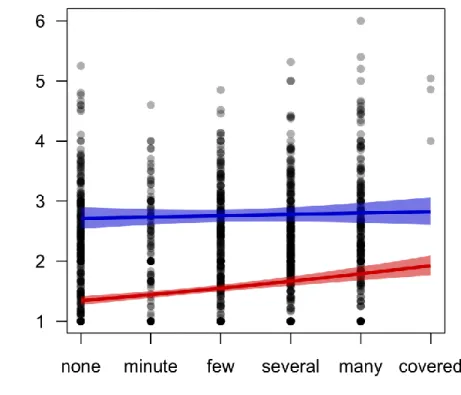
Figure 3.2- Community mean thallus attachment level and proportion of crustose lichens regressed on epiphyte abundance ... 87
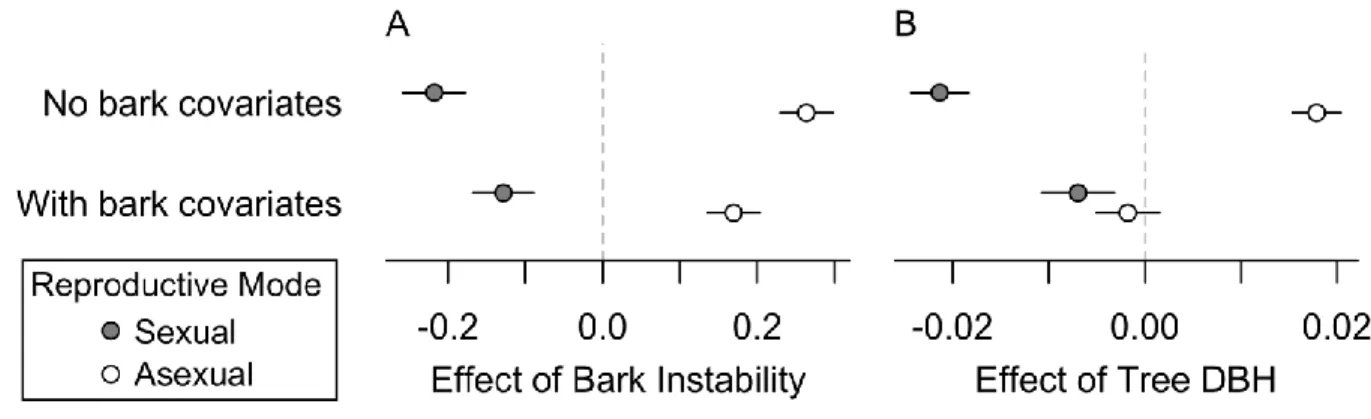
Figure 3.3- Estimated marginal effects of substrate instability and tree diameter on lichen reproductive mode ... 88
Figure 3.4- Predicted total frequency (NTOT) of lichens exhibiting different reproductive modes as a function of tree diameter (DBH) ... 89
Figure 4.1- Examples of trait-environment relationships predicted by mixed models of traits of individual thalli ... 110
Figure 4.2- Estimated variance components from mean VPD models ... 112
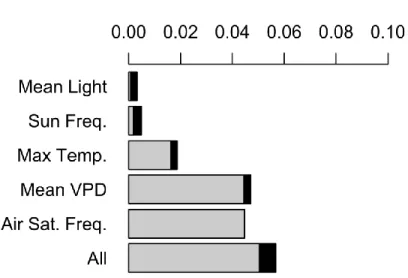
Figure 4.3- Trait variance explained by each environmental covariate ... 114
Figure 4.4- Variance in sample-mean traits explained by each environmental variable ... 115
Figure A1.1- Rarefaction of regional species richness within 500 km of four FIA plots ... 124
Figure A1.2- Map of regional species richness using different sampling radii ... 125
Figure A2.1- Variation in growth form across plots ... 136
Figure A2.2- Variation in foliose lichen traits across plots ... 137
xiii
Figure A2.4- Spatial variability of important tree and sample scale environmental variables ... 141
Figure A3.1- Within-sample variation growth form along gradients of epiphyte abundance and climatic water availability ... 143
Figure A3.2- Within-sample attachment diversity along gradients of epiphyte abundance and climatic water availability ... 144
Figure A3.3- Within-sample lobe dissection diversity versus annual maximum vapor pressure deficit ... 144
Figure A3.4- Within-sample variation in lichens exhibiting asexual reproduction along a gradient of bark instability ... 145
Figure A3.5- Changes in total lichen frequency (NTOT) with tree diameter ... 146
Figure A3.6- Predicted shifts in growth form and bryophyte cover with tree diameter ... 147
Figure A4.1- Trait distributions across genera ... 149
Figure A4.2- Trait distributions for species within Parmotrema ... 153
Figure A4.3- Predicted effects of mean light on WHCDM and CHLTOT estimated for each genus separately ... 159
Figure A4.4- Predicted distributional changes along humidity gradients... 163
Figure A4.5- Comparison of estimated environmental effects on individual traits with and without controlling for site differences ... 164
Figure A4.6- Variance components for individual trait models with mean VPD fit to foliose thalli only ... 166
Figure A4.7- Proportion of variance of individual thallus traits explained by environment variables, taxonomic identity, site location, and their joint effects ... 169
Figure A4.8- Proportion of variation in sample-level mean traits attributable to intraspecific variability and species turnover ... 171
Figure A4.9- Variation in sample-mean traits explained by environmental variables ... 173
14
INTRODUCTION
Species assemblages are formed and change through environmental processes operating
at multiple spatial scales. A full understanding of the consequences of current and future
environmental variation requires synthetic, cross-scale research. Epiphytic lichens are a useful
system in which to study community response to environmental variation across scales. The
fractal topology of forests conveniently organizes epiphyte communities into discrete,
hierarchical scales. Furthermore, lichens’ limited homeostatic ability, comparatively simple
physiology and sessile nature reduce the dimensionality of potential responses to external
conditions, leading to relatively straightforward prediction of how communities should respond
to environmental variation.
Despite their diversity and ubiquity across all global biomes (Galloway 2008), studies of
lichens comprise a small fraction of the ecological literature pertaining to scale (Dettki & Esseen
1998; Will-Wolf et al. 2006; Jüriado et al. 2009; Lisewski & Ellis 2011). Underutilization of
lichens as a system for testing general ecological theory may stem from the difficulty of species
identification in community samples where lichen thalli often lack distinguishing characters.
Development of trait-based survey methods that translate lichen community variation from
species identities into a language of structure and function would make lichen-based studies
accessible to a broader ecological audience as well as facilitate cross-system comparison. Over
the last five years, studies that measure and interpret functional trait variation in lichen
communities have become more prevalent (e.g. Lewis & Ellis 2010; Gauslaa & Coxson 2011;
15
2015; Nascimbene & Marini 2015; Nelson et al. 2015), but have offered little guidance a to the
utility of different traits. Defining a set of functionally relevant and easily measured traits is
challenging, but critical for the development of a trait-based approach for lichens (Ellis 2012).
Fortunately, a large body of prior research on lichen physiology and autecology provides a
strong foundation (Nash 2008).
In this dissertation I examine how different lichen traits provide insight into
environmental constraints on communities across spatial scales. The primary goals of this
research are to 1) evaluate the extent to which local-scale lichen communities are influenced by
larger-scale processes and 2) assess the utility of functional versus morphological traits for
understanding community assembly in lichen epiphytes. I assess the contribution of large-scale
processes to the assembly of lichen communities at three focal spatial grains: forest patches, tree
trunks, and individual branches, corresponding to three main data sets. In Chapter 1 I compare
the relative effects of regional and local process on lichen species richness in forest patches using
data from the U.S. Forest Service and the Consortium of North American Lichen Herbaria. For
Chapters 2 and 3 I conducted lichen surveys across forests of the Piedmont and Blue Ridge
Mountains ecoregions of North Carolina (U.S.A.) to measure the effects of substrate and
site-level environmental factors on the functional structure of lichen assemblages on tree trunks. I
explore within-tree environmental gradients in Chapter 4 by assessing functional and taxonomic
variation among lichen assemblages on branches within oak (Quercus rubra) tree canopies. To
evaluate the utility of different morphological (Chapters 2 and 3) and functional (Chapter 4)
traits for revealing constraints on lichen community assembly, I quantify the response of
16
variance explained, and whether trait-environment relationships are consistent with predictions
17
CHAPTER 1: ENVIRONMENTAL OPTIMALITY, NOT HETEROGENEITY, DRIVES REGIONAL AND LOCAL SPECIES RICHNESS IN LICHEN EPIPHYTES Introduction
Which environments support more species? Answering this question is a prerequisite for
explaining the global distribution of biodiversity and providing practical guidance for its
conservation. Recently and historically, environmental heterogeneity has been proposed as a
primary driver of biodiversity across a wide range of spatial scales (McIntosh 1985; Stein,
Gerstner & Kreft 2014). At small scales, where interacting individuals form a multi-species
community, environmental heterogeneity provides a greater variety of niches for species with
different ecological requirements (MacArthur 1964) and facilitates fitness trade-offs that limit
competitive exclusion, when species require similar resources (Amarasekare 2003). At regional
to global scales, heterogeneity can increase species richness by aggregating species pools from
different habitat types (Hortal et al. 2009) as well as by altering rates of speciation (Hughes &
Eastwood 2006) and persistence through climate fluctuations (Fjeldså, Bowie & Rahbek 2012).
Many other contemporary environmental factors have been proposed as primary drivers
of species richness at various scales, including water and energy, productivity, nutrients, edaphic
conditions and disturbance (reviewed in (Whittaker, Willis & Field 2001). Specific mechanisms
by which each factor influences richness vary, but as a generalization, species cannot persist in
environments that do not meet their fundamental niche requirements and therefore richness has
18
or local extirpation. Correlations between species richness and environmental factors can arise when species’ physiology and ecology are constrained by a shared evolutionary and geographic
history, such that environmental conditions that match shared niche requirements support more
species (Currie et al. 2004; Wiens & Graham 2005).
The extent to which the number of species in an area relates to the ‘optimality’ of the
environment for multiple species versus the variety of environmental conditions available (i.e. ‘heterogeneity’) likely varies across systems and scales. Meta-analysis of environmental
correlates of species richness has shown greater explanatory ability of covariates related to
climate and productivity than covariates measuring environmental heterogeneity, particularly at
the largest spatial grains and extents (Field et al. 2009). This seems contrary to the wide-spread
support for positive richness-heterogeneity relationships (Lundholm 2009), which also tend to be
strongest at larger spatial grains (Stein et al. 2014). These disparities suggest that a single study
investigating the relative influence of environmental heterogeneity and optimality on species
richness should strive to utilize data and methods that integrate across scales (e.g.
González-Megías, María Gómez & Sánchez-Piñero 2007). The mechanisms by which environmental
heterogeneity and optimality affect species richness differ with scale and should be accounted for
in analyses. Furthermore, processes regulating richness at small and large scales are linked by the
interdependence of environmental conditions across scales (Passy 2009) and the dispersal of
species amongst the local sites that comprise a larger region (Leibold et al. 2004). The
meta-community conceptualization of local-regional dynamics (Leibold et al. 2004) is a potentially
valuable framework for studying the influence of environmental heterogeneity and optimality on
species richness across spatial scales and could improve our understanding of how geographic
19
Our goal is to investigate how environmental heterogeneity and optimality regulate
species richness across spatial scales using analyses that explicitly consider these effects within a
local-regional hierarchy. We use data from a national survey of epiphytic lichen communities in
forests because lichen epiphytes are a biologically diverse group whose ecology offers an ideal
opportunity to evaluate hypotheses about the influence of the environment on communities
across spatial scales (Ellis 2012). As sensitive environmental indicators that are ubiquitous
globally in forested ecosystems (Nash 2008), lichens are well-suited to detecting how different
aspects of environmental variation can influence communities across a wide range of conditions.
In addition, forests vary greatly in structural composition and climatic setting, which allows
environmental heterogeneity and optimality to be measured at multiple spatial scales.
We first establish the geographic distribution of local and regional species richness for
non-crustose epiphytic lichens (e.g. ‘macrolichens’) across the United States using U.S. Forest
Service surveys of forest inventory plots and by aggregating Consortium of North American
Lichen Herbaria species records, respectively. We then relate species richness to environmental
covariates that characterize environmental heterogeneity and average environmental conditions
at local and regional scales in order to determine 1) the dependence of local richness on regional
processes, 2) whether species richness is primarily influenced by environmental heterogeneity or
optimality, and 3) whether the relative influence of these different aspects of the environment
differs between local and regional scales. Our approach is to use generalized linear models to
isolate the effects of categories of predictors of macrolichen species richness. Parameter
estimates and variation explained by these models are used to infer the importance of regional
and local processes in determining local richness and whether richness is primarily related to
20
Methods Data
We obtained macrolichen community data for 2,071 forest plots surveyed between
1997-2008 by the Forest Inventory and Analysis Lichen Community Indicator program (hereafter,
FIA) (Will-Wolf 2010). Data are available from:
http://apps.fs.fed.us/fiadb-downloads/datamart.html and http://www.fia.fs.fed.us/tools-data/other_data/default.asp. Subsets
of these data have been used to quantify environmental gradients affecting lichen community
structure in specific regions (McCune et al. 1997b; Jovan & McCune 2004; Will-Wolf et al.
2006), but species richness variation across the entire United States has not been previously
reported. Due to the survey methodology, plot-scale species richness in these data underestimates
the actual number of macrolichen species that are present and may more accurately be referred to as a ‘species richness index’ (Will-Wolf 2010). However, the standardized methodology does
allow comparison of richness differences across plots, even if the absolute estimates are
incorrect. After removing 44 plots with fewer than 2 adult trees, 100 plots for which
environmental data were not available, and 4 plots determined to be outliers, the final data set
consisted of 1,923 plots located in 29 states spanning the continental United States.
We estimated local species richness for each plot from surveys in which macrolichen
species were recorded from all woody substrates in an area of approximately 4000 m2 (within a 36.576 m radius circular plot) within a 2-hour time period (detailed survey methodology can be
found in Woodall et al. 2009; Will-Wolf 2010). To account for changes in taxonomy, species
names were standardized as recommended in the FIA documentation for analyses spanning all
regions. We then calculated local macrolichen species richness in each plot as the total number
of taxa occurring in a single survey, since only a few plots were surveyed multiple times.
21
Consortium of North American Lichen Herbaria database (CNALH 2014). We estimated
regional species richness for each plot as the number of taxa that occurred within a 500 km
radius of the plot, only considering taxa that are surveyed by the FIA program. To control for
geographic bias in overall sampling effort, regional richness estimates were based on a fixed
sample of 2,000 records. Distances shorter than 500 km did not contain enough herbarium
records to ensure an adequate sample of regional diversity, but yielded similar geographic
patterns of regional richness (see ‘Calculation of regional species richness’ in Appendix 1).
We derived forest structure and climate variables measuring environmental optimality
and heterogeneity at both local and regional scales (Table 1.1). Variables measuring
environmental optimality assess the central tendency (e.g. mean) of an environmental factor
within a plot or region surrounding a plot, whereas variables measuring heterogeneity assess the
dispersion of these factors (e.g. variance) within a plot or region. All local forest structure
variables were based on tree surveys conducted by the FIA program at the same plot locations
where lichens were surveyed. We estimated regional tree species richness within a 500 km radius
of each plot from tree species occurrences across all FIA plots. Local-scale climate variables
were obtained for each plot by intersecting plot geographic coordinates with several long-term
average climate maps obtained from WorldClim and PRISM data (Hijmans et al. 2005; PRISM
Climate Group 2013). Regional-scale climate variables were derived from the same data, with
regional means and variances calculated within a 500 km radius of each plot. One local climate
variable, total annual direct solar insolation, was calculated from field-measured topographic
slope, aspect, and latitude using functions in the insol package in R (Corripio 2014). In two cases
pairs of environmental variables were strongly collinear: annual precipitation and relative
humidity, and maximum tree diameter and tree size diversity. Therefore, we extracted two
22
used the orthogonal variables in all models (orthogonal variable names are High precip-high RH
/ High precip-low RH and Large trees / Tree size variation). Detailed descriptions of the
derivations of all environmental covariates are described in the ‘Additional methodological information’ section of Appendix 1.
The entire data set was randomly divided in half into training and testing data sets that
encompassed the same geographic range. To avoid over-fitting models, the training data set was
used during initial data exploration and model specification, during which we decided which
variables to include, whether to transform variables, and whether quadratic relationships should
be included. Final results were interpreted from models fit to the testing data set of 962 plots.
Models
To explore relationships between environmental covariates and local and regional
macrolichen species richness (SL and SR, respectively), we fit six models with different
combinations of sets of predictors: local heterogeneity variables (LH), local optimality variables
(LO), regional heterogeneity variables (RH) and regional optimality variables (RO) (see Table
1.2 for model abbreviations). Variables with strongly skewed distributions were transformed to
reduce the impact of extreme observations. Regional climate variance variables were all
log-transformed while bark moisture diversity and wood density diversity were square-root
transformed. To model local species richness, we used maximum likelihood to fit a generalized
linear model with a negative binomial error distribution and log link function, which was better
supported than a Poisson or normal error distribution (function glm.nb in R package MASS;
(Ripley et al. 2015). For regional species richness, we used maximum likelihood to fit a spatial
simultaneous autoregressive error model (function errorsarlm in R package spdep (Bivand et al.
23
radius circles around neighboring plots used to calculate regional scale variables. This attempts
to account for spatial autocorrelation induced by our method of calculating regional scale
variables. The algorithm we used to fit these models was unable to accommodate predictors with
variances that differed by several orders of magnitude. Therefore, since we were primarily
interested in the relative effect of different variables, we standardized variables to z-scores before
including them in the models. Because species richness might be expected to exhibit unimodal
relationships with some variables measuring environmental optimality, we included a quadratic
term for any variable where unimodal relationships were supported in single variable models.
This was determined for each variable by comparing the AIC of a univariate model with a linear
term or with an additional quadratic term, and accepting the relationship as ‘unimodal’ when the
quadratic term was negative (concave-down) and ΔAIC greater than 2.
Variation Partitioning
We used additive variation partitioning (Legendre & Legendre 2012) to test the relative
variation in local species richness explained by local versus regional environmental variables and
the variation in species richness explained by environmental heterogeneity versus optimality at
both local and regional scales. This procedure involves comparing the variation in the response
explained by nested models to determine the proportion of the variation that can be uniquely
attributed to the different sets of predictors in those models and that which is shared among
them. We made five comparisons using the models described in Table 2
1) Variation in local richness explained by all regional scale variables versus all local scale
variables (model L3, partitioning variance between L1 + L2)
2) Variation in local richness explained by regional scale versus local scale optimality
24
3) Variation in local richness explained by regional scale versus local scale heterogeneity
variables (model L9, partitioning variance between L7 + L8)
4) Variation in local richness explained by local heterogeneity versus optimality variables
(model L2, partitioning variance between L5 + L8)
5) Variation in regional richness explained by regional heterogeneity versus regional
optimality variables (model R3, partitioning variance between R1 + R2)
The first three comparisons assess the relative influence of local versus regional processes
on local macrolichen species richness whereas comparisons 4 and 5 assess the relative influence
of environmental heterogeneity versus optimality. Because models were GLMs and spatial
autoregressive models, we used the likelihood-ratio adjusted pseudo-R2 (Radj2) as the
goodness-of fit measure goodness-of variation explained (Nagelkerke 1991). Fractions goodness-of variation uniquely
explained by sets of variables were determined by adding and subtracting Radj2 values of the
appropriate models.
Multi-model inference and parameter estimation
We used model averaging to estimate the effects and importance of individual
environmental variables included in the linear models (Burnham & Anderson 2002). To compare
the effects of individual local versus regional predictor variables on local species richness we
computed parameter estimates and AICC for all possible sub-models of two full models: one
containing only heterogeneity variables (model L9) and one containing only optimality variables
(model L6), with the restriction that each submodel retained at least two predictor variables and
quadratic terms could not appear without their corresponding linear term. From these sets of
25
of the best model (i.e. an evidence ratio of 0.05). Parameter estimates and variable importance
were then calculated from these sets of more probable models. Variable importance was assessed
as the sum of the Akaike weights of all models in which a variable appears and its estimated
effect was calculated as the average of its effects in all models weighted by model Akaike
weights. We report standardized parameter estimates so that the relative effects of variables can
be compared, but do not report significance of individual predictors because such inferential tests
are not valid after this post-hoc analysis of such a large set of models (Burnham & Anderson
2002). We used the same procedure to compare the effects of individual heterogeneity versus
optimality predictor variables on local species richness (model L2) and regional species richness
(model R3).
Results
Geographic distribution of lichen richness
Local macrolichen species richness ranged from 1 to 37 species, with high richness
occurring in Maine, Washington, Oregon, California, and Idaho and low richness in the Great
Basin and other arid regions (Figure 1.1A). Regional species richness was highest in the Pacific
Northwest region and southern Appalachian Mountains, but low throughout the Great Basin and
Midwest (Figure 1.1B). The high regional richness in the southwestern deserts and southeastern
forests contrasted with the generally lower local-scale richness in these regions.
Variation partitioning
In univariate models, local species richness exhibited unimodal relationships with five
variables measuring environmental optimality and three variables measuring heterogeneity
26
one optimality variable and one heterogeneity variable (Appendix 1, Table A1.3). Quadratic
terms for these variables were included in subsequent models used for variation partitioning and
model averaging.
We compared three sets of models to determine the relative influence of local versus
regional scale variables on local macrolichen species richness. In each comparison, the model
with regional scale variables uniquely explained more variation than the model with local scale
variables despite having fewer estimated parameters (Figure 1.2A). When all variables were
included (model L3), the regional variable model uniquely explained 18% of the variation in
local richness, while the local variable model explained 8%. Among heterogeneity variables
(model L9) this disparity increased, with the regional model uniquely explaining 23% of the
variation and the local model explaining 9%. However, among models containing only variables
measuring environmental optimality (model L6), the proportion of variation in local richness
uniquely attributed to local versus regional variable models was approximately equal (11% and
12%, respectively). In addition, for all three comparisons the regional model had a much lower
AIC than the model containing only local-scale environmental variables.
To determine the relative influence of environmental heterogeneity versus optimality on
macrolichen species richness we compared two sets of models- one set predicting local richness
(model L2) and one set predicting regional richness (model R3). At both scales, models
containing variables measuring environmental heterogeneity explained very little unique
variation in species richness (Figure 1.2B). At a regional scale, variables measuring
environmental optimality uniquely explained at least four times more variation in regional
species richness than heterogeneity variables (26% vs. 7%). In models of local species richness,
the model with variables measuring environmental optimality uniquely explained 27% of the
27
optimality models at both scales also indicate that these variables are better predictors of species
richness than heterogeneity variables.
Multi-model inference and parameter estimation
In order to compare the effects of individual local- versus regional- scale variables on
local macrolichen species richness, we averaged parameter estimates from the best submodels of
two full models- one containing optimality variables (model L6) and one containing
heterogeneity variables (model L9). Of the 1,119,727 optimality submodels, 129 were identified
as being most likely (evidence ratio ≥ 0.05, compared to the best model) and were used for
parameter estimation (Appendix 1, Table A1.4). Following the same criterion, 52 out of 31,091
heterogeneity submodels were identified as the most likely and were used for parameter
estimation (Appendix 1, Table A1.5). We report standardized parameter estimates so that the
effects of variables can be compared.
In the optimality variable model (L6), the variables with the strongest effects on local
richness were all regional-scale climate variables: high precipitation – high RH (0.12), mean
annual temperature (-0.11), and isothermality (0.08). Aside from high precip.-low RH, the effects
of local-scale climate variables were always weaker than the effects of their regional
counter-parts (Figure 1.3). Six out of eleven local-scale optimality variables had no effect on local
richness. For the heterogeneity variable model (L9), every regional-scale variable was included
in all 52 top models, whereas only two local-scale heterogeneity variables, bark moisture
diversity and tree species diversity, exhibited the same level of importance. Regional tree species
richness and spatial variance in precipitation seasonality had the strongest effects (0.12 and 0.11,
respectively), but the inclusion of a negative quadratic term for both variables suggests that local
28
To compare the effects of individual variables measuring environmental heterogeneity
versus optimality, we averaged parameter estimates from the best submodels of a regional-scale
model of regional richness (model R3) and from the best submodels of a local-scale model of
local richness (model L2). Fourteen out of 4,608 regional submodels were identified as most
likely and used for parameter estimation, while 1,545 out of 3,359,214 local scale submodels
were used.
At the local scale, six variables measuring environmental optimality occurred in all 1,545
most likely models, whereas no variable measuring environmental heterogeneity did so. Of the
most important optimality variables, mean canopy density had the strongest effect (0.05),
followed by high precipitation – high RH (0.04), and solar radiation (0.03). All three of these
variables had negative quadratic effects, indicating concave-down relationship with local
richness. At the regional scale, all variables measuring environmental optimality had stronger
effects on regional species richness than all variables measuring heterogeneity and were included
in all 14 top models (Table 1.4). Regional mean isothermality had the strongest effect (1.19),
followed by regional mean annual temperature (-1.06) and precipitation seasonality (0.58).
Discussion
Regional control of local communities
Two lines of evidence suggest an important role for regional processes in determining
local richness of macrolichen communities in U.S. forests: the greater explanatory ability of
regional-scale variables in the variation partitioning analysis and the generally stronger effects on
local richness of individual variables measured at a regional rather than local scale. The only
other study to explicitly assess environmental drivers of local and regional richness in lichens
29
(Casanovas, Lynch & Fagan 2013). Other studies assessing the correlation between local
stand-scale lichen richness and landscape or regional-stand-scale predictors generally find little effect of
large-scale predictors compared to local environmental predictors (Nascimbene, Marini & Odor
2012; Kiraly et al. 2013) or of macroclimate compared to local forest structure (Moning et al.
2009; Ellis & Coppins 2010). The apparent contradiction between our finding that regional scale
processes are important for local richness and these previous results stems from a difference in
scale. In several previous studies, the purpose of examining landscape-scale predictors was to
assess whether dispersal of lichen species from older forest patches augments the number of
species in adjacent areas. The lack of evidence for landscape-scale enrichment of local richness
indicates that lichen species have the ability to disperse across landscapes at least over moderate
time-scales. Gjerde et al. (2012) suggest that dispersal limitation of species richness in nascent
forest patches disappears after 100 years. Our finding that regional processes impact local
macrolichen richness is also consistent with lichens having relatively high dispersal ability.
However, our study covered a much larger geographic extent and our ‘regional-scale’ variables
are measured over an area that in some cases would encompass the entire geographic extent of
prior landscape-scale studies. Dispersal rates may be high enough to homogenize local
communities and erase correlations between local richness and landscape attributes measured at
the scale of 10-100 km, yet meta-community models predict that moderate dispersal should
enhance correlations with regional variables measured at larger scales by strengthening the
relationship between local and regional richness (Mouquet & Loreau 2003).
Given the influence of regional-scale processes on local lichen richness, an important
avenue for further research is to determine the underlying cause of regional gradients of lichen
richness in North America. High dispersal ability would suggest that lichen distributions track
30
evidence for large-scale environmental filtering of a group of organisms with similar
physiological limitations. However, it is also possible that certain environments have a higher
capacity to support or evolve more species and that species niches evolved accordingly.
Quantifying the evolutionary flexibility of lichen niches would help to clarify the direction of
causality. Globally, only a handful of studies (Marini, Nascimbene & Nimis 2011; Casanovas et
al. 2013; Soto-Medina 2013) have assessed potential drivers of regional-scale lichen richness.
The continual development of large-scale species’ distributional data sets, such as CNALH, will
be crucial for understanding the generation of continental to global-scale diversity.
Dominance of environmental optimality over heterogeneity across scales
As in previous studies, environmental variables were better predictors of species richness
at the regional scale than at the local scale (Belmaker & Jetz 2011), but the contribution of
environmental optimality relative to environmental heterogeneity remained similar across scales.
Both variation partitioning and the individual parameter estimates support a stronger role for
environmental optimality over heterogeneity in determining macrolichen species richness. At
both local and regional scales, the optimality model independently explained substantially more
variation in richness than the heterogeneity model and the estimated effects of optimality
variables were mostly stronger than the estimated effects of heterogeneity variables.
Furthermore, heterogeneity variables did not appear to be increasing richness by increasing
available niches. Several heterogeneity variables had negative or unimodal relationships with
richness. Taken together, this evidence suggests that niche-based sorting among habitats is not a
general driver of local or regional macrolichen richness across the wide variety of forests in
31
Heterogeneity variables primarily explained variation in richness that could also be
attributed to variables measuring environmental optimality, particularly in the regional scale
models comprised mostly of climate variables. This means that changes in species richness are
mainly associated with changes in environmental heterogeneity that are also accompanied by
changes in mean conditions. Thus, it is not simply the variety of conditions that matter, but the
quality of those conditions.
The relatively weak independent influence of environmental heterogeneity across scales
is surprising in light of numerous studies showing that turnover in lichen epiphyte community
composition is strongly associated with environmental variation ranging from within a single tree
to across a landscape (Ellis 2012). Forest structural elements that introduce heterogeneity, such
as light gaps, trees of different ages and standing dead trees have frequently been identified as
contributing to lichen species richness (Moning et al. 2009; McMullin et al. 2010; Ellis 2012),
especially as pertaining to recommendations for maintaining diversity in managed forests
(Neitlich & McCune 1997). Species-sorting among trees with different bark properties can lead
to a correlation between tree species richness and lichen richness (Meier et al. 2005), a pattern
that extends to larger regional scales where forest types with greater tree species richness have
been found to support more speciose lichen flora (Jüriado, Paal & Liira 2003). However, the
strength of this correspondence between tree and lichen richness may depend on the region in
which a study has been conducted. In northern temperate to boreal forests complementarity
among lichen communities on hardwoods versus conifers leads to greater richness in mixed
forest types (Cleavitt, Dibble & Werier 2009). Yet, increasing tree species richness could have
much less of an effect in more diverse forests found at lower latitudes if adding tree species to
already moderately diverse forests does not create new niches for lichens. We found a weak
32
at the local scale. The overall weak effects of variables measuring local forest structure we find
in this study imply that there are not general relationships between macrolichen richness and
forest structure that are true for all U.S. forests. Hence, we reiterate the oft-given advice that care
should be taken when generalizing from studies conducted within smaller spatial extents and
furthermore suggest that decisions regarding forest management for lichen diversity be based on
regionally parametrized models (Will-Wolf et al. 2006).
If our data support the hypothesis that richness increases under conditions that are more
optimal for more species, what then is the optimal macrolichen niche? Like plants, lichens rely
on photosynthesis to obtain carbon for metabolic processes, hence light and water availability are
expected to be primary determinants of the distribution and abundance of lichen species (Harris
1971). The strong positive effects of precipitation and humidity on macrolichen richness that we
observe are in line with previous reports that water availability creates a strong physiological
constraint on poikilohydric lichens (Green, Nash & Lange 2008) and is a primary driver of lichen
richness at regional scales (Marini et al. 2011). This manifests geographically as centers of high
regional macrolichen diversity occurring in the Pacific Northwest and Northeastern regions and
the southern Appalachian Mountains. The inclusion of solar radiation and of mean canopy
density as two of the few local variables measuring forest structure with important effects on
macrolichen richness is consistent with previous findings that light availability is a determinant
of lichen richness (Moning et al. 2009; Rosabal et al. 2012). Unlike previous work, we found an
effect of climatic variables related to temperature: both regional and local species were higher in
areas with lower mean annual temperatures, and regional richness was higher in areas where
diurnal temperature variation approaches intra-annual variation. These results are surprising,
given that lichens are thought to have generally broad thermal optima that shift toward warmer
33
relationships may arise from underlying biogeographic variation unrelated to niche-based species
sorting and, as with any correlative modeling approach, caution should be used when interpreting
any single parameter estimate from our models. We base the support for our conclusions on the
aggregate trend of multiple predictors and do not recommend characterizing the optimal lichen
niche based solely on the effects of single predictors in our models. Furthermore, these
conclusions about environmental drivers of macrolichen species richness should not be
generalized to crustose lichens that grow embedded in their substrate because their morphology
may cause different responses to environmental variation (Nascimbene & Marini, 2015).
Implications beyond lichen ecology
Our results are generally consistent with a series of meta-analyses that have found that
the effect of environmental heterogeneity on richness is stronger or more frequently positive at
larger spatial scales (Tamme et al 2010, Stein et al 2014), but that when competed against other
hypotheses, climate, productivity and other measures of average environmental conditions better
explain variation than environmental heterogeneity (Field et al., 2009; Lundholm, 2009). There
has not been a comprehensive meta-analysis comparing the relative contribution of regional and
local factors to local richness, despite a recent increase in the number of studies that explicitly
consider both local and regional environmental factors in the same analysis. While several
studies find a greater explanatory role for local biotic and abiotic environmental filters over
regional processes (Harrison et al., 2006; White & Hurlbert, 2010; Wang et al., 2012), others
find approximately equal roles of local and regional processes (Passy, 2009; Kristiansen et al.,
2011). It is not clear whether our conclusions regarding macrolichens are anomalous or expected
given their dispersal potential and biogeographic history. A detailed review and analysis of this
34
system-specific biological features (e.g. traits or geographic contexts that influence dispersal) or
methodological decisions.
Targeted collection and analysis of data on organisms, guilds or systems with unique
properties provide opportunities to identify exceptions to patterns and ultimately develop more
comprehensive theories. Lichens are one example of an exemplary target for increasing the
generality of ecological studies because they disperse and reproduce like micro-organisms, yet
have long been collected and studied as macro-organisms. Thus, lichen diversity and
distributions are well-characterized compared to other fungi and microbes. This, combined with
a long evolutionary history, global distribution, and high sensitivity to the environment, makes
lichens a particularly rich yet underutilized research system. By shifting the focal unit of analysis
from species identity to species number and functional strategy (e.g. McCune 1993; Stofer et al.
2006; Rapai et al. 2012), lichen ecologists can both increase the scale of their analyses and
facilitate comparison across taxa and systems.
Explicit consideration of the contribution of environmental heterogeneity and optimality
to species richness within the context of local versus regional dynamics provokes general
questions about the interaction between scale and heterogeneity. For example, how does regional
heterogeneity alter the link between richness at regional and local scales? In a heterogeneous
region containing a diverse assemblage of species, dispersal amongst habitat patches may enrich
local sites to a greater extent than in a more homogenous region (e.g. mass effects) and lead to
stronger regional control of local richness. However, if the geographic features that create
regional heterogeneity also hinder propagule or individual movement, then reduced dispersal
could result in greater local-scale environmental control (Damschen & Brudvig 2012). Assessing
the conditions under which these scenarios occur would be a fruitful avenue for future research.
35
Conservation recommendations likely differ for species guilds that vary in how regional
heterogeneity affects dispersal or the extent to which diversity is constrained by average
environmental conditions versus environmental heterogeneity. Anthropogenic habitat
modification can increase or decrease environmental heterogeneity, depending on scale and level
of intensity (Seiferling, Proulx & Wirth 2014). This, coupled with region-wide changes in
climate makes it imperative that we be able to predict how different groups respond to
36
Table 1.1- Environmental variables included in analyses
Variables are sorted according to their scale (local or regional) and whether they measure central
tendency (optimality) or dispersion (heterogeneity). Detailed descriptions of variables and their
derivation can be found in Appendix 1. RH denotes relative humidity.
Regional Optimality Regional Heterogeneity
High precipitation-high RH (mean) High precipitation-high RH (var) High precipitation-low RH (mean) High precipitation-low RH (var) Precipitation seasonality (mean) Precipitation seasonality (var)
Isothermality (mean) Isothermality (var)
Mean annual temperature (mean) Mean annual temperature (var) Regional tree species richness
Local Optimality Local Heterogeneity
Mean bark moisture Bark moisture diversity
Mean wood density Wood density diversity
Large trees Tree size variation
Tree species diversity Tree species composition
Mean canopy density Canopy variability
Solar radiation % Trees dead
High precipitation-high RH High precipitation-low RH Precipitation seasonality Isothermality
37
Table 1.2- Linear models of macrolichen species richness used for variation partitioning
Responses are local (SL) or regional (SR) species richness and model statistics are for a full
model fit to all variables in each of the included categories: regional optimality (RO), regional
heterogeneity (RH), local optimality (LO), local heterogeneity (LH). Model forms are either a
generalized linear model with negative binomial error (GLM) or a spatial autoregressive error
model with normal errors (SAR). Reported model statistics are the likelihood ratio pseudo-R2, the number of estimated parameters (K), residual deviance, and AIC. Models with the lowest
AIC for each response variable are indicated in bold.
Model Response Predictors Form R2 K Deviance AIC
L1 SL RH + RO + SR GLM 0.55 18 966.44 5446.7
L2 SL LH + LO GLM 0.44 27 953.97 5671.3
L3 SL RH + RO + LH + LO + SR GLM 0.63 43 949.34 5317.2
L4 SL RO GLM 0.42 9 966.36 5667.9
L5 SL LO GLM 0.42 18 957.42 5694.6
L6 SL RO + LO GLM 0.54 25 952.81 5493.9
L7 SL RH GLM 0.31 10 979.23 5838.4
L8 SL LH GLM 0.18 11 984.30 6014.3
L9 SL RH + LH GLM 0.41 19 973.28 5715.1
R1 SR RH SAR 0.35 10 164.62 1078.9
R2 SR RO SAR 0.54 9 132.96 869.7
38
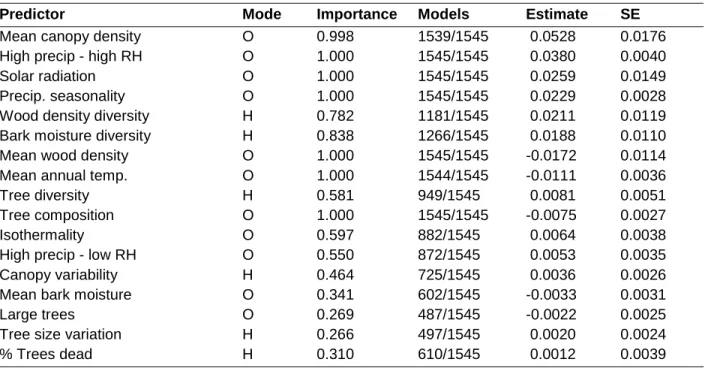
Table 1.3- Importance and effects of local scale environmental variables on local macrolichen species richness
Parameter estimates are averaged from the 1,545 most likely submodels (evidence ratio ≥ 0.05)
of a full model containing all local scale variables (model L2). Estimates are standardized to
enable comparison among variables. Variables are ordered from strongest to weakest estimated
effect on local richness. For each variable the table lists whether the variable measures
environmental heterogeneity (mode = ‘H’) or optimality (mode = ‘O’), the relative importance of
the variable (summed weights of submodels containing it), and the number of most likely
submodels in which the variable occurs (out of 1,545). Effects of variable quadratic terms can be
found in Appendix 1, Table A1.6.
Predictor Mode Importance Models Estimate SE
Mean canopy density O 0.998 1539/1545 0.0528 0.0176
High precip - high RH O 1.000 1545/1545 0.0380 0.0040
Solar radiation O 1.000 1545/1545 0.0259 0.0149
Precip. seasonality O 1.000 1545/1545 0.0229 0.0028
Wood density diversity H 0.782 1181/1545 0.0211 0.0119
Bark moisture diversity H 0.838 1266/1545 0.0188 0.0110
Mean wood density O 1.000 1545/1545 -0.0172 0.0114
Mean annual temp. O 1.000 1544/1545 -0.0111 0.0036
Tree diversity H 0.581 949/1545 0.0081 0.0051
Tree composition O 1.000 1545/1545 -0.0075 0.0027
Isothermality O 0.597 882/1545 0.0064 0.0038
High precip - low RH O 0.550 872/1545 0.0053 0.0035
Canopy variability H 0.464 725/1545 0.0036 0.0026
Mean bark moisture O 0.341 602/1545 -0.0033 0.0031
Large trees O 0.269 487/1545 -0.0022 0.0025
Tree size variation H 0.266 497/1545 0.0020 0.0024
39
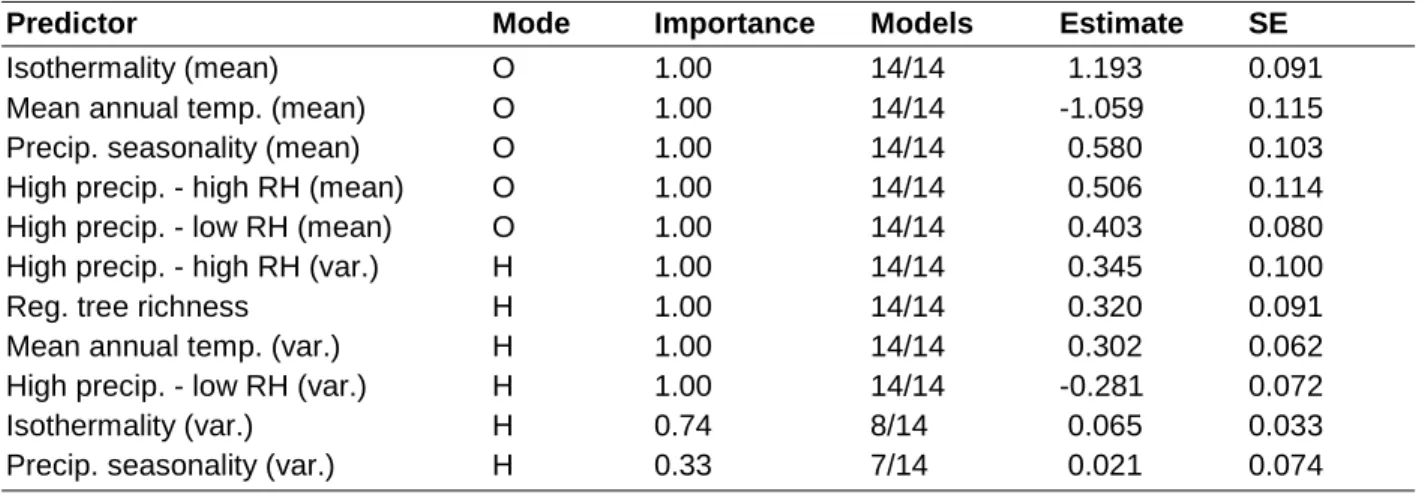
Table 1.4- Importance and effects of regional scale environmental variables on regional macrolichen species richness
Parameter estimates are averaged from the 14 most likely submodels (evidence ratio ≥ 0.05) of a
full model containing all regional scale variables (model R3). The table follows the same format
as Table 3. Variables are ordered from strongest to weakest effect on local richness. Effects of
variable quadratic terms can be found in Appendix 1, Table A1.6.
Predictor Mode Importance Models Estimate SE
Isothermality (mean) O 1.00 14/14 1.193 0.091
Mean annual temp. (mean) O 1.00 14/14 -1.059 0.115
Precip. seasonality (mean) O 1.00 14/14 0.580 0.103
High precip. - high RH (mean) O 1.00 14/14 0.506 0.114
High precip. - low RH (mean) O 1.00 14/14 0.403 0.080
High precip. - high RH (var.) H 1.00 14/14 0.345 0.100
Reg. tree richness H 1.00 14/14 0.320 0.091
Mean annual temp. (var.) H 1.00 14/14 0.302 0.062
High precip. - low RH (var.) H 1.00 14/14 -0.281 0.072
Isothermality (var.) H 0.74 8/14 0.065 0.033
40
Figure 1.1- Map of lichen species richness in 1,923 forest plots
Plot locations are indicated by circles which are colored by the number of macrolichen species
on a plot (A, local richness) or the number of species with a 500 km radius (B, regional
richness). Light grey pixels are areas with forest cover (USDA Forest Service, 2002). Map
41
Figure 1.2- Proportion of variation in lichen species richness explained by different sets of environmental variables
A) Variation in local macrolichen species richness explained by variables measured at a local or
regional scale. Dark grey indicates variation uniquely explained by local scale variables while
light grey indicates variation uniquely explained by regional scale variables. The intermediate
grey boxes indicate variation which cannot be ascribed to either set of variables alone and the
white boxes show variation unexplained by the full model. The left column partitions richness
variation among all variables (models: L3 = L1 + L2), while in the middle and right columns
variation is partitioned only among variables measuring environmental optimality (models: L6 =
L4 + L5) or heterogeneity (models: L9 = L7 + L8). B) Variation in macrolichen species richness
explained by variables measuring environmental heterogeneity versus optimality. The left
column shows variation in regional species richness explained by regional scale heterogeneity
and optimality variables (models: R3 = R1 + R2) and the right column shows variation in local
43
Figure 1.3- Effects of local and regional climate variables on local macrolichen species richness
Coefficients from the best supported models of local macrolichen species richness containing
optimality variables (full model: L6) were averaged and standardized to obtain standardized
effects of climate variables measured locally and regionally. These effects are plotted here with
the coefficient for each local climate variable on the x-axis and the coefficient for each regional
mean climate variable on the y-axis. Points falling in the grey region indicate climate variables
that have a stronger effect on local richness when measured regionally compared to when
measured locally. Abbreviations are: high precipitation-high RH (WET) and its square (WET2), high precipitation-low RH (LOWRH), precipitation seasonality (PSEAS), isothermality (ISO),
44
CHAPTER 2: SPATIAL VARIANCE IN DIVERSITY AND FUNCTIONAL STRUCTURE OF LICHEN EPIPHYTE ASSEMBLAGES IN DECIDUOUS FORESTS
OF THE SOUTHEASTERN UNITED STATES Introduction
Ecological communities respond to processes that operate at multiple spatial scales.
Predicting when fine-scale factors take precedence over larger-scale processes is an important
goal for both basic and applied ecological research. From the local eradication of an invasive
species to the implementation of reserve networks for conservation, the success of any
intervention requires planning for how external factors will affect actions taken locally (Howeth,
Derry & Reitzel 2010; Economo 2011). More generally, metacommunity frameworks that
highlight the dependence of local outcomes on regional processes have inspired a substantial
amount of research on the relative importance of local and regional processes under different
biological and geographic contexts (Leibold et al. 2004; Logue et al. 2011; Seabloom et al.
2015; Heino et al. 2015). The field of ecology has yet to come up with a general answer, but the
collection of evidence from a variety of systems will facilitate the development of a flexible and
inclusive theory.
Epiphyte communities are a promising system in which to study how larger-scale
processes affect local community assembly because trees create a discrete hierarchical spatial
structure. Individual tree trunks can be viewed as patches, with dispersal among trees linking the
assemblage of epiphytes on a single tree trunk to those of all nearby trees in the surrounding
stand. Scaling up, the assemblage of species in a forest patch is dependent on the regional pool of
45
will be determined not only by interactions between neighboring individuals and the
microenvironmental conditions at the substrate-level, but also by site-scale factors like
microclimate or forest continuity as well as regional biogeographical processes.
In this study, I focus on lichens because they are a dominant and diverse component of
temperate epiphyte communities across a broad range of forested habitats (Ellis 2012). Many
previous studies have assessed the effects of tree-, stand-, landscape-, and regional-scale factors
on lichen communities (Ellis 2012), but rarely have effects of factors at all levels been compared
within a single methodological framework (Giordani 2006; Ellis & Coppins 2006; Aragon,
Martinez & Garcia 2012; Ódor et al. 2013). This is likely because cross-scale studies require the
collection of fine-grain community data replicated across each scale of interest, a task that is
particularly challenging for lichens. Identification of all lichen species in a randomly sampled
quadrat on a tree is difficult and time-consuming. Lichen assemblages circumscribed by a
predefined sampling quadrat often contain individual thalli that lack characters necessary for
resolving species identities using published keys. For those individuals that can be identified,
many will need to be removed from the bark and brought to a lab facility for chemical tests and
microscopic examination of spores and other structures. One potential solution is to adopt a
taxon-free approach in which lichen communities are described in terms of morphology rather
than taxonomy (Rivas Plata, Lücking & Lumbsch 2007; Giordani et al. 2012), so that
time-intensive species identification is avoided and non-specialists can participate in data collection. If lichen’s physical characteristics mediate the processes that structure communities and the spatial
variability of these characteristics is similar to the spatial variation of taxonomic community
46
way to assess processes impacting tree-scale lichen communities across larger regional extents
(Lewis & Ellis 2010).
Here, I measure the response of epiphyte communities to environmental variation across
scales by surveying lichens growing on the trunks of trees in temperate deciduous forests across
an elevational gradient spanning 400km and two climatic regions in the southeastern United
States. My main goal is to determine whether epiphyte assemblages are primarily affected by
processes operating at the substrate- or tree-level, versus processes occurring within forest stands
or across larger regions. Therefore, I take a hierarchical approach (Noda 2004), first partitioning
the variability in communities among successively higher levels of spatial organization (between
trees, patches, forests, and regions) and then determining the extent to which community
variability at each level corresponds to environmental variability (Aragon et al. 2012). I compare
measures of diversity, abundance, and functional composition to determine whether these aspects
of community structure vary in similar ways across scales and whether survey methods based
solely on morphological traits can detect meaningful community variation.
Methods Study location
The study was conducted during the summers of 2012-2014 at nine forested sites across the Piedmont and Blue Ridge Mountains ecoregions of North Carolina (hereafter ‘piedmont’ and
‘mountains’) (US EPA 2010) (Figure 2.1A). Sites ranged in elevation from 106 – 1342 m above
sea level. Dominant tree species included Quercus rubra, Q. alba, Q. montana, Acer rubrum, A.
saccharum, Liriodendron tulipifera, Oxydendron arboreum, and Betula lenta. Site locations and
tree species sampled are in Appendix 2. Climatic conditions at each site closely followed the