181
Analysis of Herding Behavior in Moroccan Stock Market Mustapha El hami, Ahmed Hefnaoui
Research laboratory in economic and logistics performance, Morocco [email protected], [email protected]
Abstract: Frontier markets, particularly the Moroccan financial market, are characterized by a narrowness of
market, inability to absorb erratic price fluctuations and the low liquidity of securities that encourage investors to herd and imitate those who have all the information about the market. A quantitative research approach was used to analyze the existence of herding n Moroccan stock market. The daily data used in this study concerns the period from 04/01/2010 to 29/12/2017 and contains the daily returns of the MASI and a total of 43 traded stocks. Statistical and econometric methods such as multidimensional scaling and Cross-sectional absolute deviation were used. Subsequently, after the regression models were examined, findings indicated that the first stocks with the highest similarity to the index return are BMCE, BCP, IAM, ATW and CMSR, and the first stocks with the highest dissimilarity are PAP, IBC and SNP, This will have to allow investors to choose profitable alternatives and avoid those that present a possible risk. The results did also show the existence of herding in the Moroccan stock market both upward and downward. This finding was supported by the clear existence of a linearity between market performance and CSAD measurement, which confirms the prediction of a
non-linear inversion relationship between CSAD and 𝑅𝑚. This could be due to the low level of transparency that
prevails in frontier stock exchanges and reduces the quality of their information environment, which leads investors not to react rationally and to draw information from the transactions of their peers.
Keywords: Frontier markets, Herd behavior, Behavioral finance, Information, Moroccan index.
1. Introduction
In a few years, the efficient market hypothesis (EMH) has become the keystone of the entire financial theory. This hypothesis manifests in two points. The first point states that the market price is the price that reflects the intrinsic value of the assets, in other words, the "fundamentals". The second point indicates that prices include all available market information and that there is no arbitrage opportunity. The Darwinian idea states that in financial markets, only rational investors should remain (Broihanne & Capelle-Blancard, 2018). However, a large number of researchers have rejected this hypothesis in the markets. Grossman & Stiglitz (1980) have vehemently criticized this assumption of market efficiency since the early 1980s, stressing that, if markets were efficient, no economic agent would have an interest in acquiring (bearing the costs of acquiring) information. The two economists George A Akerlof (Nobel Prize winner) and Robert J. Shiller are well aware that the idea that economic crises, like the financial and real estate crisis, are mainly caused by a change in our perception of the world, goes against traditional economic thinking (Évariste LEFEUVRE, 2011). Thus, an understanding of the investor's behavior seems necessary to explain some of the different factors behind these anomalies. Given the importance of this behavior and its implications for financial markets, the literature has developed rapidly in recent years, partly because of the prolonged crisis in US financial markets, which subsequently spread to global markets.
182
have all the information about the market. Second, investors must understand that this type of market has high growth potential, and low and attractive valuations compared to emerging markets.
In doing so, they will benefit by ensuring a better allocation of assets, combined with risk management and strategic decision-making. The remainder of this document is organized as follows. Section 2 briefly summarizes previous studies on herding in general. Section 3 presents the methodology used in the herd behavior test. Section 4 presents an analysis of the data. Finally, section 5 proposes to give our conclusions.
2. Literature Review
A body of work carried out over time contributes to enriching the literature on herd behavior. Regarding this, we give a brief overview of mimicry in the financial markets. According to Hott (2009) if one player's decisions are positively influenced by the decisions of other players, this is called herd behavior. Christie & Huang (1995) defines herding as a tendency of people to follow the performance of the global market, imitate the actions of others and ignore their own point of view. It could also be defined as a correlation in investor behavior. According to Avery & Zemsky (1996), mimicry is defined as that of an agent negotiating against its initial assessment and instead of following the trend of previous exchanges. There are two types of herd behavior, "spurious" herding and intentional herding. When investors react with the same well-known public information and make the same investment decisions, it can be considered spurious herding (Park & Kim, 2017). While, if investors intend to follow the behavior of others, this can be considered intentional herd behavior and the latter will be the subject of our study. In addition, there are several reasons behind intentional herd behavior.
First, according to Bikhchandani et al. (1992) there is the information cascade, which means that a slight preponderance of public information is sufficient to get people to follow the market leader and neglect their own knowledge. A second reason is the lack of information or the inferior quality of information, which can lead to mimicry based on compensation and reputation (Ren & Wu, 2018). According to Li, Wang, and Rhee (2015), there are differences between institutional and retail investors in herd behavior. Li et al. (2015), according to a measure based on trading volume, found that well-informed institutional investors trade selectively while individual investors are less informed and distribute their investment evenly across assets, as well as individual investors rely more on public information and are influenced by market sentiment and attention-grabbing events. Institutional investors react asymmetrically to market movements up and down, while individual investors do not. Bailey and Ng (2010), using thousands of brokerage accounts of US retail investors, show that behavioral factors influence individual investors' decisions to hold individual stocks rather than mutual funds, including passive index funds.
Nevertheless, Deng et al. (2018) note that the herding of mutual funds deteriorates the quality of the company's information communication. Companies with a high mutual fund herding effect have less private information, less profit transparency, a higher probability of accounting errors and less accounting conservatism. The authors also find that there is a strong predictive relationship between mutual fund herd behavior and stock market crashes. In this regard, there is a wide range of studies analyzing the presence of herding in different markets and its potential impact on asset prices, which do not always come to the same conclusions. Yousaf, Ali and Shah (2018), using the Christie and Huang regression model (1995) and the Chang et al. (2000) model, examine herd behavior on the Pakistani stock exchange under different market conditions, focusing on the Ramadan effect and periods of crisis. They argue that there is no herd effect on the Karachi stock exchange. In addition, they argue that mimicry does not exist during the bull and bear market as well as during high or low volatility in the market. It is detected only during the low trading volume in Pakistan and is not influenced by the month of Ramadan.
183
Vietnamese stock market from a sample of 299 companies listed on the Ho Chi Minh City Stock Exchange covering the period 2005- 2015. The study uses the herding measures proposed by Christie and Huang (1995) and Chang, Cheng and Khorona (2000) on a daily, weekly and monthly frequency, therefore, indicates the existence of herding over the entire period studied. Gong and Dai (2017) indicate that rising interest rates and the depreciation of the Chinese currency (CNY) will lead to the formation of mimicry and this phenomenon occurs mainly in bear markets.
The authors Theriou, Mlekanis and Maditinos (2011) used the methodology based on the Lakonishok, Shleifer and Vishny (1992) model to investigate the behavior of managers of mutual funds investing on the Athens stock exchange during the period 2001 - 2006. The study indicated the existence of herd behavior when mutual fund managers trade large-cap stocks or stocks in the most "famous" indexes. Data on herd behavior in frontier markets have generated considerable research interest. Economou (2016) examines herding in two African border markets - Nigeria and Morocco - that have not been analyzed previously, using daily data for the period 2004-2014. The empirical results obtained using the reference model of Chang et al. (2000), do not indicate the presence of herding. However, when he tested asymmetries in mimicry estimates, he identified herd behaviors during days of bear market volatility for Nigeria.
Moreover, there is evidence of mimicry during the global financial crisis only in Morocco. Structural failure tests reveal significant evidence of herding in Morocco for the sub-period from December 2005 to December 2014, with herding being more pronounced on days of high market and volume volatility. According to Guney, Kallinterakis and Komba (2017), Elhami and Hefnaoui (2018) herding is present on African frontier markets, this is attributed to the low levels of transparency that prevail in border exchanges and that reduce the quality of their information environment, as well as it leads investors to consider herding as a feasible option, allowing them to deduce information from their peers' transactions. Similarly, the increased informational uncertainty surrounding small stocks is pushing investors to trade them more under the influence of herding. Balcilar, Demirer and Hammoudeh (2012), when studying the Gulf countries find evidence of herd behavior under the crash regime for all markets except Qatar, where herd effects are subject to low and high volatility regimes.
3. Methodology
This study first focuses on multidimensional scaling analysis developed by F.Cox and A.A.Cox (2000) as a technique developed to measure and predict human judgment. Multidimensional scaling (MDS) is a mathematical technique that allows us to map the distances between points in a high dimensional space in lower dimensional space. This is more useful when we can draw a map in a two-dimensional space because it will help us to visually confirm the different groups of classes (clusters). The result of an MDS analysis is the transformation of data into similarity measures that can be represented by Euclidean distances in the space of unknown dimensions (Borg and Groenen, 2005). In the MDS method, a small distance between two points corresponds to a high correlation between two actions and a large distance corresponds to a low or even negative correlation (Nirenberg and Latham, 2003). MDS can be considered as an exploratory technique without any assumption of data distribution. The distances between points on MDS maps are generally not difficult to interpret and can, therefore, be used to formulate more specific models or assumptions.
In addition, the distance between two points must be interpreted as the conditional distance at all other distances. Secondly, on the analysis of the relationship between the variables Cross-Sectional Absolute deviation CSAD of equity return rates from the market return rate in period t, the equity return rate i in period
t 𝑅𝑖,𝑡and the market portfolio return in period t 𝑅𝑚,𝑡. The daily data used in this study, which contains the daily
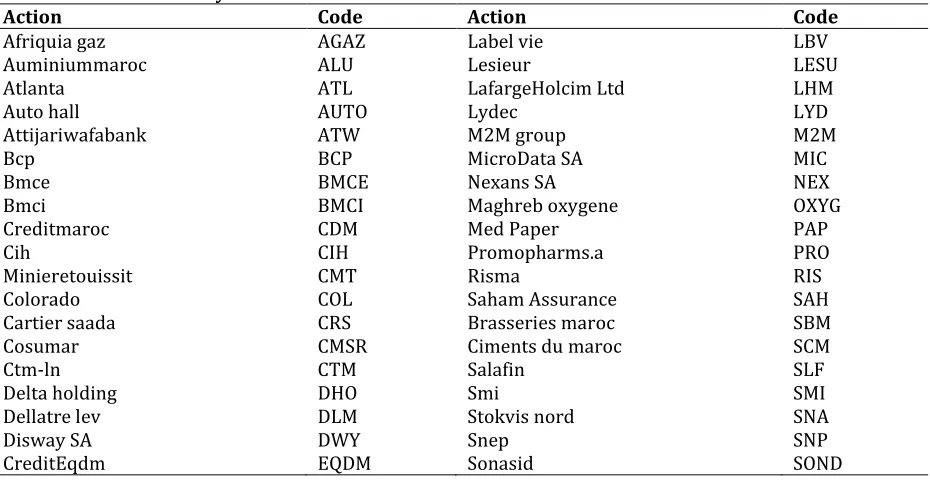
returns of the MASI (Moroccan all shares index) and a total of 43 traded shares shown in Table 1, cover the period from 04/01/2010 to 29/12/2017. The data set was obtained from the global financial portal and
Internet brand1. In our study, daily return data calculated on the basis of the closing prices of each share and
184
the index were analyzed using the regression method. Some shares were not included in the analysis because data on them were not available for the period studied. We applied the logarithmic yield determined as follows
Where , is the stock price.
This study used a CSAD model of stock returns developed by Chang, Cheng and Khorana (2000), which is a
non-linear and growing function of market returns. In formula (1), the CSAD𝑡 variable represents the cross-sectional
absolute deviation of stock return rates from the market return rate in period t, the 𝑅𝑖,𝑡 variable represents the
stock return rate i in period t, the 𝑅𝑚,𝑡 variable represents the market portfolio return in period t and the N
variable represents the number of stocks.
To take into account the possibility that the degree of herding may be asymmetric at the top compared to the bottom of the range, we use the following empirical specification. Two models will be used to measure herd behavior in bullish (upwards) and bearish (downwards) markets, respectively, and will be presented as follows.
If
If
If, during periods of relatively large price fluctuations, market participants gather around indicators such as the average consensus of all market components, this would result in a non-linear relationship between the
CSAD𝑡 and the average market return. Non-linearity would be captured by a negative and statistically
significant 𝛾2 coefficient.
Table 1: The Stocks Analyzed
Action Code Action Code
Afriquia gaz AGAZ Label vie LBV
Auminiummaroc ALU Lesieur LESU
Atlanta ATL LafargeHolcim Ltd LHM
Auto hall AUTO Lydec LYD
Attijariwafabank ATW M2M group M2M
Bcp BCP MicroData SA MIC
Bmce BMCE Nexans SA NEX
Bmci BMCI Maghreb oxygene OXYG
Creditmaroc CDM Med Paper PAP
Cih CIH Promopharms.a PRO
Minieretouissit CMT Risma RIS
Colorado COL Saham Assurance SAH
Cartier saada CRS Brasseries maroc SBM
Cosumar CMSR Ciments du maroc SCM
Ctm-ln CTM Salafin SLF
Delta holding DHO Smi SMI
Dellatre lev DLM Stokvis nord SNA
Disway SA DWY Snep SNP
CreditEqdm EQDM Sonasid SOND
1
ln
tt
t
P
R
P
P
tP
t1, ,
1
N
i t m t
i t
R
R
CSAD
N
2
1 , 2
(
,)
UP UP UP UP UP
t m t m t t
CSAD
R
R
,
0
m t
R
2
1 , 2
(
,)
DOWN DOWN DOWN DOWN DOWN
t m t m t t
CSAD
R
R
,
0
m t
R
185
Maroc telecom IAM Timar TIM
IB Maroc Com SA IBC Wafa assurance WASS
Jet Contractors JET Moroccan All Shares MASI
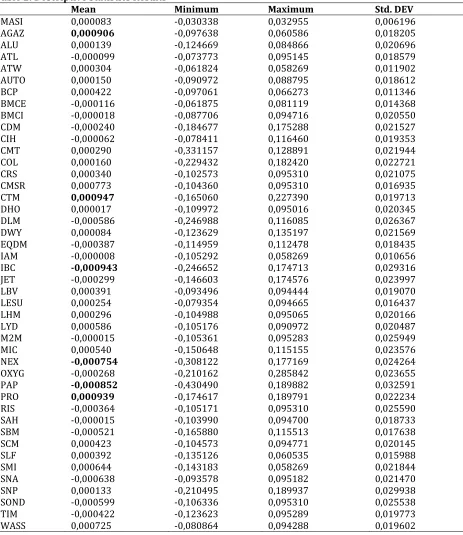
4. Empirical Results Descriptive Statistics
Table 2: Descriptive Statistics Results
Mean Minimum Maximum Std. DEV
MASI 0,000083 -0,030338 0,032955 0,006196
AGAZ 0,000906 -0,097638 0,060586 0,018205
ALU 0,000139 -0,124669 0,084866 0,020696
ATL -0,000099 -0,073773 0,095145 0,018579
ATW 0,000304 -0,061824 0,058269 0,011902
AUTO 0,000150 -0,090972 0,088795 0,018612
BCP 0,000422 -0,097061 0,066273 0,011346
BMCE -0,000116 -0,061875 0,081119 0,014368
BMCI -0,000018 -0,087706 0,094716 0,020550
CDM -0,000240 -0,184677 0,175288 0,021527
CIH -0,000062 -0,078411 0,116460 0,019353
CMT 0,000290 -0,331157 0,128891 0,021944
COL 0,000160 -0,229432 0,182420 0,022721
CRS 0,000340 -0,102573 0,095310 0,021075
CMSR 0,000773 -0,104360 0,095310 0,016935
CTM 0,000947 -0,165060 0,227390 0,019713
DHO 0,000017 -0,109972 0,095016 0,020345
DLM -0,000586 -0,246988 0,116085 0,026367
DWY 0,000084 -0,123629 0,135197 0,021569
EQDM -0,000387 -0,114959 0,112478 0,018435
IAM -0,000008 -0,105292 0,058269 0,010656
IBC -0,000943 -0,246652 0,174713 0,029316
JET -0,000299 -0,146603 0,174576 0,023997
LBV 0,000391 -0,093496 0,094444 0,019070
LESU 0,000254 -0,079354 0,094665 0,016437
LHM 0,000296 -0,104988 0,095065 0,020166
LYD 0,000586 -0,105176 0,090972 0,020487
M2M -0,000015 -0,105361 0,095283 0,025949
MIC 0,000540 -0,150648 0,115155 0,023576
NEX -0,000754 -0,308122 0,177169 0,024264
OXYG -0,000268 -0,210162 0,285842 0,023655
PAP -0,000852 -0,430490 0,189882 0,032591
PRO 0,000939 -0,174617 0,189791 0,022234
RIS -0,000364 -0,105171 0,095310 0,025590
SAH -0,000015 -0,103990 0,094700 0,018733
SBM -0,000521 -0,165880 0,115513 0,017638
SCM 0,000423 -0,104573 0,094771 0,020145
SLF 0,000392 -0,135126 0,060535 0,015988
SMI 0,000644 -0,143183 0,058269 0,021844
SNA -0,000638 -0,093578 0,095182 0,021470
SNP 0,000133 -0,210495 0,189937 0,029938
SOND -0,000599 -0,106336 0,095310 0,025538
TIM -0,000422 -0,123623 0,095289 0,019773
186
The descriptive statistics table shows, for the period from 04.01.2010 to 29.12.2017, the average of the daily returns of the shares and the MASI main index, their minimum and maximum values and the corresponding standard deviations. The average return of the MASI index is 0.0083%. During the period studied, the highest daily return of the MASI index was 3.3% on 23.12.2016 and its lowest daily return was -3% on 21.03.2011. Several factors have come together to drive the market towards this considerable decline, including the effect of the "Arab Spring", the departure of non-strategic foreign investors, the disaffection of local investors, investor arbitrage in favor of other safe investment instruments (bond UCITS, term deposits etc.). Among all stocks, the top three securities generating the highest average daily returns were CTM (0.0947%), PRO (0.0939%) and AGAZ (0.0906%) respectively, while the lowest average daily returns were recorded for IBC (-0.00943%), PAP (-0.0852%), and NEX (-0.0754%).
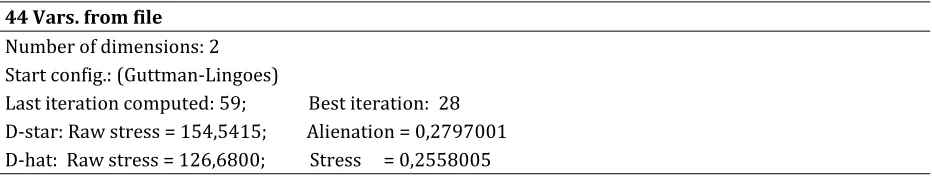
Multidimensional Scaling Analysis: The multidimensional scaling technique has been implemented in the
STATISTICA software. In our study, we used the MDS to allow us to analyze the correlation matrix between each of the two stocks forming a pair (i,j). Stress values are used to indicate model quality and adjustment data. According to Kruskal's model recommendation, stress of 20% or more is considered a bad model, 10% is considered reasonable, 5% is a good model and 2.5% is excellent (Hair et al., 2009). As the value of stress approaches zero, a better quality of adjustment would be achieved. The results of the MDS analysis in Table 3 reveal the following: For k-dimension = 2, the iteration was repeated until the value was 0.2558005 in the 28th iteration. The solution obtained was considered appropriate since the stress value is close to 0, which means that the relationship between the experience data and the distances in the configuration is a monotonous relationship.
Table 3: Stress Value 44 Vars. from file
Number of dimensions: 2 Start config.: (Guttman-Lingoes)
Last iteration computed: 59; Best iteration: 28 D-star: Raw stress = 154,5415; Alienation = 0,2797001 D-hat: Raw stress = 126,6800; Stress = 0,2558005
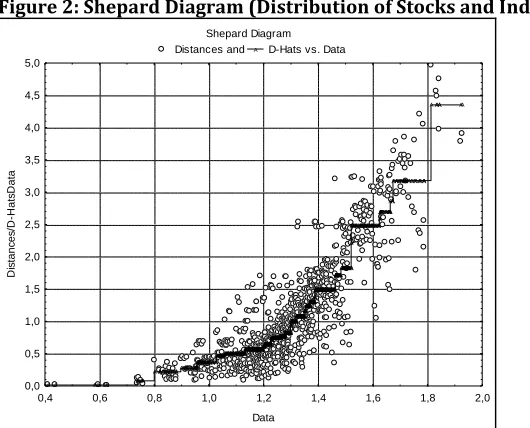
The empirical study reveals the first stocks closest and most distant to the index (MASI) return in accordance with variables' values (Euclidean distances) in figure 1. The first stocks with the highest similarity (proximity) to the index return are BMCE, BCP, IAM, ATW and CMSR, while the first stocks with the highest dissimilarity (distance) are PAP, IBC and SNP. Based on the positioning of the stocks in the MDS map, it appears that the returns or losses generated by the stocks that are similar to the performance of the Index will be approximately the same as those of the Index, while dissimilar stocks may produce returns or losses that are different from the Index. In addition, it could be argued that similar stocks could be included as alternatives to each of them in the portfolio construction process, while those that are dissimilar cannot be used as alternatives to each other. A review of the Shepard diagram in Figure 2 suggests that the distances between stocks and the index are linearly related, it identifies a strong correlation between observed distances and disparities (i.e. between initial distances and calculated distances), and thus a good quality of fit.
Regression Analysis: Tables present the regression results for Model 1 (upmarket) and Model 2 (down
market), between the CSAD cross-sectional absolute deviation and the index returns. Model 1 shows that the
parameter γ1 (up) equal to 0.791 is statistically significant and positive at the 5% level, this result is explained
187
Figure 1: MDS Map
Scatterplot 2D
Final Configuration, dim ension 1 vs. dim ension 2
MASI AGAZ
ALU AT L AT W AUT OBMCEBCP
BMCI
CDM CIH CMT
COL
CRS CMSR
CMT DHO
DLM
DWY EQDM
IAM
IBC JET
LBV LESU LHM
LYD M2M
MIC
NEX OXYG
PAP PRO
RIS
SAHSBM SCM SLF
SMI SNA SNP
SOND
T IM WASS
-2 -1 0 1 2 3 4
Dimension 1 -3
-2 -1 0 1 2 3
D
im
e
n
s
io
n
2
MASI AGAZ
ALU AT L AT W AUT OBMCEBCP
BMCI
CDM CIH CMT
COL
CRS CMSR
CMT DHO
DLM
DWY EQDM
IAM
IBC JET
LBV LESU LHM
LYD M2M
MIC
NEX OXYG
PAP PRO
RIS
SAHSBM SCM SLF
SMI SNA SNP
SOND
T IM WASS
In addition, model 1 show that the second parameter 𝛾2 (up) equal to -6.29664 is statistically significant and
negative at the 5% level this result could confirm the presence of herd behavior in the rising market. The result obtained indicates a non-linear and negative relationship between the cross sectional absolute deviation and
the index returns. Since the non-linear term is significantly negative, the 𝐶𝑆𝐴𝐷𝑡 increased at a decreasing rate
or decreased as the average price movement increases. Therefore, in the case of extreme values in index returns, the cross sectional absolute deviation decreases and the herd behavior is observed during these stressful days. These results confirm the presence of a non-linear relationship and therefore support the argument that herd behavior is a valid phenomenon in the Moroccan financial market.
Figure 2: Shepard Diagram (Distribution of Stocks and Index)
Shepard Diagram
Distances and A D-Hats vs. Data
A A A AA AA AAAAAA A AAAAAAAAAAAAAAAAAAAAAAAAAAAAAAAAAAAAAAAAAA
AAAAAAAAAAAAAAAAAAAAAAAAAAAAAAAAAAAAAAAAAAAAA AAAAAAAAAAAAAAAAAAAAAAAAAAAAAAAAAAAAAAAAAAAAAAAAAAAAAAAAAAAAAAAAAAAAAAAAAAAAAAAAAAAAAAAAAAAAAAAAAAAAAAAAAAAAAAAAAAAAAAAAAAAAAAAAAAAAAAAAAAAAAAAAAAAAAAAAAAAAAAAAAAAAAAAAAAAAAAAAAAAAAAAAAAAAAAAAAAAAAAAAA
AAAAAAAAAAAAAAAAAAAAAAAAAAAAAAAAAAAAAAAAAAAAAAAAAAAAAAAAAAAAAAAAAA A A A A AAAAAAAAAAAAAAAAAAAAAAAAAAAAAAAAAAAAAAAAAAAAAAAAAAAAAAAAAAAAAAAAAAAAAAAAAAAAAAAAAAAAAAAAAAAAAAAAAAAAAAAAAAAAAAAAAAAAAAAAAAAAAAAAAAAAAAA
A A A AAAAAAAAAAAAAAAAAAAAAAAAAAAAAAAAAAAAAAAAAAAAAAAAAAAAAAAAAAAAAAAAAAAAAAAAAAAAAAAAAAAAAAA
A A A A A A AAAAAAAAAAAAAAAAAAAAAAAAAAAAA
A A A A A A A A A A A AAAAAAAAAAAAAAAAAAAA
A A A A A A A A A A A A AAAAAAAAAAAAAAAAAAAAAAAAAAAAAAAAAAAAAAAAAAAAAAAAAAAAAAAAAAAAAAAAAAAAAAAAAAAAAAAAAAAAAAAA
A A A A A A A A AAAAAAAAAAAAAA
AAAAAAAAAAAAAAAAAAAAAAAAAAAAAAAAAA A A AAAAAAAAAAAAAAAAAAAAAAAAAAAAAAAAAAAAAAAAAAAAAAAAAAAAAAAAAAA
A A A A AAAAAAAAAAAAAAAAAAAA
AAAAA AAAAAAAAAAAAAAAAAAAAAAAAAAAAAA
A AAAA AA
0,4 0,6 0,8 1,0 1,2 1,4 1,6 1,8 2,0
Data 0,0
0,5 1,0 1,5 2,0 2,5 3,0 3,5 4,0 4,5 5,0
D
is
ta
n
c
es
/D
-H
a
ts
D
a
ta
Model 2 (down market) shows results indicating the presence of herd behavior in the market when it is
declining. The results obtained by the regression analyses indicate that the parameter γ2 (down) is negative
188
Table 4: Market Up Model Model 1
2
1 , 2 ( ,)
UP UP UP UP UP
t m t m t t
CSAD R R
Coefficient Std. Error T-statistic Prob
0,00978 0,000184 53,13630 0,000000
1
0,79085 0,070013 11,29572 0,0000002
-6,29664 5,002516 -1,25869 0,208411
F-statistic 281.6887
R-adjust 0.339739
Table 5: Market Down Model Model 2
2
1 , 2 ( , )
DOWN DOWN DOWN DOWN DOWN
t m t m t t
CSAD R R
Coefficient Std. Error T-statistic Prob
0,00974 0,000202 48,22467 0,000000
1
0,82055 0,072683 11,28953 0,0000002
-6,77106 4,674062 -1,44865 0,147786
F-statistic 280.1419
R-adjust 0.383099
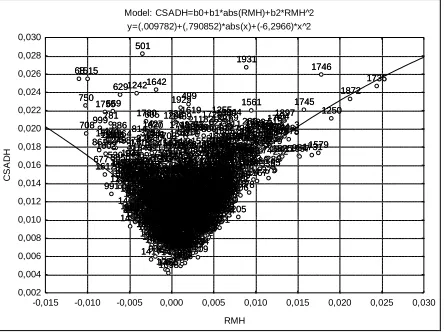
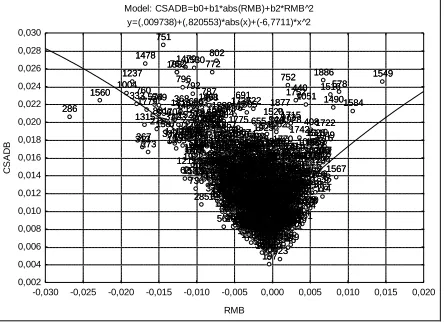
To further illustrate the extent of non-linearity in the CSAD-Market relationship, in Figure 3 below, we plot the CSAD measure for each day and the corresponding equally weighted market performance for Model 1 and Model 2. The layout of the Moroccan financial market gives an insight into the presence of herd behavior in the market, where the non-linearity between market performance and the CSAD measure is evident. It confirms
the prediction of a non-linear inversion relationship between CSAD and 𝑅𝑚, in alignment with Chang et al.
(2000).
Figure 3a: Relationship between Cross-Sectional Absolute Deviation (csad) and Market Return 𝐑𝐦,t in Model 1 Model: CSADH=b0+b1*abs(RMH)+b2*RMH^2 y=(,009782)+(,790852)*abs(x)+(-6,2966)*x^2 3 4 5 6 8 10 11 12 16 17 18 21 22 24 25 26 27 29 31 34 35 38 39 42 43 45 46 48 49 5253 55 56 57 59 60 61 64 65 67 68 70 71 72 73 74 76 78 79 80 81 82 83 84 85 86 89 90 91
92 93 94 95 9697
102 103105109107106
110111 112 113 116 122 123 129 133 135 136 142 143 144 147 148 149 151153 154 155159 158
163 164 165 166 167 172 173 175 177 179 180 181 182 184 186 187 188 189 190 194 195 196 198 199 200 201 203 204 205 207 215 216 217 219 221 223 224 230 231 232 233 234 235 236 237 242 243244 245 246 252
253255 256 257 258 259 260 266 267 268 269 270 271 275 277 278 279 282 283 284 287 288 289 290 295 296 297 303 305 309 315 316 317 322 323 325 326 328 329 330 331 334 335 337 339 340 342 343 345 346349 350 351 352 353 354 355 356 357 358 363 365 371 372 375 376 377 379 380 384 386 389 392 395 397 404 405 406 407 409 410 412 413 416 417 418 419 420 421 422 425 426 430 432 436 438 439 443 445 446 447 448 449 453455 457 460 462 464 465475 477478 479 481 484 485 487 488 491 492 493 494 497 499 501 503 504 507 508 511 512 513 515 516 520 521 522 523 524 525 526 527 530 532 534535 537 539 541 542 543 545 555 558 560 563 564 570 571 575 576 577 581 585 588 589 590594599
601 602 603 604 605 606 607 612 613 615 617 619 620 621 626 627 629 632 639 640 641 646 647 649 650 651 654 656 657 661 664 665666 667 668 669 670 671 675 677 678 679 682 685 687 688 690 692693 703 705 706 707 708 711 713 714 715 720 721 722 725 726 728 729 731 733 734 735 738 742 744 745 747 750 753 754 757 758 763 764 765 766 768 769 771 773 774 778 781 783 785 786 788 790 791 793 794 795 799 800 803 804 806 807 808 809 810 811 812 813 814 816 817 818 819 820 821 822 823 825 827 828830 831 832 835 836 837 838 839 840 842 844 847 854 856 858 861 864 867 868 869 870 873 874 878 879 883 884 885 886 887 889 891 894 895 896 898 900 902 906 908 911 916 917 919 920 921 924 926 927 931 933 934935 936 939 940 941 942 943 947 948949 950 951 952953 954 964 965 967 971 973 974 976 977 978 979 982 983 984 986 989 991 992 995 998 999 1000 100110031005 1006
1007 1009
1011
101310151016
1018 1022 10231025 1027 1029 1030 1031 10321035
1036 1037 1038 1039 1040 1041 1042 1043 1044 1046 1048 1050 1054 1055 1056 1059 1061 1063 1064 1065 1067 1070 1072 1073 1075 1076 1080 1081 1082 1086 10871088 1092 1094 1096 1098 1099 1100 1101 1107 1109 1110 1114 1119 1120 1121 11231125 1127 1130 1131 1132 1134 1136 1137 1138 1139 1140 1142 11441145 1146 1147 1149 1151 1152 1154 1155 1157 1158 1159 1161 1162 1163 1164 1165 1166 1167 1168 1172 1173 1174 1175 1176 1179 1180 1181 1182 1183 1185 1190 1191 1192 1194 1196 1197 1198 1199 1201 12021203 1205 1210 1213 1214 1216 1217 1219 1223 1225 1232 1234 1236 1238 1240 1241 1242 1244 12461247 1248 1249 1250 1251 1252 1253 1254 1255 1256 1257 1263 1265 1268 1269 1270 1272 1273 1276 1279 1280 12811282 1283 1285 1286 1288 1289 1291 1295 1297 1300 1301 1302 1305 1306 1311 1314 13161317 1318 1321 1323 1324 13261328 1330 1334 1335 1336 1338 1339 1340 1341 1345 1348 1349 1352 1353 1354 1357 1358 1359 1363 1364 1366 1368 1371 1373 1374 1376 1377 1379 1380 1382 1383 1384 1387 1388 1389 1390 1391 1392 1393 1394 1400 1403 1404 1408 1410 1412 1413 1414 1416 1417 1418 1420 1422 1425 1426 1427 1432 1437 1438 14401442 1443 1446 1447 1449 14501451 1452 1453 1454 1455 1456 1458 1460 1463 1464 1466 1467 1473 1474 1480 1482 1484 1485 1486 1487 1489 1491 1494 1495 1498 1499 1500 1501 1502 1505 1506 1507 1508 1509 1511 1512 1513 1514 1515 1518 1519 1521 15221524 1525 1532 1533 1534 1536 1537 1538 1539 1540 15411542 1543 1545 1546 1547 1548 1556 1557 1558 1561 1562 1563 1564 1565156615701571 1572 1573 1574 1575 1577 1578 1579 1580 1581 1582 1583 1588 1589 1594 1595 1596 15971598 1599 1600 1602 1605 1608 1610 1612 1614 1615 1617 1619 1620 1621 1622 16241625 1626 1627 1629 1631 1632 1633 1634 1635 1639 1640 1642 1643 1646 1648 1650 1652 1655 1656 1657 1661 1662 1664 1665 16661667 1669 1670 1672 1674 1675 1676 1677 1679 1680 1681 1682 1683 1684 1685 1686 1689 1690 1691 1693 1694 1696 1698 1699 1700 1702 1705 1706 1707 1710 1711 1712 1713 1717 1718 1719 1723 1724 1725 1726 1727 1728 1729 1730 1731 1732 1735 1736 1741 1743 1744 1745 1746 1747 1748 1753 1754 1755 1758 1760 17651766 1768 1771 1773 1774 1776 1777 1780 1781 1782 1784 1786 1789 1790 1791 17921793 1796 1801 1802 1803 1807 1808 1810 1812 1813 1816 1817 1818 1819 1820 1821 1823 1824 1825 1826 18301832 1833 1834 1835 1837 1838 18441846 1847 1849 1850 1852 1853 1856 1857 1859 1860 1861 1862 1863 1864 1865 1866 1868 1869 1870 1871 1872 1874 1875 1883 1884 1885 1887 1889 1892 1893 1894 1896 1897 1899 1901 1903 1905 1906 1907 1908 1909 1911 1913 1914 1915 1917 1923 1924 1929 1930 1931 1934 1935 1936 1937 1938 1941 1944 1945 1947 1948 19501951 1953 1956 1957 1958 1962 1966 1967 1968 1969 1970 1975 1976 1978 1980 1987 1988 1989 19901991
-0,015 -0,010 -0,005 0,000 0,005 0,010 0,015 0,020 0,025 0,030
RMH 0,002 0,004 0,006 0,008 0,010 0,012 0,014 0,016 0,018 0,020 0,022 0,024 0,026 0,028 0,030 C S A D H 3 4 5 6 8 10 11 12 16 17 18 21 22 24 25 26 27 29 31 34 35 38 39 42 43 45 46 48 49 5253 55 56 57 59 60 61 64 65 67 68 70 71 72 73 74 76 78 79 80 81 82 83 84 85 86 89 90 91
92 93 94 95 9697
102 103105109107106
110111 112 113 116 122 123 129 133 135 136 142 143 144 147 148 149 151153 154 155159 158
163 164 165 166 167 172 173 175 177 179 180 181 182 184 186 187 188 189 190 194 195 196 198 199 200 201 203 204 205 207 215 216 217 219 221 223 224 230 231 232 233 234 235 236 237 242 243244 245 246 252
253255 256 257 258 259 260 266 267 268 269 270 271 275 277 278 279 282 283 284 287 288 289 290 295 296 297 303 305 309 315 316 317 322 323 325 326 328 329 330 331 334 335 337 339 340 342 343 345 346349 350 351 352 353 354 355 356 357 358 363 365 371 372 375 376 377 379 380 384 386 389 392 395 397 404 405 406 407 409 410 412 413 416 417 418 419 420 421 422 425 426 430 432 436 438 439 443 445 446 447 448 449 453455 457 460 462 464 465475 477478 479 481 484 485 487 488 491 492 493 494 497 499 501 503 504 507 508 511 512 513 515 516 520 521 522 523 524 525 526 527 530 532 534535 537 539 541 542 543 545 555 558 560 563 564 570 571 575 576 577 581 585 588 589 590594599
601 602 603 604 605 606 607 612 613 615 617 619 620 621 626 627 629 632 639 640 641 646 647 649 650 651 654 656 657 661 664 665666 667 668 669 670 671 675 677 678 679 682 685 687 688 690 692693 703 705 706 707 708 711 713 714 715 720 721 722 725 726 728 729 731 733 734 735 738 742 744 745 747 750 753 754 757 758 763 764 765 766 768 769 771 773 774 778 781 783 785 786 788 790 791 793 794 795 799 800 803 804 806 807 808 809 810 811 812 813 814 816 817 818 819 820 821 822 823 825 827 828830 831 832 835 836 837 838 839 840 842 844 847 854 856 858 861 864 867 868 869 870 873 874 878 879 883 884 885 886 887 889 891 894 895 896 898 900 902 906 908 911 916 917 919 920 921 924 926 927 931 933 934935 936 939 940 941 942 943 947 948949 950 951 952953 954 964 965 967 971 973 974 976 977 978 979 982 983 984 986 989 991 992 995 998 999 1000 100110031005 1006
1007 1009
1011
101310151016
1018 1022 10231025 1027 1029 1030 1031 10321035
189
Figure 3-b: Relationship between Cross-Sectional Absolute Deviation (CSAD) and Market Return 𝐑𝐦,t in Model 2
Model: CSADB=b0+b1*abs(RMB)+b2*RMB^2 y=(,009738)+(,820553)*abs(x)+(-6,7711)*x^2 1 2 7 9 13 14 15 19 20 23 28 30 32 33 36 37 40 41 44 4750 51 54 58 62 63 66 69 75 77 87 88 98 99 100 101 104 108 114 115 117 118 119 120 121 124 125126 127 128 130 131 132 134 137 138 139 140 141 145 146 150 152 156 157 160 161 162 168 169 170 171 174176178
180 183 185 191 192 193 197 202 206 208 209 210212 211
213 214 218 220 222 225 226227 228 229238 239 240 241 247 248 249250 251 254 261 262 263264265 272 273 274276 280 281 285 286 291 292 293 294 298 299 300301 302 304 306 307 308 310 311 312 313 314 318 319 320 321 324 327 332 333 336 338 341 344 347 348 359 360 361 362 364 366 367 368 369 370 373 374 378 381 382 383 385 387 388 390 391 393 394 396 398 399 400 401 402 403 408 411 414 415 423 424 427 428 429 431 433 434 435 437 440 441 442 444 450 451 452 454 456 458 459 461 463 466 467 468 469 470 471 472 473 474 476 480 482 483 486 489 490 495 496 498 500 502 505 506 509 510 514 517518 519 528 529 531 533 536538 540 544 546 547 548 549 550 551 552 553 554 556 557 559 561 562 565 566 567 568 569 572 573 574 578 579 580 582 583 584 586 587591 592 593 595 596 597 598 600 608 609 610 611 614 616 618 622 623 624 625 628 630631 633 634 635 636 637 638 642 643 644 645 648 652 653 655
658659660 662 663 672 673 674 676 680 681 683 684 686 689 691 694 695 696 697 698 699 700 701 702 704 709 710 712 716 717 718 719 723 724 727 730 732 736 737 739 740 741 743 746 748 749 751 752 755 756 759 760 761 762 767 770 772 775 776 777 779 780 782 784 787 789 792 796 797 798 801 802 805 815 824826 829 833 834 841 843 845 846 848 849 850 851 852 853 855 857 859 860 862 863 865 866 871 872 875 876 877 880 881 882 888 890 892 893 897 899 901 903 904 905 907 909 910 912 913 914 915 918 922 923 925 928 929 930 932 937 938 944 945 946 955 956 957 958 959 960 961 962 963 966969 968
970 972 975 980 981 985 987 988 990 993 994 996 997 1002 1004 1008 1010 1012 1014 1017 1019 1020 1021 1024 1026 1028 1033 1034 1045 1047 1049 1051 10521053 1057 1058 1060 1062 10661068 1069 1071 1074 10771078 1079 1083 1084 1085 1089 1090 1091 10931095 1097 1102 1103 1104 1105 1106 1108 1111 1112 1113 1115 1116 1117 1118 1122 1124 1126 1128 1129 1133 1135 1141 1143 1148 1150 1153 1156 1160 1169 1170 1171 1177 1178 1184 1186 1187 1188 1189 1193 1195 1200 1204 1206 1207 1208 1209 12111212 1215 1218 1220 1221 1222 1224 1226 1227 1228 1229 1230 1231 1233 1235 1237 1239 1243 12451258 1259 1260 1261 1262 1264 1266 1267 1271 1274 1275 1277 1278 1284 1287 1290 1292 1293 1294 1296 1298 1299 1303 1304 1307 1308 1309 1310 1312 1313 1315 1319 1320 1322 13251327 1329 1331 1332 1333 1337 13421343 1344 1346 1347 1350 1351 1355 1356 1360 1361 1362 1365 1367 1369 1370 1372 1375 1378 1381 1385 1386 1395 1396 1397 1398 1399 1401 1402 1405 1406 1407 1409 1411 1415 1419 1421 1423 1424 1428 1429 1430 1431 1433 1434 1435 1436 1439 1441 1444 1445 1448 1457 1459 1461 1462 1465 1468 1469 1470 1471 1472 1475 1476 1477 1478 1479 1481 1483 1488 1490 1492 1493 1496 1497 1503 1504 1510 1516 1517 1520 1523 1526 1527 1528 1529 1530 1531 1535 1544 1549 1550 1551 1552 1553 1554 1555 1559 1560 1567 1568 1569 1576 1584 1585 1586 1587 1590 1591 1592 1593 1601 1603 1604 1606 1607 1609 1611 1613 1616 1618
16231630 16281636 1637 1638 1641 1644 1645 1647 1649 1651 1653 1654 1658 1659 1660 1663 1668 1671 1673 1678 1687 1688 1692 1695 1701170417031697
1708 1709 1714 1715 1716 1720 1721 1722 1733 1734 1737
173817401739 1742 1749 1750 1751 1752 1756 1757 1759 1761 1762 1763 1764 1767 1769 1770 1772 1775 1778 1779 1783 1785 1787 1788 1794 1795 1797 1798 1799 1800 1804 1805 1806 18091811 1814 1815 1822 1827 1828 1829 1831 1836 1839 1840 1841 1842 1843 1845 1848 1851 1854 1855 1858 1867 1873 1876 1877 1878 1879 1880 1881 1882 1886 1888 1890 1891 1895 1898 1900 1902 1904 1910 1912 1916 1918 1919 1920 1921 1922 1925 1926 1927 1928 1932 1933 1939 1940 1942 1943 1946 1949 19521954 1955 1959 1960 1961 1963 1964 1965 1971 1972 1973 1974 1977 1979 1981 1982 1983 1984 1985 1986
-0,030 -0,025 -0,020 -0,015 -0,010 -0,005 0,000 0,005 0,010 0,015 0,020 RMB 0,002 0,004 0,006 0,008 0,010 0,012 0,014 0,016 0,018 0,020 0,022 0,024 0,026 0,028 0,030 C S A D B 1 2 7 9 13 14 15 19 20 23 28 30 32 33 36 37 40 41 44 4750 51 54 58 62 63 66 69 75 77 87 88 98 99 100 101 104 108 114 115 117 118 119 120 121 124 125126 127 128 130 131 132 134 137 138 139 140 141 145 146 150 152 156 157 160 161 162 168 169 170 171 174176178
180 183 185 191 192 193 197 202 206 208 209 210212 211
213 214 218 220 222 225 226227 228 229238 239 240 241 247 248 249250 251 254 261 262 263264265 272 273 274276 280 281 285 286 291 292 293 294 298 299 300301 302 304 306 307 308 310 311 312 313 314 318 319 320 321 324 327 332 333 336 338 341 344 347 348 359 360 361 362 364 366 367 368 369 370 373 374 378 381 382 383 385 387 388 390 391 393 394 396 398 399 400 401 402 403 408 411 414 415 423 424 427 428 429 431 433 434 435 437 440 441 442 444 450 451 452 454 456 458 459 461 463 466 467 468 469 470 471 472 473 474 476 480 482 483 486 489 490 495 496 498 500 502 505 506 509 510 514 517518 519 528 529 531 533 536538 540 544 546 547 548 549 550 551 552 553 554 556 557 559 561 562 565 566 567 568 569 572 573 574 578 579 580 582 583 584 586 587591 592 593 595 596 597 598 600 608 609 610 611 614 616 618 622 623 624 625 628 630631 633 634 635 636 637 638 642 643 644 645 648 652 653 655
658659660 662 663 672 673 674 676 680 681 683 684 686 689 691 694 695 696 697 698 699 700 701 702 704 709 710 712 716 717 718 719 723 724 727 730 732 736 737 739 740 741 743 746 748 749 751 752 755 756 759 760 761 762 767 770 772 775 776 777 779 780 782 784 787 789 792 796 797 798 801 802 805 815 824826 829 833 834 841 843 845 846 848 849 850 851 852 853 855 857 859 860 862 863 865 866 871 872 875 876 877 880 881 882 888 890 892 893 897 899 901 903 904 905 907 909 910 912 913 914 915 918 922 923 925 928 929 930 932 937 938 944 945 946 955 956 957 958 959 960 961 962 963 966969 968
970 972 975 980 981 985 987 988 990 993 994 996 997 1002 1004 1008 1010 1012 1014 1017 1019 1020 1021 1024 1026 1028 1033 1034 1045 1047 1049 1051 10521053 1057 1058 1060 1062 10661068 1069 1071 1074 10771078 1079 1083 1084 1085 1089 1090 1091 10931095 1097 1102 1103 1104 1105 1106 1108 1111 1112 1113 1115 1116 1117 1118 1122 1124 1126 1128 1129 1133 1135 1141 1143 1148 1150 1153 1156 1160 1169 1170 1171 1177 1178 1184 1186 1187 1188 1189 1193 1195 1200 1204 1206 1207 1208 1209 12111212 1215 1218 1220 1221 1222 1224 1226 1227 1228 1229 1230 1231 1233 1235 1237 1239 1243 12451258 1259 1260 1261 1262 1264 1266 1267 1271 1274 1275 1277 1278 1284 1287 1290 1292 1293 1294 1296 1298 1299 1303 1304 1307 1308 1309 1310 1312 1313 1315 1319 1320 1322 13251327 1329 1331 1332 1333 1337 13421343 1344 1346 1347 1350 1351 1355 1356 1360 1361 1362 1365 1367 1369 1370 1372 1375 1378 1381 1385 1386 1395 1396 1397 1398 1399 1401 1402 1405 1406 1407 1409 1411 1415 1419 1421 1423 1424 1428 1429 1430 1431 1433 1434 1435 1436 1439 1441 1444 1445 1448 1457 1459 1461 1462 1465 1468 1469 1470 1471 1472 1475 1476 1477 1478 1479 1481 1483 1488 1490 1492 1493 1496 1497 1503 1504 1510 1516 1517 1520 1523 1526 1527 1528 1529 1530 1531 1535 1544 1549 1550 1551 1552 1553 1554 1555 1559 1560 1567 1568 1569 1576 1584 1585 1586 1587 1590 1591 1592 1593 1601 1603 1604 1606 1607 1609 1611 1613 1616 1618
16231630 16281636 1637 1638 1641 1644 1645 1647 1649 1651 1653 1654 1658 1659 1660 1663 1668 1671 1673 1678 1687 1688 1692 1695 1701170417031697
1708 1709 1714 1715 1716 1720 1721 1722 1733 1734 1737
173817401739 1742 1749 1750 1751 1752 1756 1757 1759 1761 1762 1763 1764 1767 1769 1770 1772 1775 1778 1779 1783 1785 1787 1788 1794 1795 1797 1798 1799 1800 1804 1805 1806 18091811 1814 1815 1822 1827 1828 1829 1831 1836 1839 1840 1841 1842 1843 1845 1848 1851 1854 1855 1858 1867 1873 1876 1877 1878 1879 1880 1881 1882 1886 1888 1890 1891 1895 1898 1900 1902 1904 1910 1912 1916 1918 1919 1920 1921 1922 1925 1926 1927 1928 1932 1933 1939 1940 1942 1943 1946 1949 19521954 1955 1959 1960 1961 1963 1964 1965 1971 1972 1973 1974 1977 1979 1981 1982 1983 1984 1985 1986
5. Conclusion and Recommendations
The objective of the study was to determine the existence of herding behavior in the Moroccan financial market. The analysis first focused on the multidimensional scaling MDS stipulating the construction of a perceptual space to display similarities and dissimilarities between stocks returns and the main stock market index. This study brought to light that the first stocks with the highest similarity to the index return are BMCE, BCP, IAM, ATW and CMSR, whereas the first stocks with the highest dissimilarity are PAP, IBC and SNP. This will have to allow investors to choose profitable alternatives and avoid those that present a possible risk. This preliminary analysis was supported by the analysis of investors' herd behavior using the CSAD methodology developed by Chang et al. (2000). The results obtained by the regression analysis showed the existence of herd behavior in Moroccan stock market both upward and downward. This finding was supported by the clear existence of a linearity between market performance and CSAD measurement, which confirms the prediction of a
non-linear inversion relationship between CSAD and𝑅𝑚, in the spirit of Chang et al. (2000). The results obtained are
in line with those of other literature studies, in particular the Economou’s study (2016), which found a clear existence of herd behavior in Nigeria and Morocco in 2005.
Given the results we have observed, herding behavior is present on the Moroccan stock market and we assign it to the low level of transparency that prevails in frontier stock exchanges and reduces the quality of their information environment, which induces investors not to react rationally and to draw information from the transactions of their peers. In terms of suggestion, future studies should use a fuzzy logical approach to take into account herding and other behavioral biases to study investors' decision-making process and offer them the opportunity to make an optimal choice of trading strategies in the market. The high presence of herd behavior in African frontier markets suggests that regulatory measures to stem it (e.g. by increasing transparency and investor confidence and allaying investor concerns) are necessary to prevent the emergence of destabilizing outcomes. With the objective to improve the quality of the information environment, such measures will make these markets more attractive to foreign investors and increase their volume, which is essential to the sustainability of these markets and their development towards emerging markets.
References
Ahsan, A. F. M. M. & Sarkar, A. H. (2013). Herding in Dhaka Stock Exchange. Journal of Applied Business and
Economics, 14(2), 11‑19.
Avery, C. & Zemsky, P. (1996). Multidimensional Uncertainty and Herd Behavior in Financial Markets. American, The Review, Economic.
Bailey, W. & Ng, D. (2010). Behavioral Biases of Mutual Fund Investors.
190
Informational Cascades. Journal of Political Economy, 100(5), 992‑1026.
Borg. & Groenen, P. (2005). Modern Multidimensional Scaling: Theory and Applications. Springer New York. Broihanne, M. H. & Capelle-Blancard, G. (2018). Richard Thaler Ou Comment La Finance Est Devenue
Comportementale.(Richard Thaler or How Finance Became Behavioural), 128.
Chang, E. C., Cheng, J. W. & Khorana, A. (2000). An examination of herd behavior in equity markets: An international perspective. Journal of Banking & Finance, 24, 1651‑1679.
Christie, W. G. & Huang, R. D. (1995). Following the Pied Piper: Do Individual Returns Herd around the Market?
Financial Analysts Journal, 51(4), 31‑37.
Deng, X., Hung, S. & Qiao, Z. (2018). Mutual fund herding and stock price crashes. Journal of Banking and Finance, 94, 166‑184.
Devenow, A. & Welch, I. (1996). Rational herding in financial economics. European Economic Review, 40(3‑5), 603‑615.
Economou, F. (2016). Herd Behavior in Frontier Markets: Evidence from Nigeria and Morocco. Handbook of Frontier Markets: The African, European and Asian Evidence. Elsevier.
Elhami, M. & Hefnaoui, A. (2018). l’efficience du marché dans les marchés émergents et frontières de la zone MENA. Finance & Finance Internationale, 10.
Évariste LEFEUVRE. (2011). Marchés financiers, la logique du hasard - Rapprocher les marchés et l’économie pour ne plus subir l’imprévisible. (E. D’Organisation, Éd.) (7 juill).
F.Cox, T. & Cox, M. A. A. (2000). Multidimensional Scaling, Second Edition (seconde).
Gong, P. & Dai, J. (2017). Monetary policy, exchange rate fluctuation, and herding behavior in the stock market.
Journal of Business Research, 76, 34‑43.
Grossman, S. J. & Stiglitz, J. E. (1980). American Economic Association On the Impossibility of Informationally Efficient Markets. The American Economic Review, 70(3), 393‑408.
Guney, Y., Kallinterakis, V. & Komba, G. (2017). Herding in frontier markets: Evidence from African stock exchanges. Journal of International Financial Markets, Institutions and Money, 47, 152‑175.
Hair Junior, J. F., Black, W. C., Babin, B. J., Anderson, R. L. & Tatham, R. L. (2009). Análise Multivariada de Dados. Tradução Adonai Schlup Sant’Anna.
Hott, C. (2009). Herding behavior in asset markets. Journal of Financial Stability, 5(1), 35‑56.
Lakonishok, J., Shleifer, A. & Vishny, R. W. (1992). The Impact of Institutional Stock Prices. Journal of Financial
Economics, 32, 23‑43.
Li, W., Wang, S. S. & Rhee, G. (2015). Differences in Herding : Individual vs . Institutional Investors.
Nirenberg, S. & Latham, P. E. (2003). Decoding neuronal spike trains: How important are correlations?
Proceedings of the National Academy of Sciences, 100(12), 7348‑7353.
Park, B. J. & Kim, M. J. (2017). A Dynamic Measure of Intentional Herd Behavior in Financial Markets. MPRA Paper, (11543).
Ren, R. & Wu, D. (2018). An Innovative Sentiment Analysis to Measure herd behavior. IEEE Transactions on Systems, Man, and Cybernetics: Systems, 1‑11.
Theriou, N., Mlekanis, G. & Maditinos, D. (2011). Herding by Mutual Fund Managers in the Athens Stock Exchange. European Research Studies Journal, XIV(4).
Vo, X. V. & Phan, D. B. A. (2017). Further evidence on the herd behavior in Vietnam stock market. Journal of
Behavioral and Experimental Finance, 13, 33‑41.