i
AN EVALUATION OF AN EXPANDED HIV TESTING PROGRAM IN NORTH CAROLINA SEXUALLY-TRANSMITTED DISEASE CLINICS
Pamela Whitney Klein
A dissertation submitted to the faculty of the University of North Carolina at Chapel Hill in partial fulfillment of the requirements for the degree of Doctor of Philosophy in the
Department of Epidemiology.
Chapel Hill 2013
Approved by:
William C. Miller, MD, PhD, MPH Peter A. Leone, MD
ii © 2013
iii
ABSTRACT
PAMELA WHITNEY KLEIN: An Evaluation of an Expanded HIV Testing Program in North Carolina Sexually-Transmitted Disease Clinics
(Under the direction of Dr. William C. Miller and Dr. Peter A. Leone)
Over 20% of the 1.1 million persons infected with HIV in the United States are unaware of their HIV infection; these persons contribute to approximately 50% of new transmission events each year. To address this problem, the Centers for Disease Control and Prevention released recommendations supporting routine, opt-out HIV testing in clinical settings. We conducted a before-after intervention analysis of a routine, opt-out HIV testing program implemented in North Carolina sexually transmitted disease (STD) clinics.
The study population included all adult North Carolina residents who were tested for HIV in any of the 102 North Carolina STD clinics from July 1, 2005 through June 30, 2011. Exposure was dichotomized at the date of intervention implementation on November 1, 2007. Three primary outcomes were considered: (1) HIV testing, as absolute counts and rate per 100,000 population; (2) detection of new HIV-infected persons, as absolute counts and HIV-positivity per 1000 tests; and (3) progression to AIDS within 12 months of HIV diagnosis. Interrupted time series analyses were used to examine trends in HIV testing and case detection over the study period; Poisson regression and multilevel regression models with county-specific random intercept terms were used to evaluate the overall impact of the intervention.
iv
confidence interval [CI]: 41, 72), but only increased by 34 tests per month (95% CI: 26, 42) post-intervention. A slight pre-intervention decline in the monthly rate of case detection was mitigated by the intervention (mean difference in HIV-positivity=0.01; 95% CI: -0.02, 0.05). Overall, no association was observed between the introduction of the intervention and risk of progression to AIDS within 12 months of initial HIV diagnosis (risk ratio=1.05, 95% CI: 0.77, 1.43).
v
vi
ACKNOWLEDGEMENTS
Completing a dissertation is far from an individual endeavor. From the initial
development of the project, to the many hours spent analyzing the data, to the final write-up, this dissertation has been a truly collaborative product.
This project would not have been possible without the unwavering supporting of my dissertation committee: William Miller, Peter Leone, David Weber, Lynne Messer, and Evan Myers. I consider myself lucky to consider each of my committee members as collaborators, colleagues, and friends. Bill took me under his wing and managed to keep me (relatively) calm throughout the long, stressful dissertation process. With Bill’s guidance, I matured into an independent researcher with strong analytic, study design, and communication skills. Peter guided my academic and professional development since my first semester at UNC, always encouraging me to push myself and seek new opportunities. David offered his advice and assistance at every turn. Lynne, always willing to participate in committee meetings at very early West Coast hours, helped me to understand the utility of non-traditional analytic methods to answer complex, real world questions. Evan exposed me to important role of economic analyses in the evaluation of public health interventions and always urged me to consider potential macro explanations for my results.
vii
implementing an HIV prevention program with various clinical partners and taught me how to collaborating with the applied public health sector. Janet Alexander was instrumental in ensuring access to the surveillance data necessary for this project and helped me to understand the data sources. The staff at the HIV Prevention Unit helped me to realize my passion for evaluating and improving HIV prevention efforts.
Nancy Colvin and Carmen Woody in the Department of Epidemiology Student Services Office provided me with essential emotional and academic support during my six years at UNC. Nancy and Carmen helped me to navigate the administrative hurdles at UNC, while always offering sound advice.
This project would not have been possible without generous funding support from the Training in Infectious Disease Epidemiology training grant (T32) and the Center for Disease Control and Prevention’s Expanded HIV Testing Initiative. These funding sources allowed me to pursue this dissertation project and make a contribution to the greater health of North Carolinians.
I would never have successfully completed this dissertation without the love and support of my family and friends. My parents, Roberta and Arthur Klein, have always
believed in me and encouraged me to follow my passions. Since I was in elementary school, my parents have acted as my cheerleaders, supporting me through rough patches and ready to celebrate when I succeeded (no matter how small the accomplishment!). I also must credit Andrew Miklos for doing his best to keep me sane, composed, focused, and productive. Andrew has been incredibly patient with me, as I experienced all the emotional and intellectual highs and lows of this program. I could not have survived this endeavor without my parents and Andrew’s constant faith in my ability to succeed.
viii
ix
TABLE OF CONTENTS
LIST OF TABLES……….. xii
LIST OF FIGURES……….... xv
LIST OF ABBREVIATIONS………. xvi
CHAPTER 1: SPECIFIC AIMS ... 1
CHAPTER 2: INTRODUCTION ... 4
Tables and Figures ...15
CHAPTER 3: RESEARCH DESIGN AND METHODS ...19
Study Design: A Before-After Intervention Analysis ...19
Study Setting: North Carolina STD Clinics ...20
Data Sources ...21
Aim 1: HIV Testing and Case Detection ...23
Study Population ...23
Outcome ...24
Exposure ...25
Patient and Clinic Covariates ...26
Data Analysis ...27
Aim 2: Progression to AIDS ...34
Study Population ...34
Outcome ...35
Exposure ...35
Patient and Clinic Covariates ...36
x
Tables and Figures ...39
CHAPTER 4: IMPACT OF A ROUTINE, OPT-OUT HIV TESTING PROGRAM ON HIV TESTING AND CASE DETECTION IN NORTH CAROLINA SEXUALLY-TRANSMITTED DISEASE CLINICS ...41
Introduction ...41
Methods ...42
Results ...46
Discussion ...48
Tables and Figures ...52
CHAPTER 5: RISK OF PROGRESSION TO AIDS AMONG NEWLY- DIAGNOSED HIV-INFECTED PERSONS BEFORE AND AFTER THE INTRODUCTION OF A ROUTINE, OPT-OUT HIV TESTING PROGRAM IN NORTH CAROLINA SEXUALLY-TRANSMITTED DISEASE CLINICS ...57
Introduction ...57
Methods ...58
Results ...62
Discussion ...64
Tables and Figures ...68
CHAPTER 6: CONCLUSION ...72
Summary of Findings ...73
Interpretation of Results ...75
Public Health Significance ...77
Future Research Directions ...79
Final Remarks ...80
Appendix 1: Literature Review of Routine HIV Testing Studies ...82
Appendix 2: Aim 1 Supplemental Tables and Figures ...88
xi
xii
LIST OF TABLES
Table 2.1: Comparison of HIV Testing Strategies ...17 Table 3.1: Data Sources ...39 Table 4.1: Demographic and Clinic-Level Characteristics of Persons
Tested for HIV in North Carolina STD Clinics, July 2005
through June 2011 ...52 Table 4.2: Monthly Change in the Rate of HIV Tests per 100,000
Population in North Carolina STD Clinics Attributable to the North Carolina Expanded HIV Testing Program, July
2005-June 2011...54 Table 4.3: Monthly Change in the Rate of New HIV-Positivity per 1,000
HIV Tests Performed in North Carolina STD Clinics Attributable to the North Carolina Expanded HIV Testing Program, July
2005-June 2011...55 Table 4.4: Overall Impact of North Carolina Expanded HIV Testing
Program on HIV-Positivity using County-Specific Random Intercept Multilevel Regression, North Carolina STD Clinics,
July 1, 2005 through June 30, 2011 ...56 Table 5.1: Demographic and Clinic-Level Characteristics of Newly-
Identified HIV-Infected Persons in North Carolina STD Clinics,
July 2005 through June 2011...68 Table 5.2: Progression to AIDS After Initial HIV Diagnosis, Base and
Alternative Definitions, among Newly-Identified HIV-Infected Persons in North Carolina STD Clinics, July 1, 2005 through
June 30, 2011 ...69 Table 5.3: Unadjusted and Adjusted Associations between the Expanded
HIV Testing Program and Risk of Progression to AIDS using
County-Specific Random Intercept Regression Models ...70 Table 5.4: Association between the Expanded HIV Testing Program and
Risk of Progression to AIDS, Stratified by Patient-Level Characteristics ...71 Table A1.1: Overview of Published Studies Describing HIV Testing
Interventions in the United States ...82 Table A1.2: Published Evaluations of Routine HIV Testing Programs
with Comparison Groups ...84 Table A1.3: Survey-Based and Ecologic Evaluations of Routine HIV
xiii
Table A2.1: Demographic and Clinic Characteristics of Persons Tested for HIV in North Carolina STD Clinics by HIV Test Results,
July 2005 through June 2011 ...88 Table A2.2: Interrupted Time Series Analysis of the Number of HIV Tests
Performed per Month in North Carolina STD Clinics, July 2005
through June 2011 ...89 Table A2.3: Interrupted Time Series Analysis of the Rate of HIV Testing
per 100,000 Population per Month in North Carolina STD
Clinics, July 2005 through June 2011 ...90 Table A2.4: Interrupted Time Series Analysis of the Number of New HIV-
Infected Diagnoses per Month in North Carolina STD Clinics,
July 2005 through June 2011 ...91 Table A2.5: Interrupted Time Series Analysis of the Rate of New HIV-
Infected Diagnosis per 1,000 HIV Tests per Month in North
Carolina STD Clinics, July 2005 through June 2011 ...92 Table A2.6: Sensitivity Analysis: Comparison of Lag Periods (0 months,
3 months, 6 months) on Interrupted Time Series Results for
HIV Testing and Case Detection Outcomes ... 120 Table A2.7: Intercensal Population Estimates, 2005-2011... 121 Table A2.8: Sensitivity Analysis: Comparison of Fixed Effects Models and
County-Specific Random Intercept Multilevel Models on HIV Positivity, Adjusted for Patient and Clinic Covariate Sets and
Calendar Year of Testing ... 122 Table A2.9: Sensitivity Analysis: Comparison of Lag Periods (0 months,
3 months, 6 months) on Multilevel Model Results on HIV Positivity, Adjusted for Patient and Clinic Covariate Sets and
Calendar Year of Testing ... 123 Table A3.1: Demographic and Clinic Characteristics of Persons Tested
for HIV in North Carolina STD Clinics by Risk of Progression to AIDS within 12 Months of Initial HIV Diagnosis, July 2005
through June 2011 ... 124 Table A3.2: Sensitivity Analysis: Impact of Adjusting for Calendar Year
of HIV Testing on Associations between the Expanded HIV Testing Program and Risk of Progression to AIDS using
County-Specific Random Intercept Regression Models ... 125 Table A3.4: Sensitivity Analysis: Comparison of Fixed and County-
Specific Random Intercept Regression Models on
Associations between the Expanded HIV Testing Program
xiv
Table A3.5: Sensitivity Analysis: Comparison of Lag Periods (0 months, 3 months, and 6 months) on Associations between the
Expanded HIV Testing Program and Risk of Progression to AIDS ... 128 Table A3.6: Association between the Expanded HIV Testing Program
and Risk of Progression to AIDS, Stratified by Clinic-Level
Characteristics ... 129 Table A3.7: Absolute Risks of HIV (per 1000 Tests) and Progression to
AIDS within 12 months for Women over the Study Period
xv
LIST OF FIGURES
Figure 2.1: The Spectrum of Engagement in HIV Care in the United States ...15 Figure 2.2: Progression of HIV Infection, by CD4 Count and HIV RNA
Viral Load ...16 Figure 2.3: Adults and Adolescents Living with a Diagnosis of HIV
Infection, Year-End 2008, 40 States and 5 US Dependent Areas ...18 Figure 3.1: North Carolina State Lab of Public Health HIV Testing Algorithm ...40 Figure 4.1: Interrupted Time Series Analysis of Overall Monthly Trends
in (a) the Number of HIV Tests, (b) the Number of HIV Tests per 100,000 Population, (c) the Number of New HIV-Infected Cases, and (d) the New HIV-Positivity per 1,000 HIV Tests in
North Carolina STD Clinics, July 2005 through June 2011 ...53 Figure A2.1(a-aa): Results of Interrupted Time Series Analysis in North
Carolina STD Clinics, July 1, 2005 through June 30, 2011,
xvi
LIST OF ABBREVIATIONS
95% CI 95% confidence interval
AIDS Acquired immunodeficiency syndrome
ARIMA Autoregressive moving average
CD4 Cluster of differentiation 4
CDC Centers for Disease Control and Prevention
ED Emergency department
eHARS Electronic HIV/AIDS Reporting System
EIA Enzyme immunoassay
HIV Human immunodeficiency virus
MD Mean difference
MeSA Metropolitan statistical area
MiSA Micropolitan statistical area
MSM Men who have sex with men
OR Odds ratio
QALY Quality-adjusted life year
RD Risk difference
RNA Ribonucleic acid
RR Risk ratio
SLPH State Laboratory of Public Health
STD Sexually-transmitted disease
UC Urgent care
CHAPTER 1: SPECIFIC AIMS
In 2006, the Centers for Disease Control and Prevention (CDC) recommended routine, opt-out human immunodeficiency virus (HIV) testing in clinical settings and launched a funding initiative to support the implementation of expanded HIV testing programs that focus on routine screening.1,2 Approximately 20% of persons infected with
HIV are unaware of their HIV-infected status; disease transmission from these individuals accounts for 50% of new HIV infections in the United States.3-5 From 2007 through 2010, the
CDC initiative funded 2.8 million HIV tests and identified over 18,000 new HIV-infected cases.2 However, these newly-diagnosed persons represent only a fraction of the
approximately 150,000 new transmission events that occurred in the United States during the same time period.6
Although, routine, opt-out HIV testing programs have increased HIV testing, the evidence is inconclusive regarding the impact of these programs on HIV case detection and HIV-related clinical outcomes (Table A1.2).7-13 To date, presentation of data on these
programs are predominated by descriptive analyses that fail to compare the intervention to any control group (Table A1.1). Evaluations that used control groups have focused on clinical facilities in major metropolitan centers, limiting generalizability the Southeastern United States, which bears a disproportionate burden of HIV infection.14 Due to small
numbers and inadequate statistical methods, the public health importance of existing evaluations is questionable.
2
(STD) clinics on: HIV testing, the new diagnosis HIV-infected cases, and risk of progression to acquired immunodeficiency syndrome (AIDS) shortly after HIV diagnosis.
Aim 1: Estimate the impact of a routine, opt-out expanded HIV testing program on HIV testing patterns and the detection of new HIV-infected cases in North Carolina STD clinics
Hypothesis: Both the number and rate of HIV testing and new HIV-infected cases were
higher post-intervention (post-intervention period: November 1, 2007 – June 30, 2011) than
pre-intervention (pre-intervention period; July 1, 2005 – October 31, 2007).
Overview: To address the inconclusive data available regarding the detection of
HIV-infected persons with an expanded HIV testing program, we used a before-after intervention analysis of persons tested for HIV in North Carolina STD clinics. Interrupted time series analyses were used to assess the change in outcome trends over time, while accounting for underlying temporal correlation. Multilevel regression models were used to evaluate the overall impact of the intervention and account for patient clustering within STD clinics.
Aim 2: Estimate the impact of a routine, opt-out expanded HIV testing program on the risk of progression to AIDS within 12 months of initial HIV diagnosis among newly-identified HIV-infectedcases detected in North Carolina STD clinics
Hypothesis: New HIV-infected cases identified post-intervention (post-intervention period:
November 1, 2007 – June 30, 2011) had a lower risk of progression to AIDS within 12
months of initial HIV diagnosis new HIV-infected cases identified pre-intervention
(pre-intervention period: July 1, 2005 – October 31, 2007).
Overview: A large proportion of new HIV-infected cases present as “late diagnoses”, cases with advanced HIV disease that are diagnosed with AIDS within one year of their HIV
3
in their disease progression, fewer patients would present at late stages of infection. We used a before-after intervention analysis to compare the risk of progression to AIDS among new HIV-infected cases diagnosed in North Carolina STD clinics before and after the implementation of a routine, opt-out HIV testing intervention. Multilevel regression models were used to evaluate the overall impact of the intervention and account for patient clustering within STD clinics.
Efficient HIV testing strategies are essential to engage infected persons in HIV-specific medical care, which subsequently prevents HIV-related morbidity and mortality, as well as the further disease transmission.3,17-23 Although routine HIV testing is feasible and
4
CHAPTER 2: INTRODUCTION
In 2006, in an effort to increase population awareness of HIV status and, eventually reduce HIV transmission in the United States, the CDC released recommendations for routine, opt-out HIV screening in clinical settings.1 Expanded HIV testing programs showed
the acceptability and feasibility of routine HIV screening in clinical settings (Table A1.1).7,9,10
However, the ability of expanded HIV testing programs to adequately address the specific goals of the CDC’s recommendations remained unclear.
Importance of HIV Testing
HIV testing is the gateway to accessing the continuum of HIV care, which includes linkage, engagement, and retention in HIV-specific medical care (Figure 2.1).3 HIV care,
especially treatment with antiretroviral therapy, is important from both the personal and public health perspectives. Once engaged in HIV care, patients can be treated with
antiretroviral medication to achieve viral load suppression.17-19 Patients with suppressed viral
loads are less likely to experience negative health outcomes, such as opportunistic
infections, and are more likely to have increased life expectancy and improved quality of life. Of the 1.1 million persons believed to be living with HIV in the United States, 21% are not aware of their HIV-infected status.3 These HIV-infected persons who are unaware of
their status contribute to approximately 50% of all new HIV transmission events in the United States.4,5 Increased HIV transmission from persons who are unaware of their
5
the likelihood of HIV transmission, failure to engage in HIV care.20-25 Without case detection
and engagement HIV care, suppression is not possible.
History and Rationale for CDC Recommendations
The importance of HIV testing to both the treatment of HIV-infected persons and preventing disease transmission has been well-recognized.1 However, shortcomings mire
current HIV testing strategies. Before the CDC recommendations, most HIV testing protocols called for diagnostic or risk-based HIV testing (Table 2.1).
Diagnostic testing screens patients because of clinical signs and/or symptoms commensurate with advanced HIV infection (Figure 2.2).26 HIV is largely asymptomatic
before progression to AIDS; the asymptomatic phase of infection lasts approximately 10 years.27,28 Therefore, diagnostic testing based on symptoms of opportunistic infections
detects people late in the course of their infection. In addition to poor health outcomes for the HIV-infected individual, if the person has been unaware of his/her infection for many years, there is an increased likelihood that this person contributed to further disease transmission.4
Since many years can pass between seroconversion and the development of clinical symptoms, a person presenting late for HIV testing may have had multiple prior contacts with medical providers without an HIV testing encounter. Among patients diagnosed with AIDS within 1 year of their initial HIV diagnosis in South Carolina, 73% made at least one visit to a health-care facility before their diagnosing HIV test.29 Late diagnoses and these
missed opportunities for HIV testing highlight the limitations of diagnostic HIV testing strategies. Although highly specific for case detection, diagnostic testing is an inadequate public health intervention.
6
assessment is conducted by an HIV counselor. HIV counselors inquire about a patient’s sexual history and practices, past drug use, trading sex for drugs or money, incarceration, or history of other sexually transmitted diseases. The goal of risk-based HIV testing is to
identify HIV-infected persons before they present with AIDS-related symptoms, while concentrating resources on patients who are at high risk for HIV acquisition.30
Testing only patients with prescribed risk factors further stigmatizes the disease and the at-risk patient population.31-33 Risk assessments often misrepresent a person’s true risk
profile; persons may be hesitant to report risky behaviors, such as multiple sexual partners, same-gender sexual interactions (especially men who have sex with men), or drug use. 30,34-39 Additionally, many persons with HIV do not belong to traditional high-risk groups, limiting
the utility of risk assessments to identify HIV-infected persons.30,40 Misrepresentation of a
person’s true risk profile limits the utility of the risk assessment and can lead to decreased HIV testing of truly high-risk persons.
The shortcomings of both diagnostic and risk-based HIV testing led to the investigation of alternative HIV testing strategies through mathematical simulations and cost-effectiveness models. A “test and treat” HIV prevention protocol, in which all persons in a population are regularly tested for HIV and all HIV-infected persons are provided with antiretroviral therapy, was explored in a mathematical model. 41 This model demonstrated
the potential for the “test and treat” paradigm to significantly halt the HIV epidemic in South Africa.
To examine the economic feasibility of a universal HIV testing strategy in the United States, incremental cost-effectiveness analyses were used to compare routine HIV
screening with diagnostic testing. These economic analyses found routine HIV screening to be cost-effective, costing approximately $40,000 per quality-adjusted life year (QALY), compared with diagnostic testing.42-44 The generally accepted threshold for a cost-effective
7
life and reduced medical bills from opportunistic infections, as well as prevention of secondary disease transmission, routine HIV screening results in a low cost per QALY.46
CDC Recommendations for Routine HIV Screening
The CDC released recommendations for routine HIV screening in clinical settings to reach the population of HIV-infected persons who present late for HIV testing.1 These
recommendations were further supported by the limitations of diagnostic and risk-based testing, the potential of the “test and treat” paradigm to impede the HIV epidemic, and the estimated cost-effectiveness of routine HIV screening. The recommendations urged routine, opt-out HIV screening in clinical settings where the prevalence of infection was at least 0.1%.1 The primary goals of the CDC recommendations were to (a) increase HIV testing, (b)
detect previously unaware HIV-infected persons, and (c) identify HIV-infected persons earlier in the course of their HIV infection, compared with diagnostic or risk-based HIV testing protocols.
The CDC disbursed funding to city and state health departments with high HIV/AIDS burdens to implement expanded HIV testing programs in clinical settings. Since the
introduction of this funding initiative in 2007, clinical setting personnel have performed 2.8 million HIV tests and identified 18,000 new HIV-infected cases (0.7% positivity).2 However,
these new diagnoses only represent a fraction of the estimated 150,000 new HIV transmission events during the same period.6
Existing Literature Neglects Program Goals and Lacks Generalizability
Since the release of the CDC recommendations in 2006, over 50 peer-reviewed publications have described expanded HIV testing programs in clinical settings (Table A1.1). The majority of publications are solely descriptive, demonstrating the feasibility and
8
crucial to the success of expanded HIV testing programs, they do not directly address the goals of the CDC’s recommendations. Clinical measures, such as concurrent AIDS
diagnosis, CD4 counts, or viral load measurements, are only included in a small fraction of publications.7-9,11-13,47-56 Comparison between publications is challenging because the
programs described vary in their scope and HIV testing protocols (Table A1.1). Over half (22/55) of the publications detail HIV testing programs in emergency departments. This focus on emergency departments limits the generalizability of these studies to similar acute care settings (Table A1.1). Emergency departments act as access points for many uninsured persons who are at increased risk for HIV acquisition, but they represent a selected subset of the overall US health-care seeking population.57,58 Other
expanded HIV testing programs have been described in community health centers (3), prisons/jails (6), dental clinics (1), STD clinics (5), primary care settings (2), hospital inpatient settings (5), and health care systems (4).
Contradictory Evidence from Comparison Studies
In contrast with the plethora of descriptive analyses, only 19 of these program evaluations included a comparison group (Table A1.2). The majority of evaluations with comparison groups showed an increased number of HIV tests performed with the
introduction of the expanded HIV testing program. However, the magnitude of this increase varied based on the clinical setting. In most clinical settings, very little HIV testing was done prior to the intervention, so the number of HIV tests conducted could increase
greatly.11,49,56,59-62 In other clinical settings with high-risk patient populations, like STD clinics,
the baseline rate of HIV testing was so high that the maximum benefit from an HIV testing program was minimal.63
9
programs were associated with an increase in HIV case detection in many clinical settings (Table A1.2). However, some sites showed a decrease or no change in the proportion of patients testing positive for HIV.7,8,11,12,49,56,62,64,65 The investigator’s choice of outcome used
to assess program yield, either the number of newly identified HIV-infected persons or the positivity proportion, can change the interpretation of a programs’ ability to identify new HIV- infected persons. For example, an Veteran’s Administration health system in Washington, DC observed that the number of HIV- infected persons identified increased from 47 to 69 with the introduction of routine HIV screening, yet the positivity proportion decreased from 1.5% to 1.1%.62 This discrepancy can be attributed to the large increase in HIV testing that
was needed to detect additional HIV cases.
These analyses with comparison groups are often restricted to a single clinical facility, which limits the size of the population under study. Because HIV is a rare infection in the general population (1% HIV prevalence is considered very high), very few new HIV- infected cases were identified in these single-facility HIV testing programs (Table A1.2). The public health significance of findings based on such small numbers is questionable.
Additionally, the focus on single clinical facilities limits the generalizability of the findings to similar settings – most commonly, urban emergency departments with limited
pre-intervention HIV testing. One must question the applicability of these findings to other clinical settings or more rural areas of the United States.
Few program evaluations consider the immunologic state of newly-diagnosed persons at diagnosis or the timing of progression to AIDS.7,8,11,13 Ecologic data from New
York City and Rhode Island suggested an improvement in the immunologic status of newly-diagnosed HIV-infected persons with the introduction of programs or policies that facilitated routine, opt-out HIV testing.66,67 However, these studies did not examine the individual-level
10
allowing routine, opt-out HIV testing) and the immunologic status of a sample of persons in the catchment area of the system-wide change (New York City: Bronx HIV surveillance records; Rhode Island: clinical data on persons attending an HIV clinic).
Other program evaluations were based in emergency departments in major metropolitan centers. In a study from Oakland, California, the proportion of persons diagnosed with AIDS at the time of their HIV diagnosis (CD4 ≤ 200) was 48% during an experimental opt-out HIV testing program, compared with 25% in the opt-in protocol comparison group.13 However, when the same emergency department changed from a
diagnostic-based testing program to routine screening, the average CD4 cell count at diagnosis increased from 99 cells/uL to 356 cells/uL.11 In an emergency departments in
Denver, Colorado, and Chicago, Illinois, CD4 cell counts increased with a change from diagnostic-based HIV testing to routine, opt-out screening.7,8
Although these programs examined clinical outcomes, they could only assess immunologic status at diagnosis and not progression to an immune-compromised state over time. Medical records were restricted to the single facility that performed the diagnosing HIV test; data were not linked to surveillance records and HIV- infected persons could not be tracked for engagement in HIV care in other clinical settings. As discussed previously, HIV is a rare outcome and the sample sizes of these evaluations are inadequate to confidently describe any potential public health impact. In combination, these studies only examined 90 HIV-infected persons pre-intervention and 134 HIV-infected persons post-intervention.7,8,11,13
Gaps in the Comparison Study Literature
Further research is needed to critically evaluate expanded HIV testing programs using a valid comparison group to identify if expanded HIV testing programs are indeed meeting CDC goals. The number and proportion of HIV- infected patients must be
11
focus on clinical settings with limited HIV testing pre-intervention, such as emergency departments, sets unrealistic expectations. The maximum potential of an intervention in a clinical setting is dictated by the clinic’s size and capacity. The potential increase in HIV testing in clinical settings with low pre-intervention levels of HIV testing is much greater than could possibly be observed in clinical settings with high pre-intervention levels of testing. As clinical settings with a high proportion of at-risk patients would, presumably, already have some HIV testing capacity, a greater emphasis should be placed on the incremental impact of HIV testing programs in these settings.
Although useful to indicate the ability of routine HIV testing programs to perform a greater number of HIV tests, the current literature does not provide consistent evidence that these programs have led to more HIV- infected persons are being identified, or identified any earlier in the course of infection.
Southeastern United States is an Area of High HIV Burden
The geographical and social context of an HIV epidemic is crucial to consider when planning HIV prevention efforts. Following the “test and treat” simulation model based in South Africa, the gross differences between the South African and American HIV epidemics necessitated inquiry as to the translation of the model’s results to the American context.68-71
United States-based simulation models identified the potential for “test and treat”
interventions to reduce transmission, although the extent of that reduction varied. However, the US epidemic also experiences regional variation, which is often ignored in nationally-aggregated HIV prevention data, including official reports of the CDC’s expanded HIV testing funding initiative.2
In particular, the bulk of the expanded HIV testing literature focuses on major
12
other, more rural areas of the country. Only 6 publications cite expanded HIV testing programs in the Southeastern United States.54,61,72-75
The Southeastern US experiences some of the country’s highest rates of HIV infection (Figure 2.3).14 In the early 2000s, the number of new AIDS cases in the Deep
South increased 35.6%, compared with an increase of only 5.6% in other states.76 Given
issues with late diagnosis and potential transmission of HIV infection when the disease is left untreated, the disproportionate burden of HIV infection born by the Southeastern United States is not surprising.
In North Carolina, an estimated 35,000 persons are living with HIV/AIDS, including 7,000 who may be unaware of their infection.40 Approximately 1,500 new HIV cases are
detected annually. North Carolina has the 8th highest rate of new HIV diagnoses at 23.8
cases per 100,000 (US rate 21.1 per 100,000) and the 13th highest rate of adults and
adolescents living with HIV infection at 294.0 per 100,000 (US rate = 337.5 per 100,000). North Carolina also has the 11th highest rate of AIDS diagnoses at 11.6 per 100,000 (US
rate = 11.2 per 100,000).
The prevalence of many poor health indicators is higher in the Southeastern United States than other regions of the country; many of these poor health indicators can facilitate, directly or indirectly, HIV transmission. These poor health indicators include: high levels of poverty, inconsistent availability and quality of health care services, and a high prevalence of STDs and other comorbid conditions.76
Racial/ethnic disparities in the HIV-infected population are more pronounced in the Southeast than in other regions of the country.14 In North Carolina non-Hispanic blacks
account for 22% of the state’s population, but represent over 66% of the state’s HIV case burden.40 In 2010, the rate of HIV diagnoses was 94 cases/100,000 among non-Hispanic
13
of incarceration among non-Hispanic black men, which disrupts the normal gender ratios of communities, and concurrent sexual relationships.77-80
Acute infection is a major concern in areas like North Carolina, where transmission is not solely driven by persons with established infection, but by newly infected individuals. In the early 2000s, an outbreak of acute HIV infection among young, black men who have sex with men was identified in the college student population in North Carolina.81 Since 2003,
176 acute cases of HIV have been identified. Eighty percent of these cases were male and 69% were black; he median age of infection was 25 years.40 Acute HIV infection is indicative
of a more recent, evolving epidemic, rather than an epidemic of more established, chronic infection seen in many metropolitan centers.
The rural nature of much of the Southeastern United States also complicates HIV prevention efforts. Persons living in rural areas are more likely to experience stigma related to HIV infection, which could adversely impact the success of HIV testing efforts and
disclosure of HIV status to sexual partners.82-85 Persons living in rural areas are more likely
to present with late diagnosis of HIV and experience barriers in accessing HIV care.82,86-90
These barriers could be related to social stigma or structural barriers, such as a lack of transportation to HIV care specialists.
The Role of HIV Testing in Current HIV Treatment Paradigms
With the advancement of new HIV care paradigms like “treatment as prevention” after the successful HIV Prevention Trials Network Study 052, HIV testing’s role as the access point to the HIV treatment cascade is of even greater importance.24 Yet, the ability of
14
geographic regions of the US has not yet been demonstrated.7 Through this study, we aim
15 Tables and Figures
Figure 2.1: The Spectrum of Engagement in HIV Care in the United States
16
Figure 2.2: Progression of HIV Infection, by CD4 Count and HIV RNA Viral Load
17
Table 2.1: Comparison of HIV Testing Strategies Testing Strategies Description
Diagnostic Testing Selection or intended selection of patients because of clinical signs and symptoms suspected to be due to HIV infection
Targeted Screening Selection or intended selection of all patients from among a defined subpopulation that are thought to have an increased likelihood of infection when compared with the base population
Nontargeted Screening
Selection or intended selection of any patient within the available population without respect to risk, but not intended to comprehensively include every available patient
18
Figure 2.3: Adults and Adolescents Living with a Diagnosis of HIV Infection, Year-End 2008, 40 States and 5 US Dependent Areas
CHAPTER 3: RESEARCH DESIGN AND METHODS
Study Design: A Before-After Intervention Analysis
This study used a before-after intervention analysis design to assess a) HIV testing, b) the detection of new HIV-infected persons, and c) the risk of progression to AIDS among newly-diagnosed persons, before and after the implementation of a routine, opt-out HIV testing program in North Carolina STD clinics. The impact of the intervention was
determined by comparing the outcome frequencies before and after the implementation of the program (before: July 1, 2005 – October 31, 2007; after: November 1, 2007 – June 30, 2011). Data from 28 months prior to the implementation of the intervention was used as a comparison group.
To examine the success of this routine, opt-out HIV testing program, we compared post-implementation data from STD clinics with pre-implementation data from the same STD clinics. A cluster randomized trial would be the ideal study design to isolate the effects of the intervention. However, the intervention was not randomized to clinical sites at the start of program implementation. Randomization cannot occur after the introduction of the
intervention, so an observational retrospective study design must be used.
20
differences between STD clinics, we used multilevel regression models with county-specific random intercept terms.
Our before-after design was further strengthened by the large number of HIV tests performed in the STD clinics (over 400,000) and the large number of STD clinics in the state (102). This large sample size allowed us to stratify our results by patient and clinic
covariates to evaluate if the impact of the intervention was uniform across all population subgroups. HIV testing protocols and technologies did not change over the study period; the only change to testing practices was the introduction of the intervention in November 2007. North Carolina is a geographically and demographically-diverse state, which will make our results generalizable to STD clinic patients in the Southeastern region.
This before-after study design avoided issues of confounding that would have biased our results if STD clinics were compared to other types of facilities, such as private physician offices. However, by restricting our analysis to STD clinics, we limited the generalizability of our results to the STD clinic patient population.
Study Setting: North Carolina STD Clinics
The Southeastern United States bears a disproportionate burden of HIV infection, accounting for nearly 50% of the new AIDS cases in the United States in 2009 and 2010.14,40
The rate of new HIV infections (23.8 per 100,000) and new AIDS diagnoses (11.6 per 100,000) in North Carolina is higher than the national average (HIV: 21.1 per 100,000; AIDS: 11.2 per 100,000).40 Due to demonstrated need for HIV prevention activities in North
Carolina, the state was chosen as a grantee for the CDC’s expanded HIV testing initiative in 2007.2
In North Carolina, the expanded HIV testing program focused on initiating or
21
administrative code to allow clinical facilities to remove the requirement for a separate written consent form for HIV and to incorporate routine, opt-out HIV testing.92 This policy
change led to the establishment of many new HIV testing programs with routine, opt-out testing protocols.
With this intervention, a conventional, non-rapid, blood-based HIV test was offered to every STD clinic patient. Blood samples were tested at the State Laboratory for Public Health (SLPH), with automatic pooling for detection of acute HIV infection by ribonucleic acid (RNA) testing. Before the implementation of the intervention, HIV testing was
performed selectively based on risk and presumptive syphilis status using an opt-in protocol with separate written consent. A standardized protocol for routine, opt-out HIV testing was used by all STD clinics that participated in the intervention (n=102).
Data Sources
Subject inclusion in this analysis was conditional on the successful completion of an HIV test. Therefore, HIV testing data was used as the primary data source. Multiple data sources provided a comprehensive picture of HIV testing in North Carolina STD clinics (Table 3.1).
STD Clinic Data and Laboratory Data
Data on demographic information and HIV testing results were abstracted from the SLPH electronic laboratory database. A paper form containing patient demographic and clinical information was filled out by STD clinic staff upon HIV testing, and accompanied each blood sample sent to and processed at the SLPH.
Once the blood sample arrived at the SLPH, the demographic and clinical
22
maintained by staff members of the North Carolina Division of Public Health based in Raleigh, NC.
Data for HIV-Infected Persons
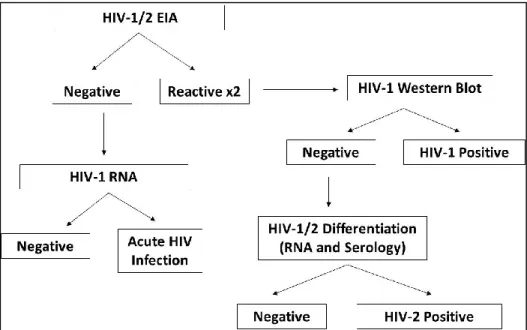
All persons who tested positive for HIV on both a 3rd generation EIA laboratory test
and a confirmatory Western Blot laboratory test were considered confirmed HIV-infected cases by North Carolina (Figure 3.1).40 Persons who tested negative on the 3rd generation
EIA laboratory test but tested RNA-positive for HIV viral RNA were designated as acute HIV infections, and were also considered confirmed HIV-infected cases.
All HIV-positive test results from the SLPH database were linked to or entered into the electronic HIV/AIDS Reporting System (eHARS). eHARS is the surveillance system used by the North Carolina Division of Public Health to collect and organize information on all HIV-infected cases in North Carolina. eHARS data are collected from state-mandated HIV case report forms and laboratory data, and updated by reports from HIV clinical providers. Other clinical data, such as the date of AIDS diagnosis, are also included in eHARS.
If the HIV-positive test in the study period was the case’s first HIV-positive test result in North Carolina, a new eHARS record was created for that patient and the patient was considered a new HIV diagnosis for surveillance purposes. If, however, the same patient was previously entered in eHARS, their positive test result during the study was
23
Clinic-Level Covariates
Clinic-level covariate data was obtained from publically-available datasets, including data from the US Census Bureau (metro/micropolitan statistical area categorizations, county population density, percentage living below poverty line), clinic-specific information
(presence of an in-house HIV clinic), and published North Carolina HIV/AIDS surveillance reports (reported HIV case rate for the STD clinic county).
Aim 1: HIV Testing and Case Detection
Estimate the impact a routine, opt-out expanded HIV testing intervention on HIV testing
patterns and the detection of new HIV-infected cases in North Carolina STD clinics
Study Population
The study population included all patients tested for HIV in North Carolina STD clinics in the 28 months prior to the implementation of the intervention through June 30, 2011 (pre-intervention period: July 1, 2005 – October 31, 2007; post-intervention period: November 1, 2007 – June 30, 2011). Included patients were aged 18-64 and maintained a permanent residence in North Carolina.
24 Outcome
Outcome 1: HIV Testing
The first outcome for Aim 1 was HIV testing performed in the STD clinics, evaluated both as the absolute number of HIV tests per month and as the HIV testing rate per 100,000 population. All persons included in the study population were tested for HIV and contributed to this outcome. The absolute number of HIV tests was evaluated over time with serial monthly cross-sections evaluated using interrupted time series analysis. The HIV testing rate per 100,000 population was evaluated in both interrupted time series analysis and multilevel regression modeling.
Annual intercensal population estimates were used as the denominator for the HIV testing rate (Table A2.7). Due to limitations of the available datasets, we could not create a denominator-based on the actual number of patient visits in the STD clinics. Intercensal population estimates are annually-updated population estimates using data from the most recent national census to capture population changes between 10-year census surveys, stratified by county and by demographic subgroups.
Outcome 2: Newly-Diagnosed HIV-Infected Persons
The second outcome for Aim 1 was the identification of newly-diagnosed HIV-infected persons in North Carolina STD clinics. This outcome was evaluated both as the absolute number of newly-diagnosed HIV-infected persons and as the HIV positivity per 1,000 HIV tests. An HIV-infected diagnosis was defined as a person who tested HIV positive on a 3rd generation blood-based enzyme immunoassay (EIA) diagnostic test and was
confirmed positive via Western Blot, or a person who tested HIV negative on a 3rd
generation blood-based EIA diagnostic test, but positive on HIV RNA testing (Figure 3.1).93
25
patients had either already been reported to North Carolina Division of Public Health, or were known to be a confirmed case of HIV in another state. All preliminary HIV test results (rapid tests, EIAs, etc.) were confirmed by Western Blot analysis, in accordance with North Carolina testing protocols.
For this study, a new HIV-infected case met the above diagnostic criteria for a confirmed HIV-infected case, but had never before been reported as a case of HIV. A new HIV-infected case was defined as a person with a positive HIV test result in the same calendar month as the patient’s HIV diagnosis date as documented in eHARS. This window period allowed for potential reporting delays and uncertainty regarding some persons who lacked a specific date of HIV diagnosis; these persons were assigned to the 15th day of their
diagnosis month. This approximation recoded 69 HIV-infected cases as newly-diagnosed, when they otherwise would have been considered a previous diagnosis (3.3% of patients with a positive test result, 0.009% of the total study population).
All results were stratified by patient and clinic characteristics to identify trends in population subgroups and assist with public health decision making. These stratified results will help to direct limited public health resources to areas of greatest impact, as well as identify areas of continued need.
Exposure
26
Base case regression models included a lag period of 3 months. The inclusion of a lag period allowed for the exclusion of a short period of unusual variability post-intervention that may not be attributable to the intervention under study. Lag periods capture the real-world challenges of implementing an intervention in a clinical setting, while allowing staff and clinicians to fully adjust to and operationalize the intervention as dictated in standard
operating procedures. Previous studies of HIV testing programs in North Carolina
community health centers indicate that some HIV testing outcomes may be inflated during this lag period, before the outcomes stabilizes.94 Therefore, in base case regression
analyses, persons tested prior to November 1, 2007 were considered “unexposed” and those tested after February 1, 2008 were considered “exposed”; HIV testing and case detection patterns for persons in the lag period were modeled separately. In sensitivity analyses, the length of the lag period was varied from 0 months (no lag) to 6 months.
Patient and Clinic Covariates
As our analysis used a quasi-experimental before-after study design within a closed set of STD clinics, the primary difference between pre- and post-intervention periods should only have been the introduction of the intervention. This approach is complementary to a randomized controlled trial, in which the investigators aim to create two identical groups that only differ by the assignment of exposure. Covariates that may have been associated with the outcome were determined a priori, and included in statistical modeling. Since the exposure variable was time and the intervention was a direct result of an external public health initiative, we did not expect a confounding relationship between covariates and the exposure. Models were adjusted for sets patient covariates (gender, race/ethnicity, age), clinic covariates (metropolitan status, population density, percentage of county living below the poverty line, presence of an in-house HIV clinic, baseline HIV case rate), or all
27
estimates. Due to our quasi-experimental study design, we anticipated that the crude, unadjusted effect estimates would be valid.
Patient date of birth was used to calculate age at time of HIV testing and was coded categorically (age 18-24, 25-34, 35-44, 45-64). Sex was assessed as male/female. Patient race/ethnicity was categorized as non-Hispanic white, non-Hispanic black, Hispanic, or other (Asian, Hawaiian/Pacific Islander, Native American, multi-race).
Urban/rural categorizations of counties were described by the US Census Bureau’s metropolitan/micropolitan statistical area groups (MeSA, MiSA, neither) and by the county population density (<199, 200-399, 400-599, ≥600 persons per square mile).95,96 The
percentage of the county’s population living below the poverty line was used as a marker of the economic status of each county (<15%, 15-19.9%, 20-24.9%, ≥25%).97 The average
baseline county-level estimated HIV case rate per 100,000 from 2005 to 2007 was included as a categorical variable categorized for analysis as (0-4.9, 5-9.9, 10-14.9, ≥15).40 A
dichotomous variable identified the presence or absence of an in-house HIV clinic; STD clinics with an in-house HIV clinic were Durham, Mecklenberg, and Wake Counties.
Data Analysis
Preliminary Descriptive, Univariate, and Bivariate Analyses
28
Assessing Missing Data
The amount of missing exposure or outcome data in this analysis was unknown. SLPH and eHARS surveillance databases may have had incomplete records. We assumed that only a small amount of the exposure or outcome data were missing. Unfortunately, this assumption could not be verified.
The covariates were evaluated for patterns of missingness in frequency tables, both overall, and in strata of the exposure (pre- and post-intervention). Given the small proportion of study subjects missing individual-level covariate information (age, sex, race/ethnicity; n=9,961, 2.4% of patients with a valid HIV test result), a complete case analysis was conducted. The final analysis cohort included 402,774 unique HIV tests performed over 72 monthly time points.
Multivariate Analyses
Multivariate analyses were conducted using two distinct, but complementary methods: interrupted time-series analysis and multilevel modeling. Both methods
incorporate time, however, under different functional assumptions. Interrupted time-series analysis uses monthly cross-sections as the unit of analysis and controls for underlying temporal trends to examine changes in the outcome over time. Multilevel models evaluate the overall impact of the intervention while controlling for clinic-level correlation.
Time Series (ARIMA) Models: Rationale
Interrupted time series analyses evaluate non-randomized interventions by assessing a repeated series of observations on the same study population.98,99 These
29
Interrupted time series analysis is considered the most rigorous evaluation method for non-randomized observation studies.100 Although initially designed for use in economics,
interrupted time series analyses are now used regularly in evaluations of community interventions, new clinical policies, and medication use.98,101,102
Time Series (ARIMA) Model: Design
Interrupted time series analyses were used to determine if the change in HIV testing or case detection after implementation of the intervention was greater or less than would be expected in the absence of the intervention, while accounting for time-based correlation in the data.98,99 Segmented regression lines characterized the temporal trends in the outcome
by the ‘level’ at which the segment starts (intercept) and the trend (slope). The analysis examined how the level (intercept) and trend (slope) of the segment changed after the introduction of the intervention. A lag period, or transitional period, of 3 months was specified to account for a period of program ramp-up to ideal levels. In sensitivity analysis, the lag period was varied from 0 months (no lag) to 6 months.
The specific interrupted time series technique used in this analysis was
autoregressive integrative moving average (ARIMA) models. ARIMA models are used when error terms are potentially associated with one another and not independent.98,99,103 Since
this analysis used repeated sampling of the same STD clinics over time, we expected that error terms would be correlated with one another. Based on autocorrelation and partial autocorrelation plots, we observed an autocorrelation of 1 (AR=1) for all outcomes except HIV positivity. Autocorrelation of 1 means that the outcome at time 2 is correlated with the outcome at time 1, the outcome at time 3 is correlated with the outcome at time 2, etc.99
30 Base ARIMA Model:98
𝑌𝑡 = 𝛽0+ 𝛽1∗ 𝑡𝑖𝑚𝑒𝑡+ 𝛽2∗ 𝑖𝑛𝑡𝑒𝑟𝑣𝑒𝑛𝑡𝑖𝑜𝑛𝑡+ 𝛽3∗ 𝑡𝑖𝑚𝑒 𝑎𝑓𝑡𝑒𝑟 𝑖𝑛𝑡𝑒𝑟𝑣𝑒𝑛𝑡𝑖𝑜𝑛𝑡+ 𝑒𝑡
𝑌𝑡: mean outcome in month t
Time: time in months at time t from the start of the study period
Intervention: indicator for time t occurring before (intervention = 0) or after (intervention = 1) the implementation of the intervention
Time after intervention: continuous variable counting number of months after intervention at time t, coded 0 before the intervention
𝛽0: pre-intervention intercept
𝛽1: pre-intervention slope, change in the outcome per month before the intervention
𝛽2: post-intervention intercept, immediate change after introduction of intervention
𝛽3: post-intervention slope attributable to the intervention, incremental difference in slope
compared with the pre-intervention slope
𝑒𝑡: error term, random variability not explained by the model
Time Series (ARIMA): Outcome
The primary outcome of interest in the ARIMA model was the change in outcome (HIV testing or case detection) attributable to the intervention (𝛽3). The overall
post-intervention slope was described as the sum of the pre-post-intervention slope (𝛽1) and the
change in outcome attributable to the intervention (𝛽3).
31
Multilevel Models: Rationale
We used multilevel, or hierarchical, regression models to account for correlation between STD clinics. Persons who visited a specific STD clinic may be similar to one another, yet different from patients at other STD clinics. This clustering of similar patients within STD clinics violates the independence assumption of traditional linear models.104,105
Advanced modeling techniques that account for the correlation between STD clinics were necessary to calculate valid estimates.
Multilevel models included both individual-level and group-level covariates. In this analysis, patients were nested within STD clinics, and the exposure-outcome association may have been influenced by both patient-level and clinic-level covariates. Multilevel models provide an intermediate approach between analyzing all patients as an aggregate
population (ignoring clinic-level covariates) and creating a separate regression line for each clinic, which may overestimate the differences between clinics.104,105
Multilevel Models: Design
32 Fixed-Slope Random intercept model:104,105
𝑦𝑖𝑗= (𝛽1+ 𝜁1𝑗) + 𝛽2𝑥𝑖𝑗+ ⋯ + 𝛽𝑝𝑥𝑝𝑖𝑗 + 𝜖𝑖𝑗
i: patient-specific indicator
j: facility-specific indicator
𝛽1: patient-specific fixed intercept
𝜁1𝑗: facility-specific random intercept, deviation of facility j’s intercept from the mean intercept
𝛽1; weighted average of the within-facility and between group-facility intercept estimates;
normally distributed with mean=0 and variance=ψ [~N(0,ψ)]
𝛽2: patient-specific fixed slope
𝛽𝑝: coefficient for additional covariates
𝜖𝑖𝑗: patient-specific error; random deviation of 𝑦𝑖𝑗 from facility j’s mean
In sensitivity analyses, this random intercept model was compared with a model without random components (fixed effects model). Fixed effects models assume that no parameters vary by group (or clinic, in this case) – including both intercept and slope parameters. These models essentially examine the study population as one aggregate group, ignoring possible correlation between clinics.
Multilevel Models: Intervention/Time
33
Sensitivity analyses considered two alternative lag periods of 0 months (no lag) and 6 months. In the sensitivity analysis that did not include a lag period, time was coded dichotomously with the only knot on November 1, 2007. The 6-month lag period was modeled similarly to the 3-month lag, but with the second knot occurring at May 1, 2008.
To account for additional underlying temporal trends, models were adjusted for the year of HIV testing using an indicator term. All models were calculated with and without this calendar year indicator variable.
Multilevel Models: Outcomes
The HIV testing rate per 100,000 population was modeled using a Poisson distribution and a log link. Poisson regression, which can either examine counts or rates, needs an offset term when the outcome is in the form of a rate. The offset for this analysis was calculated as the log of the intercensal population denominator. These Poisson models yielded rate ratios (RR) and corresponding 95% confidence intervals. Because we lacked individual-level denominator data, we only considered an unadjusted, fixed effects
regression model.
HIV positivity is a rare outcome; the overall HIV positivity from the CDC-funded HIV testing initiative in North Carolina in 2010 was 0.25% (includes all emergency departments, community health centers, STD clinics, and county jails).40 This analysis examined serial
cross-sections and could not evaluate risk of HIV acquisition over time. A model with a binomial distribution and logit link function was used to calculate odds ratios (ORs), which approximated prevalence ratios, and corresponding 95% confidence intervals.
34
Carolina. The width of the confidence intervals was influenced by degree of variability observed at the facility level.
Multilevel Models: Covariates
As discussed above, our results should not be biased by confounders because we used the STD clinics as internal controls. However, as our comparator group is not a perfect counterfactual, covariates determined a priori to influence the outcome were evaluated as potential confounders. Models were adjusted for sets of covariates: patient-level covariates (gender, race/ethnicity, age), clinic-level covariates (metropolitan status, population density, percentage of the county below the poverty line, presence of an in-house HIV clinic, and baseline HIV case rate), and patient + clinic level covariates. Nested models were compared to one another using likelihood ratio tests at an a priori significance level of 0.10.
All statistical analyses will be conducted with SAS version 9.2 (SAS Institute, Cary, NC).106
Aim 2: Progression to AIDS
Estimate the impact of a routine, opt-out expanded HIV testing program on the risk of
progression to AIDS within 12 months of initial HIV diagnosis among newly-identified
HIV-infected cases detected in North Carolina STD clinics
Study Population
35 Outcome
Outcome: Risk of Progression to AIDS
The outcome for Aim 2 was the risk of progression to AIDS after a new diagnosis of HIV, defined as the proportion of newly diagnosed HIV-infected patients who progress to AIDS (and were reported as such) within 1 year of their initial HIV diagnosis. AIDS cases were based on the North Carolina Division of Public Health definition of a person who meets certain immunologic criteria (CD4 count <200 or <14%) or who becomes ill with one of 26 AIDS-defining conditions.40
Sensitivity analyses varied the window period for progression to AIDS from 1 month to 18 months. Specific alternative outcome time frames considered were 1 month, 6 months, and 18 months post-diagnosis. Although the CDC uses a 12 month window period to define “late HIV diagnosis”, the North Carolina Division of Public Health uses a 6 month time frame.15,40 Other definitions of “late HIV diagnosis” from the literature include AIDS at
diagnosis, based on the CD4 count measured within 1 or 3 months post-diagnosis.107-109 To
allow for potential reporting delays or imprecise dates of HIV or AIDS diagnosis, an
additional 15 days were added to each outcome time period (1 month + 15 days, 6 months + 15 days, etc.).
Exposure
As in Aim 1, the exposure for this analysis was time, which was used to denote the presence or absence of the intervention in the STD clinic. Patients diagnosed
post-intervention (after November 2007) were categorized as “exposed”; those diagnosed pre-intervention were categorized as “unexposed”.
36
assumption was evaluated in sensitivity analysis with the inclusion of 3 and 6 month lag periods.
Patient and Clinic Covariates
As described in Aim 1, covariates were considered for adjustment if they were determined, a priori, to be associated with the outcome of interest. In addition to the covariates examined in Aim 1, we also considered the patient’s self-reported previous HIV testing history (yes/no) and self-reported risk profile. A combination variable that included gender and self-reported sexual risk factors was created, yielding the following categories: female, male heterosexual, and man who had sex with other men (MSM). These risk groups were selected for this variable based on the key risk groups in North Carolina.40 We
expected the unadjusted, crude effect estimate to be the most valid, but tested sets of covariates for model inclusion (patient covariates [gender, race/ethnicity, age, previous HIV test, risk behaviors], clinic covariates [metropolitan status, population density, percentage of the county living below the poverty line, presence of an in-house HIV clinic, baseline HIV case rate], patient and clinic covariates) using likelihood ratio tests in nested models with an a priori significance level of 0.10.
Data Analysis
Preliminary Descriptive, Univariate, and Bivariate Analyses
37
using counts and frequency distributions. Chi-square statistics were calculated to describe differences in covariate distributions by exposure level.
Assessing Missing Data
As noted in Aim 1, missing data may be present in set of covariates. Given the small proportion of study subjects missing individual-level covariate information (age, sex,
race/ethnicity, previous HIV test, risk group; n=39, 3.1% of patients with a new HIV diagnosis), a complete case analysis was conducted. The final analysis cohort included 1203 persons newly diagnosed with HIV during the study period.
Multilevel Models: Rationale and Design
As described in the analysis plan for Aim 1, the patients in this dataset were naturally clustered within STD clinics, which introduces a correlation structure that violates the
independence assumption of traditional generalized linear models.104,105 The correlation that
exists within and between STD clinics was accounted for with multilevel modeling. The structure of the multilevel models used in this aim mirrored those described in the Aim 1 analysis plan with a county-specific random-intercept model as a base case model structure. Fixed effects models that lacked random effects components were explored in sensitivity analyses.
Multilevel Models: Outcomes
38
the intervention in all STD clinics in North Carolina. Facility-specific beta coefficients were not evaluated.
All results were stratified by patient and clinic characteristics to identify trends in specific population subgroups. Stratified estimates were obtained with interaction terms. The interaction terms were tested for significance using likelihood ratio tests at an a priori
significance level of 0.10.
39 Tables and Figures
Table 3.1: Data Sources
Data Source Variables
NC State Laboratory of Public Health HIV test results
Patient demographics (age, gender, race, risk factors for HIV acquisition, previous HIV testing history)
Electronic HIV/AIDS Reporting System (eHARS) Distinguish new or previously-known positives Date of AIDS diagnosis
US Census Bureau Metropolitan/Micropolitan Statistical Areas County population density
Percentage of county living below poverty line
North Carolina HIV/AIDS Surveillance Reports Estimated HIV/AIDS incidence in clinic region
40
CHAPTER 4: IMPACT OF A ROUTINE, OPT-OUT HIV TESTING PROGRAM ON HIV TESTING AND CASE DETECTION IN NORTH CAROLINA SEXUALLY-TRANSMITTED
DISEASE CLINICS
Introduction
In the United States, approximately 20% of people infected with HIV are unaware of their HIV-infected status; disease transmission from these individuals accounts for 50% of new HIV infections.3,5 Effective HIV testing programs are essential to identify HIV-infected
persons and enroll them in medical care, thereby slowing disease progression and reducing further HIV transmission.18,22 In 2006, the Centers for Disease Control and Prevention (CDC)
recommended routine, opt-out HIV testing in clinical settings.1 From 2007 through 2010,
testing programs funded by the CDC’s expanded HIV testing initiative performed 2.8 million HIV tests and identified over 18,000 new HIV-infected cases.2 However, these cases
represent only a small fraction of the approximately 150,000 new HIV infections acquired over the same period.6
Routine, opt-out HIV testing can be feasible to implement and acceptable to both patients and providers.7,9,10 Although the number of HIV tests performed increases with the
introduction of an expanded HIV testing program, the impact on the identification of new HIV-infected cases has been inconclusive. While some expanded HIV testing programs showed an increase in case detection, others showed a decrease or no
change.7,9,13,62,63,65,110-112 These programs have been limited by small numbers and a focus
on clinical settings with minimal HIV testing prior to implementation.