IDENTIFICATION OF BIASED KAPPA OPIOID RECEPTOR LIGANDS FOR IN VIVO PROBING OF SPECIFIC SIGNAL TRANSDUCTION PATHWAYS
Kate Lynn White
A dissertation submitted to the faculty of the University of North Carolina at Chapel Hill in partial fulfillment of the requirements for the degree of Doctor of Philosophy in the
Department of Pharmacology
Chapel Hill 2014
iii ABSTRACT
Kate Lynn White: Identification of Biased Kappa Opioid Receptor Ligands For In Vivo Probing of Specific Signal Transduction Pathways
(Under the direction of Dr. Bryan L. Roth)
iv
v
vi
ACKNOWLEDGEMENTS
First and foremost, I would like to thank my mentor, Dr. Bryan L. Roth, for allowing me to join his lab and providing the opportunities to fully enjoy graduate school. I am grateful for the time, guidance, and resources he provided during my graduate education, and I cannot thank him enough for his encouragement. His drive and passion for science is admirable and he has motivated me to conduct front of the field research.
I would also like to the past and present members of the Roth lab. This lab taught me the power of team science and has been a wonderful home for me to learn and grow as a scientist. This lab provided me with invaluable advice, encouragement, and constructive criticism after I presented lab meetings. In particular I would like to thank Eyal Vardy for encouraging and challenging me. Additionally, I would like to thank Dan Urban and Marty Farrell for immediately welcoming me to the lab and providing me with advice and scientific discussions. I also would like to thank Flori Sassano for teaching me how to succeed and helping me with assay optimization. Lastly, I would like to thank Sandy Hufeisen, Estela Lopez, and Tom Mangano for always helping get what I need for my experiments. The Roth lab has been filled with encouragement and excitement, and I couldn’t be happier with my time there.
vii
Also, I would like to thank Gary Johnson for being an excellent chair of the department. I would also like to thank the members of my dissertation committee, Ken Harden, Terry Kenakin, Tom Kash, and Kathleen Caron, for their support and advice regarding my dissertation research. I would like to thank the Malanga lab, particularly Elliott Robinson for his help with the intracranial self-stimulation experiments and discussions regarding KOR signaling and behavioral effects.
viii
TABLE OF CONTENTS
TABLE OF CONTENTS ... viii
LIST OF TABLES ... xi
LIST OF FIGURES ... xii
LIST OF ABBREVIATIONS ... xiii
LIST OF SYMBOLS ... xvi
CHAPTER 1. BACKGROUND ... 1
1.1. INDRODUCTION ... 1
1.2. GPCR STRUCTURE AND FUNCTION ... 2
1.3. THE OPIOID FAMILY OF GPCRS ... 5
1.4. THE KAPPA OPIOID RECEPTOR ... 8
CHAPTER 2. SCREENING FOR BIASED KAPPA OPIOID LIGANDS ... 13
2.1. INTRODUCTION ... 13
2.2. METHODS ... 16
2.3. RESULTS ... 20
ix
2.3.2. Functional Analysis and Bias Factor Quantification ... 20
2.3.3. Orthologous Arrestin Recruitment Assay ... 22
2.4. CONCLUSIONS ... 23
CHAPTER 3. IN VIVO PROBING OF SELECT SIGNALING PATHWAYS ... 39
3.1. INDRODUCTION ... 39
3.2. METHODS ... 41
3.3. RESULTS ... 47
3.3.1. G Protein Signaling Contributes To Analgesic-like Effects ... 47
3.3.2. G Protein Signaling Mediates Aversion In Conditioned Place Aversion ... 47
3.3.3. Arrestin Signaling Contributes To Deficit In Rotarod Performance ... 49
3.3.4. A G Protein-Biased KOR Ligand has no Effect On Nolvety Induced Locomotion ... 49
3.3.5. G Protein Signaling Mediates KOR Agonists Effect On Reward ... 50
3.3.6. A G Protein-Biased KOR Agonist Does Not Induce Anhedonia-like Effects ... 51
3.4. CONCLUSIONS ... 53
CHAPTER 4. DISCUSSION AND FUTURE DIRECTIONS ... 67
x
4.2. DETERMINING THE MOLECULAR BASIS FOR KOR
FUNCTIONAL SELECTIVITY ... 67 4.3. COMPLICATIONS OF CELL TYPE SPECIFIC EFFECTS ... 70 4.4. DEVLOPING METHODS FOR DETECTING SPECIFIC
SIGNALING PATHWAYS IN VIVO ... 71 4.5. DEVELOPING TOOLS FOR ACTIVATING SPECIFIC
SIGNALING PATHWAYS IN VIVO ... 72 4.6. DETERMINGING THE GLOBAL SIGNALING EFFECTS
xi
LIST OF TABLES
Table 2.1. Concentration response curves of compounds identified
as "actives" from the NCC library screen ... 27
Table 2.2. Affinity and potency values for arylacetamides using GloSensor and Tango ... 28
Table 2.3. Affinity and potency values for dynorphin peptides using GloSensor and Tango ... 29
Table 2.4. Affinity and potency values for morphinans using GloSensor and Tango ... 30
Table 2.5. Affinity and potency values for benzomorphans using GloSensor and Tango ... 31
Table 2.6. Affinity and potency values for RB family of salvinorin derivatives using GloSensor and Tango ... 32
Table 2.7. BRET arrestin affinity and potency values ... 33
Table 2.8. Comparison of Bias Factor generated with Tango and BRET assays ... 34
Table 2.9. LogTau/KA values for all tigands tested ... 35
Table 3.1. Potencies and Efficacies of ligands for mouse KOR in vitro ... 59
xii
LIST OF FIGURES
Figure 1.1 Dynamic nature of GPCR conformations... 11 Figure 1.2. KOR mediated cellular signaling and hypothesized
behavioral outcomes ... 12 Figure 2.1. Depiction of the parallel screening approach and
results of the NCC library screen ... 37 Figure 2.2. Arrestin mobilization and G protein activation dose-response
curves of candidates for future studies ... 38 Figure 2.3. Log relative max vs. log bias of tested compounds... 39
Figure 3.1. Schematic of in vivo screening approach ... 60 Figure 3.2. KOR agonist induced G protein signaling causes analgesia-like
effects in the hotplate assay ... 61 Figure 3.3. KOR agonist induced G protein signaling causes conditioned
place aversion ... 62 Figure 3.4. β-arrestin 2 signaling contributes to KOR agonist induced
rotarod deficit ... 63 Figure 3.5. Effect of KOR agonists on novelty induced locomotion ... 64 Figure 3.6. KOR agonist induced G protein signaling mediates responses
xiii
Figure 4.2. Location of residues within or around the KOR binding pocket
xiv
LIST OF ABBREVIATIONS 5HT1B – 5-hydroxytryptamine 1B receptor
5HT2B – 5-hydroxytryptamine 2B receptor
7TM – seven transmembrane AC – adenylate cyclase
ANOVA – analysis of variance Asp - asparagine
β2AR – β2 adrenergic receptor
BNST – bed nucleus of the stria terminalis
BRET – bioluminescence resonance energy transfer BSR – lowest frequency that sustained responding cAMP – cyclic adenosine monophosphate
CPA – conditioned place aversion CRF – corticotropin-releasing factor DOR – δ-opioid receptor
Dyn – dynorphine
DMSO – dimethyl sulfoxide
xv Emax – maximum response
ERK – extracellular signal-regulated kinase GABA - glutamate and γ-aminobutyric acid
GIRK – G protein-coupled inwardly-rectifying potassium channels Glu – glutamate
GPCR- G protein-coupled receptor GRK – G protein receptor kinase ICSS – intracranial-self stimulation JNK – c-Jun N-terminal
KO – knockout
KOR – κ-opioid receptor
LSD – lysergic acid diethylamide
MAPK – mitogen-activated protein kinase MAX – maximum response rate
MOR – μ-opioid receptor NAc – nucleus accumbens
NMR – nuclear magnetic resonance
xvi
NCC – The National Institutes of Health Clinical Collection PKA – phosphokinase A
PPI – prepulse inhibition RM – repeated measures Sal A – salvinorin A
SEM – standard errors of the mean TEV – tabacco etch virus
TM – transmembrane
xvii
LIST OF SYMBOLS Gα – G protein alpha
Gβγ – G protein beta gamma β-arrestin – beta arrestin
1
CHAPTER 1: BACKGROUND
1.1 INTRODUCTION
G protein-coupled receptors (GPCRs) are a superfamily of seven transmembrane receptors involved in transmitting diverse extracellular signals allowing cells to sense and adapt to their environment. There are more than 800 members within the human GPCR superfamily, and they are widely expressed throughout the human body and involved in a number of disease states (Fredriksson et al., 2003). Additionally, these receptors are targeted by approximately 30% of marketed drugs and represent about 4% of the human genome (Hopkins and Groom, 2002). The three major classes of GPCRs are the rhodopsin-like receptors (class A), the secretin receptors (class B), the metabotropic glutamate receptors (class C), and the frizzled/smoothened receptors (class F). Furthermore, recent advances in our understanding of GPCR signaling have revalidated many GPCR targets for therapeutics with fewer side effects. Classically, the GPCR signaling transducers are G proteins (Gα and Gβγ), and after activation the receptor is phosphorylated by G protein receptor kinases (GRKs) which recruits β-arrestins leading to desensitization and internalization of the receptor (Gilman, 1987; Lohse et al., 1990).
2
activating mitogen-activated protein kinases (MAPKs) to altering protein synthesis (DeWire et al., 2008). Furthermore, different GRK subtypes have been shown to induce unique regulatory functions. For example, the V2 vasopressin receptor (V2R) mediated β-arrestin-dependent ERK activation is regulated by GRK5 and GRK6, and second messenger signaling is negatively regulated by GRK2 (Ren et al., 2005). This observation led to the hypothesis that GRK mediated phosphorylation of the C-terminal tail of GPCRs generates a phosphorylation “barcode” that dictates interactions with effector proteins and the pattern of subsequent signaling (Nobles et al., 2011). GPCRs represent successful drug targets, and increasing the understanding of the mechanisms and functional effects of GPCR activation might aid in more effective and safer therapies.
1.2 GPCR STRUCTURE AND FUNCTION
In 2000, the first high-resolution structure of a mammalian GPCR was obtained (bovine rhodopsin) (Palczewski et al., 2000). The past decade has been a “golden era” for GPCR structural studies that began with a key collaboration between the labs of Brian Kobilka at Stanford University and Ray Stevens at Scripps. Kobilka’s detailed knowledge of the β2AR and
the technological advances developed in the Steven’s lab allowed for the solution of the structure of the crystalized β2AR in 2007 (Cherezov et al., 2007; Rosenbaum et al., 2007). Since then, the
3
GPCRs, like all proteins, are highly dynamic and adopt changing conformations. GPCR binding partners stabilize certain conformations that select for interactions with specific binding partners, affecting signaling pathways. These binding partners include ligands, G proteins, and arrestins (Kenakin, 2002; Nygaard et al., 2013; Yan et al., 2008). Unbound receptors fluctuate between active and inactive states, allowing for basal signaling, and inverse agonists stabilize the receptor in a rigid inactive state to prevent signaling (Nygaard et al., 2013). Agonist binding leads to small conformational changes within the binding pocket that translate to larger changes in the intracellular region of the transmembrane helices, which allow for interactions with intracellular signaling proteins (Katritch et al., 2013; Liu et al., 2012; Ranganathan et al., 2012). The most pronounced helical rearrangement during receptor activation involves a large “swinging” effect of transmembrane VI (TM VI) and movements of TM V, and this rearrangement is most pronounced in the β2AR-Gα complex (Katritch et al., 2013; Rasmussen et
al., 2011).
Several conserved microswitches have been identified in GPCR activation. The D[E]RY motif in TM III is highly conserved in class A GPCRs (rhodopsin-like GPCRs). Asp3.50 forms a salt bridge to Asp(Glu)3.49, and this salt bridge is broken only in the β2AR-Gαstructure. In this
4
and these residues are clustered together in the center of the GPCR below the binding pocket. These microswitches are involved in ligand-induced conformational changes in the binding pocket that translate to larger intracellular rearrangements and activation.
Different ligands stabilize different GPCR conformations, causing unique signaling effects (Liu et al., 2012; Nygaard et al., 2013). Certain ligands can stabilize partially activated conformations that allow for the activation of a subset of downstream signaling effects (Liu et al., 2012; Ranganathan et al., 2012; Wacker et al., 2013) (Fig. 1.1). This phenomenon is known as “functional selectivity” or “biased signaling” (Kenakin, 2011; Urban et al., 2007). Numerous ligands exhibit G protein or β-arrestin biased (Allen et al., 2011). The G protein-biased ligands mediate conformational movements of TM VI, and the β-arrestin-biased ligands mediate movements in TM VII (Liu et al., 2012). Further structural mechanisms of functional selectivity were revealed by the structures of the 5HT1B and 5HT2B receptors in complex with ergotamine,
which is a β-arrestin biased ligand for the 5HT2B receptor. Comparing the structures of these
receptors revealed distinct differences in the conformation of TM VI and TM VII. TM VI in the 5HT1B receptor is in a more active conformation than in the 5HT2B receptor, and TM VII is in a
more pronounced active state in the 5HT2B receptor than in the 5HT1B receptor (Wacker et al.,
2013). The PIF motif is in a partially activated conformation in the 5HT2B receptor and in a fully
active conformation in the 5HT1B receptor, suggesting a possible role of this motif in mediating
the biased signaling of ergotamine in the 5HT2B receptor (Wacker et al., 2013).
5
targets for a wide range of therapeutics with the promise of greater therapeutic efficacy and fewer side effects. Multiple studies have suggested that the anti-psychotic effects of dopamine D2
receptor agonists are mediated by β-arrestin signaling (Allen et al., 2011; Klewe et al., 2008; Masri et al., 2008; Urs et al., 2012). There are several functionally selective ligands in clinical trials for a number of disease states: acute heart failure (angiotensin II 1a receptor), postoperative pain (mu opioid receptor (MOR)), and moderate to severe pain (delta opioid receptor (DOR)) (Allen et al., 2011; DeWire et al., 2013; Monasky et al., 2013; Pradhan et al., 2011; Whalen et al., 2011). A detailed review of current targets for biased ligand therapies was compiled by Whalen et al., 2011.
The entire opioid family is being investigated for functionally selective therapies because of the receptors roles in physiology, and the structures of all four family members in complex with an antagonist were recently solved (Granier et al., 2012; Manglik et al., 2012; Thompson et al., 2012; Wu et al., 2012). Combining this structural information with mutagenesis and functional studies should provide insight into the molecular mechanism of specific pathway activation and aid in designing biased ligands to test in vivo.
1.3 THE OPIOID FAMILY OF GPCRS
6
bind and activate the receptors, morphine and ketocyclazocine (Gilbert and Martin, 1976; Lord et al., 1977), and DOR was named based on its discovery in the mouse vas deferens (Lord et al., 1977). The NOP was originally an orphan receptor and was classified as an opioid receptor based on high sequence homology (Henderson and McKnight, 1997). The opioid receptors are expressed widely throughout the central nervous system (CNS) and periphery, where they mediate nociception and analgesia (Goldstein et al., 1971; Mansour et al., 1988; Pert and Snyder, 1973). Opioid receptors regulate many physiological functions in addition to pain perception and analgesia. MOR activation can cause respiratory depression, euphoria, and addiction, and it can impact immune functions and gastrointestinal motility (Dhawan et al., 1996). DOR activation can cause physical dependence, convulsions, and anti-depressant effects (Broom et al., 2002). KOR agonists cause hallucinations, dysphoria, anticonvulsant effects, diuresis, and neuroprotection, but they have a low abuse potential (Ranganathan et al., 2012; Roth et al., 2002; Schunk et al., 2011; Schwarzer, 2009). NOP activation cause anxiolysis, depression, and anxiety effects, and it alter learning, memory, and immune responses (Lambert, 2008).
The opioid receptors couple to the Gαi/o subtype of G proteins and inhibit adenylyl
7
Decreases in cAMP production have been shown to attenuate the activity of cAMP-dependent PKA resulting in reduced neurotransmitter release (Chavez-Noriega and Stevens, 1994; Greengard et al., 1991). Opioid receptors have been found to inhibit the release of glutamate and γ-aminobutyric acid (GABA) and have been found to have, overall, inhibitory effects on the CNS (Williams et al., 2001). However, opioid receptors have different effects on physiology because of differing expression patterns and unique inputs on certain brain regions (Wee and Koob, 2010). For example, MOR and KOR cause opposing effects on the reward circuitry. The rewarding effects of MOR agonists are thought to be mediated by a release of dopamine in the brain, while KOR agonists cause an inhibition in dopamine release leading to aversion (Di Chiara and Imperato, 1988; McLaughlin et al., 2003a; Zimmer et al., 2001).
8
Polymorphisms of opioid peptides and receptor genes are associated with a higher risk of drug abuse and psychiatric disorders (Butelman et al., 2012; Tejeda et al., 2012).
1.4 THE KAPPA OPIOID RECEPTOR
This dissertation focuses on KOR as a potential therapeutic target for analgesics that have low potentials for dependence and abuse. The KOR/dynorphin system is involved in many stress-induced behaviors, including anxiety, addiction, and depression, and in multiple disease states, such as psychiatric diseases and epilepsy (Sheffler and Roth, 2003; Tejeda et al., 2012; Tortella et al., 1986). KOR agonists have been reported to cause psychotomimesis and hallucinations (Pfeiffer et al., 1986; Roth et al., 2002). Originally, these hallucinations were thought to be mediated by off-target effects, but in 2002 the hallucinogenic component of salvia divinorum, named salvinorin A (sal A), was found to selectively interact with KOR (Roth et al., 2002). Prior to this study, the only receptor reported to mediate hallucinations was the 5HT2A
receptor, which is activated by LSD (Nichols, 2004). This finding solidified the role of KOR in mediating consciousness and the perception of reality, and provided additional avenues for treating cognitive disease states such as Alzheimer’s Disease and schizophrenia (Vortherms and Roth, 2006). The effects of KOR activation on cognition remain relatively unexplored compared with the wealth information regarding the role of KOR in drug abuse and mood disorders.
9
dopamine release in the nucleus accumbens (NAc), contributing to depressive-like behaviors (Ebner et al., 2010; Markou and Koob, 1991). Furthermore, after chronic drug abuse, the actions of the endogenous KOR system cause a decrease in dopamine in the NAc, contributing to subsequent depressive-like effects (Knoll and Carlezon, 2009). KOR activation decreases dopamine release in the ventral tegmental area (VTA), which is associated with the negative reinforcement of drug dependence (Trifilieff and Martinez, 2013; Wee and Koob, 2010). Stress-induced corticotropin-releasing factor (CRF) causes dysphoria and drug relapse by activating the dynorphin system (Bruchas et al., 2009; Land et al., 2008). KOR activation also mediates synaptic transmission in brain regions that regulate affective behavior, such as the bed nucleus of the stria terminalis (BNST) (Li et al., 2012). These studies suggest an unambiguous role of the KOR/dynorphin system in stress response and depressive-like behaviors. For this reason, KOR antagonists are being investigated as potential anti-drug abuse and anti-depressive therapeutics. KOR activation also induces analgesia with a low abuse potential, providing an additional analgesic drug target, but KOR agonists are limited as analgesic therapies because they cause dysphoria and hallucinations (Ansonoff et al., 2006; Pfeiffer et al., 1986; Ranganathan et al., 2012).
Recent efforts have begun to understand how certain KOR-dependent signaling cascades mediate the diverse effects of KOR agonism. As previously mentioned, KOR couples to Gαi/o
10
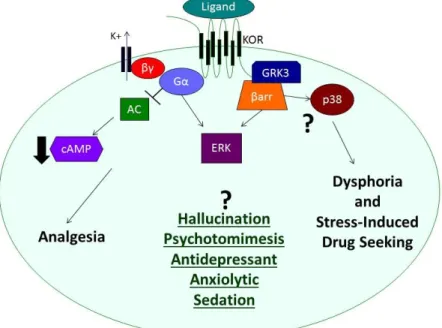
was found to be mediated by GRK3 phosphorylation and arrestin recruitment in primary neurons and astrocytes (Bruchas et al., 2006). A single point mutation (S369A) in the C-terminal tail of the rat KOR was found to prevent GRK3 phosphorylation and receptor desensitization (McLaughlin et al., 2003b). p38 MAPK activation is absent upon activation of S369A KOR, presenting a potential approach for understanding the role of p38 MAPK in KOR mediated behaviors (Bruchas et al., 2006). This receptor mutant was shown to mediate aversion and stress-induced reinstatement of drug seeking, but did not have an effect on analgesia (Land et al., 2009). This suggested a potential role of KOR-dependent p38 MAPK activation in regulating some of the negative side effects of KOR activation, but did not explain the analgesic effects (Fig. 1.2). These results are consistent with the blocking effects of pertussis toxin on KOR-induced analgesia (Goicoechea et al., 1999; Gullapalli and Ramarao, 2002), and a recent study showed that a KOR selective G protein biased ligand induces analgesia (Zhou et al., 2013). This initial evidence suggests that KOR-selective G protein biased ligands might have potential as analgesics that do not induce unwanted side effects. However, the effects of KOR biased ligands on dysphoria, stress, anhedonia, sedation, and cognition are unknown.
11
Adapted from (Vardy and Roth, 2013)
12
13
CHAPTER 2: IDENTIFICATION OF NOVEL FUNCTIONALLY SELECTIVE KAPPA OPIOID RECEPTOR SCAFFOLDS1
2.1 INTRODUCTION AND RATIONALE
The kappa opioid receptor (KOR)-dynorphin system has been implicated in the pathogenesis and pathophysiology of affective disorders, drug addiction, and psychotic disorders (Bruchas and Chavkin, 2010; Sheffler and Roth, 2003). KOR and dynorphin are highly expressed in regions of the brain implicated in the modulation of reward, mood, cognition and perception (ventral tegmental area, nucleus accumbens, prefrontal cortex, hippocampus, striatum, amygdala, and hypothalamus) (Knoll and Carlezon, 2009; Land et al., 2008; Schwarzer, 2009; Tejeda et al., 2012). Accordingly, drugs directed at KOR as antagonists or partial agonists have potential utility for a number of indications--especially as antidepressants and anxiolytics (Carlezon et al., 2009). Additionally, KOR agonists are gaining attention as potential analgesics without a high abuse potential (Prevatt-Smith et al., 2011; Tao et al., 2008; Wee and Koob, 2010). However, the adverse effects produced by many centrally-active KOR agonists, including sedation, dysphoria, and hallucinations, have limited their clinical development (Pfeiffer et al., 1986). Dysphoria has been considered the best surrogate marker of KOR agonism, while the
1 This chapter, except Fig. 2.3, was previously published in Molecular Pharmacology. The original citation is as follows:
14
hallucinogenic effects of KOR agonists have been relatively unexplored, except in the case of sal A (Roth et al., 2002; White and Roth, 2012).
KOR stimulation leads to the activation of the canonical Gαi signaling cascade, the recruitment of β-arrestin and activation of p38 MAPK and an array of other downstream effectors (Appleyard et al., 1997; Bruchas et al., 2006; Land et al., 2009). It has been hypothesized that the dysphoric effects of KOR agonism are mediated through the arrestin-dependent activation of p38 MAPK, while the analgesic effects of KOR agonism are mediated only through G protein signaling (Bruchas et al., 2007a). This suggests the potential for functionally selective ligands of KOR as analgesics devoid of dysphoric effects. Ligands that differentially stimulate canonical and non-canonical transduction pathways are considered to be “functionally selective” (Urban et al., 2007), and their differential engagement in signaling is referred to as ‘biased’. Identifying functionally selective KOR agonists with extreme signaling bias will be useful for determining which signal transduction pathways are important for therapeutic efficacy and which signaling cascades contribute to the side effects (Allen et al., 2011). Due to the diverse structure of KOR ligands, there is the potential to discover a variety of functionally selective ligands that can be used to probe KOR signaling, as well as to improve KOR-based therapeutics. The goal of this study was to identify a range of chemotypes of functionally selective KOR ligands using a parallel in vitro screening approach accompanied by in silico selection.
15
addiction and drug seeking, mood disorders, and the stress response (Bruchas and Chavkin, 2010). The benzomorphans, such as bremazocine, have limited KOR selectivity but show strong analgesic effects. However, despite their low dependence potential, they were removed from clinical development due to psychotomimetic and dysphoric effects (Dortch-Carnes and Potter, 2005). It was originally thought that the negative side effects of KOR agonists were due to off-target effects and a new class of selective KOR agonists—the arylacetamide derivatives such as U69593—was developed to circumvent these potential shortcomings. However, some arylacetamides are also reported to produce hallucinations and aversion (Millan, 1990). The diterpenes, represented by sal A (which is the main psychoactive compound in S. divinorum), represent a novel scaffold of highly potent and selective KOR agonists with no appreciable affinity for any other known neurotransmitter system or receptor (Roth et al., 2002).
16 2.2 METHODS
Drugs
The National Institutes of Health Clinical Collection (NCC) library used here is a publicly available library consisting of Food and Drug Administration–approved drugs we have previously used to identify biologically active drugs (Huang et al., 2011; Huang et al., 2009). The synthesis of the RB family of salvinorin derivatives used here has been previously described: chlorosalvinorin A (RB 48), thiocyanatosalvinorin A (RB 64), 22-bromosalvinorin A (RB 50), (22R,S)-22-chloro-22-methylsalvinorin A (RB-55), (22S)-22-chloro-22-methylsalvinorin A (RB 55-1), (22R)-22-(22S)-22-chloro-22-methylsalvinorin A (RB-55-2), 22-cyanosalvinorin A (RB 59), and 22-methoxysalvinorin A (RB 65). (Yan et al., 2009) Sal A was isolated from dried leaves of Salvia divinorum purified as previously reported (Kutrzeba, 2009) and hydrolyzed to salvinorin B, which was a starting material for the synthesis of all analogs.
Dynorphin 1-13, Dynorphin 1-11, Dynorphin 1-9, Dynorphin 1-8 are all obtained from NIDA drug supply program. (+)-(5α,7α,8β)-N-Methyl-N-[7-(1-pyrrolidinyl)-1-oxaspiro[4.5]dec-8-yl]-benzeneacetamide (U69693), (±)-(5α,7α,8β)-3,4-dichloro-N-methyl-N-[7-(1-pyrrolidinyl)-1-oxaspiro[4.5]dec-8-yl]benzeneacetamide mesylate salt (Spiradoline, U62066), 17-cyclopropylmethyl-6,7-dehydro-4,5-epoxy-3,14-dihydroxy-6,7,2',3'-indolomorphinan
2-(3,4-17
dichlorophenyl)-N-methyl-N-[(1S)-1-phenyl-2-(1-pyrrolidinyl)ethyl]acetamide hydrochloride
(ICI199,441),
trans-(-)-3,4-dichloro-N-methyl-N-[2-(1-pyrrolidinyl)cyclohexyl]benzeneacetamide hydrochloride ((-)-U50,488), trans-(+)-3,4-dichloro-N-methyl-N-[(1-pyrrolidinyl)-cyclohexyl]benzeneacetamide hydrochloride ((+)-U50,488), 2-
(3,4-dichlorophenyl)-N-methyl-N-[(1S)-1-(3-isothiocyanatophenyl)-2-(1-pyrrolidinyl)-ethyl]acetamide hydrochloride (DIPPA), (±)-1-(3,4-dichlorophenyl)acetyl-2-(1-pyrrolidinyl)methylpiperidine hydrochloride (BRL 52537), N-methyl-N-[(1S)-1-phenyl-2-(1-pyrrolidinyl)ethyl]phenylacetamide hydrochloride (N-MPPP), (RS)-[3-[1-[[(3,4-dichlorophenyl)acetyl]methylamino]-2-(1-pyrrolidinyl)ethyl]phenoxy]acetic acid hydrochloride (ICI 204,448), and Dynorphin A were purchased from Tocris. 3-(Cyclopropylmethyl)-6,11-dimethyl-1,2,3,4,5,6-hexahydro-2,6-methano-3-benzazocin-8-ol (Cyclazocine) and (5α,7α)-17-(cyclopropylmethyl)- 4,5-epoxy-18,19-dihydro-3-hydroxy-6-methoxy-α,α-dimethyl-6,14-ethenomorphinan-7-methanol (Diprenorphine) were acquired from the NIDA drug supply program.
The synthesis of N-naphthoyl-beta-naltrexamine (β-NNTA), 6'-guanidino-17-(cyclopropylmethyl)-6,7-didehydro-4,5α-epoxy-3,14-dihydroxyindolo[2',3':6,7]morphinan (6'-GNTI), and 5'-Guanidino-17-(cyclopropylmethyl)-6,7-didehydro-4,5α-epoxy-3,14-dihydroxyindolo[2',3':6,7]morphinan (5'-GNTI) as previously described (White et al., 2014).
Measurement of G protein activation
18
at the NIMH Psychoactive Drug Screening Program site
(http://pdsp.med.unc.edu/PDSP%20Protocols%20II%202013-03-28.pdf). In brief, HEK cells were transfected with the biosensor and KOR at a 1:1 ratio. The next day, the cells were plated into Greiner white 384-well plates (catalog # 655098). The cells were incubated with the test compound for 20-30 minutes before addition of the GloSensorTM reagent (luciferin) and isoproterenol (Allen et al., 2011). Luminescence is quantified 10 minutes after the addition of GloSensorTM reagent and isoproterenol. The Z’ score for this assay using sal A is 0.89 (Zhang et al., 2000).
Measurement of arrestin recruitment
Two assays were used to assess β-arrestin translocation: the Tango assay as described previously (Barnea et al., 2008; Wu et al., 2012) and a bioluminescence resonance energy transfer (BRET)-based assay as an orthologous confirmatory assay as described previously (Rives et al., 2012). The Tango assay requires the fusion of a transcription factor to the C-terminus of KOR via linker that contains a TEV protease cleavage site. Activation of KOR leads to the recruitment of β-arrestin 2 fused with TEV protease, which releases the transcription factor, making it available for induction of luciferase expression. The BRET assay requires co-transfection of KOR fused with renilla luciferase, venus tagged β-arrestin 2, and GRK 2 and the cells were distributed on 96-well plates one day prior to assay. The Z’ scores using sal A are 0.716 and 0.95 for the Tango assay and the BRET assay, respectively.
Virtual screening for biased ligands
19
Shoichet, 2005; Irwin et al., 2012). Compounds identified were purchased and screened as described above.
Quantifying Bias
We used the method developed by Kenakin and Christopolous to quantify the biased signaling of ligands (Kenakin and Christopoulos, 2013; Kenakin et al., 2012). After generating concentration-response curves, we fit the data to a mathematical model based on the Black and Leff Operational model to generate log(/KA) values. The log(/KA) value is a transduction coefficient that represents the affinity and efficacy of a ligand for a specific signaling pathway, in this case either G protein activation or arrestin mobilization. This model also incorporates the receptor density and coupling within a system, and therefore is receptor expression independent. The log(/KA) of each test ligand is then compared to the log(/KA) of a reference ligand, in this case sal A, for both G protein activation and arrestin recruitment. Sal A was chosen as the reference ligand because it has very similar EC50 values for both the G protein and arrestin
20 2.3 RESULTS
2.3.1 In Parallel Screening
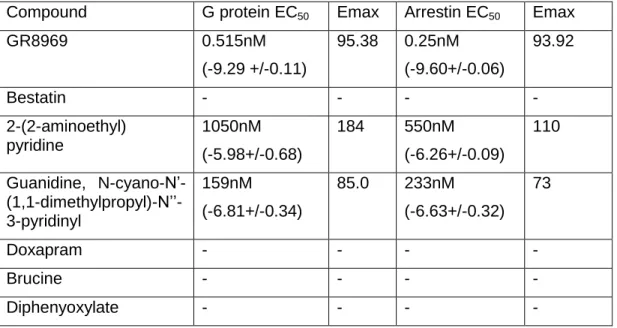
To identify KOR ligands with signaling bias, we screened in parallel the NCC library of approved medications at a concentration of 3 μM using a split luciferase cAMP assay (GloSensor) and a genetically encoded arrestin recruitment assay (Tango). Seven “actives” from this screen were further analyzed by full concentration-response studies (Figure 2.1 and Table 2.1). GR89696 was the only compound from the NCC library identified as a potent biased ligand for KOR (Table 2.1). The concentration-response analyses of “actives” from the NCC library screen yielded two low-potency agonists: 2-(2-aminoethyl)-pyridine and N-cyano-N9-(1,1-dimethylpropyl)-N99-3-pyridinylguanidine. Because few compounds in this library were known or predicted to bind to KOR, we continued our screening efforts with scaffolds known to have affinity for KOR. We focused on screening scaffold derivatives of arylacetamides, dynorphins, morphinans, benzomorphans, and salvinorins. Tables 2.2–2.6 depict the potencies and efficacies of these ligands for G protein activation and arrestin mobilization (Tango) as well as the calculated bias factors.
2.3.2 Functional Analysis and Bias Factor Quantification
21
(bias factors 2 for each compound). In contrast, U62066 and (+)-U50,488 are slightly G protein– biased (bias factors 6 and 8, respectively). Lastly, we found that U69593, DIPPA, N-MPPP, and BRL 52537 are all unbiased agonists.
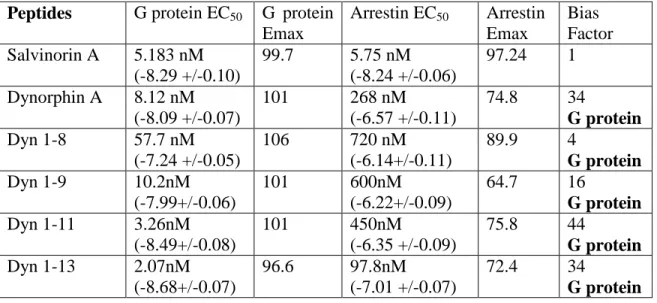
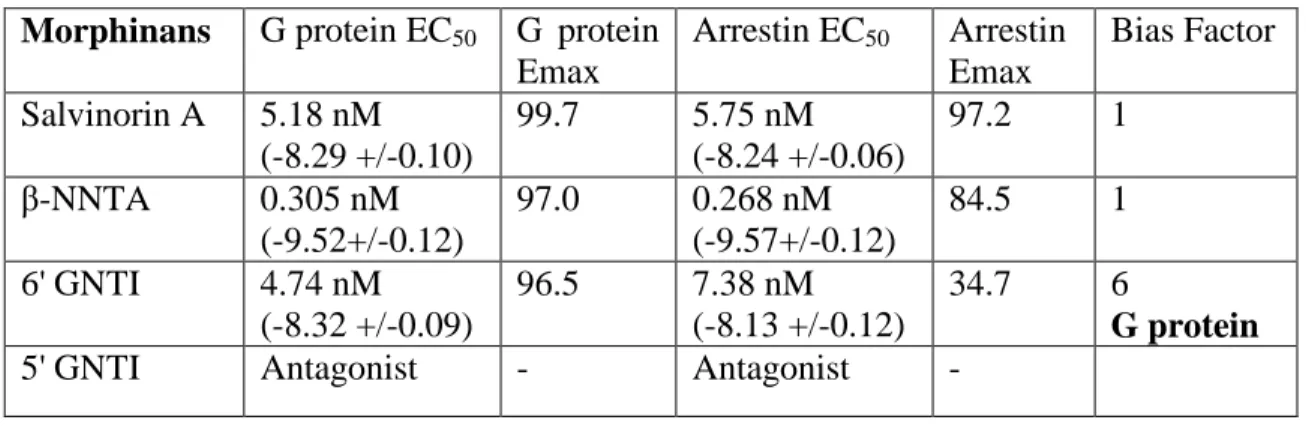
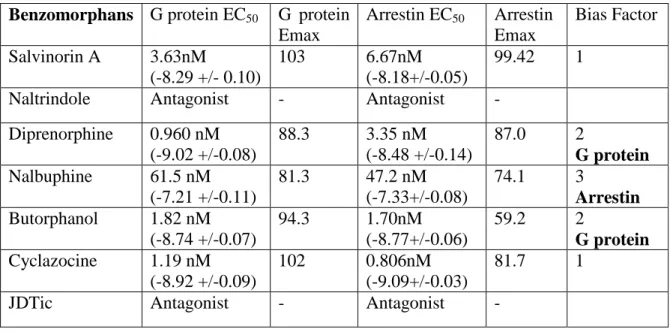
The dynorphin peptides tested displayed varying degrees of G protein bias (Table 2.3). Dyn A, Dyn 13, and Dyn 1-11 have the highest degree of bias (34, 34, and 44, respectively), while Dyn 1–8 and Dyn 1–9 are more moderately biased (4 and 16, respectively). This represents the first report of endogenous KOR ligands having a biased signaling profile relative to sal A, which equally stimulates G protein and arrestin pathways. Furthermore, the morphinans (Table 2.4) and benzomorphans (Table 2.5) tested displayed very little bias. Only 6’-GNTI displayed a slight G protein bias (bias factor of 6), consistent with previous studies (Rives et al., 2012; Schmid et al., 2013). Also, we found that the antagonist JDTic has no agonist activity in either G protein or arrestin assays (Table 2.5).
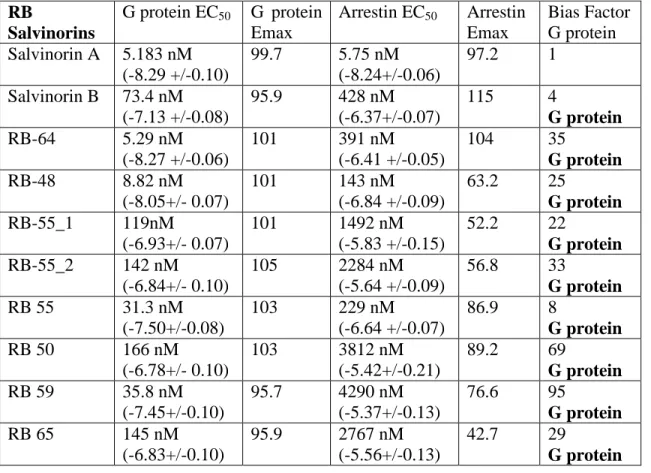
Additionally, we tested several C-2–modified salvinorin derivatives and found them to display a wide range of G protein bias (Table 2.6). Of this family, RB 64 and RB 48 are the most potent in activating G protein signaling and have a high degree of bias (35 and 25, respectively). RB 59, RB 55-2, and RB 50 also have high G protein bias factors (95, 33, and 69, respectively). RB 55-1 and RB 65 are lower potency ligands but still have a strong bias (bias factors 22 and 29, respectively). RB 55 has a slight bias factor of 8, while salvinorin B, a metabolite of sal A, has a bias factor of 4.
22
compound by showing the response in the arrestin recruitment assay as a function of the corresponding response in the G protein activation assay (Fig. 2.2C). Thus, ICI 199,441 and GR89696 are arrestin biased, whereas RB 64 and RB 48 are G protein biased.
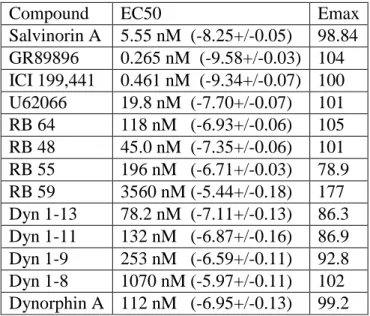
2.3.3 Orthologous Arrestin Recruitment Assay
To confirm our results from the Tango arrestin recruitment assay, we used a BRET-based arrestin-recruitment assay (Rives et al., 2012) to further analyze the compounds displaying the highest degree of bias. Sal A displayed very similar potency values for the Tango and BRET assays (5.56 and 5.63 nM, respectively) (Tables 2.2 and 2.7). Also, the potencies of GR89696 and ICI 199,441 were very similar, based on comparison of results obtained from the Tango and BRET arrestin assays. U62066 has a slightly higher potency in the BRET assay compared with the Tango assay (19.8 and 6.21 nM, respectively). This shift in potency has a modest effect on the bias factor calculated with the BRET data as compared with the Tango data, but both assays suggest a slight G protein bias for U62066 (Table 2.8). Furthermore, RB 64, RB 48, RB 59, RB 55, Dyn 1–13, Dyn 1–9, Dyn 1–11, and Dyn A all have slightly higher potencies in the BRET arrestin assay than the Tango assay, while Dyn 1–8 has a slightly more potent effect in Tango than BRET.
23 2.4 CONCLUSIONS
Recent structural evidence suggests that G protein-coupled receptors (GPCRs) adopt multiple conformations and that different ligands can stabilize distinct conformations leading to diverse signaling profiles (Kenakin, 1995; Liu et al., 2012; Nygaard et al., 2013; Vardy and Roth, 2013; Wacker et al., 2013). Additionally, signaling partners including arrestins (Gray et al., 2003) and G proteins (Nygaard et al., 2013; Yan et al., 2008) can allosterically modulate agonist affinities and overall receptor conformations. This bidirectional modulation from both the ligand and the intracellular effector might affect its signaling.
24
hallucinations will provide insight into how KOR activation affects cognition. Therefore, the first step in understanding the diverse KOR behavioral effects is to identify a range of functionally selective ligands that are potent and selective for KOR. In this study, we identify multiple centrally active KOR-selective biased ligands (RB 64, RB 48, ICI 199,441, and GR89696) that have the potential for probing KOR signaling pathways in vivo (Fig 2.2C) (Ravert et al., 2002; Terner et al., 2005; Yan et al., 2008). Fig. 2.3 is a plot of relative efficacy vs log bias of each ligand tested to show full the range of signaling effects identified and ideally one would test a ligand from each quadrant in vivo.
Significantly, an unbiased screen of small library of known drugs yielded only a single KOR biased ligand (GR89696), although it is possible that larger screens encompassing greater chemical diversity could yield additional scaffolds. Intriguingly, when we focused our investigation on analogues of known KOR ligands, we were able to rapidly identify additional KOR ligands with varying degrees of bias. This suggests that screening scaffold derivatives is a reliable approach for identifying biased ligands, and mirrors our results reported for D2
arrestin-biased drug discovery (Allen et al., 2011). After identifying a scaffold from the NCC screen, for instance, we tested compounds that were similar in structure to the initial arylacetamide hit. Additionally, we performed a similarity search using the ZINC database and found an additional biased ligand possessing the arylacetamide scaffold (ICI 204,448). We found arylacetamide ligands to be either weakly G protein or arrestin biased.
25
needed to investigate how those ligands interact with the receptor and potentially identify residues mediating the signaling bias observed. The RB family of compounds constitute the first identified KOR G protein biased ligands that are centrally active and can therefore be used for in vivo probing of KOR mediated G protein signaling (Yan et al., 2009).
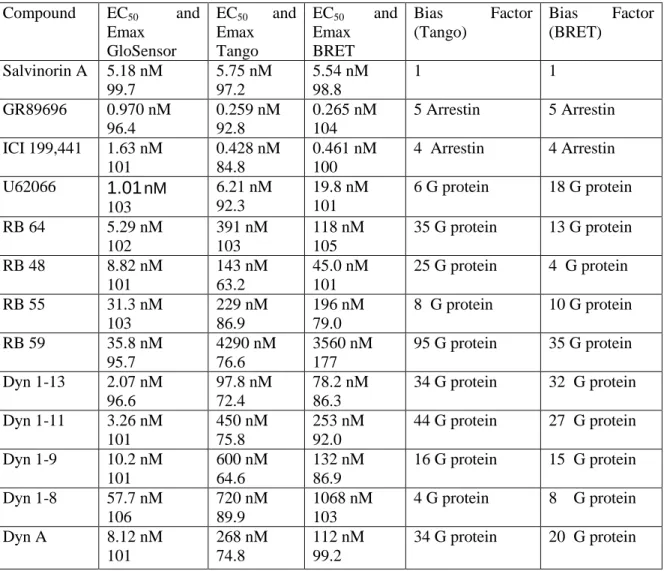
To further investigate our biased ligands, we tested arrestin recruitment in an orthologous assay using bioluminescence resonance energy transfer (BRET). In general, ligands tested in the BRET assay displayed similar potencies and efficacies when compared with results obtained with the Tango assay. RB 48 and RB 59, by contrast, possess the largest differences in bias factors quantified using Tango vs. BRET assays. Notably, the incubation time is much longer for the Tango assay (16hrs) and proteolysis of the transcription factor, entry into the nucleus, transcription and translation are required downstream of arrestin recruitment whereas only arrestin recruitment is assayed in the BRET assay (5 min). However, all ligands that we originally found to be biased using the Tango assay were also found to be biased using the BRET assay. Thus, we can infer that these compounds are functionally selective ligands for KOR –at least in HEK cells.
26
Nonetheless, using a similar strategy, we have been able to successfully advance arrestin-biased D2 agonists to in vivo testing and demonstrate that they retain substantial apparent bias in vivo (Allen et al., 2011; Chen et al., 2012).
Finally, the phenomenon of GPCR functional selectivity is not limited to arrestin mobilization and G protein activation. For example, we have identified 5-HT2A inverse agonists
27
Table 2.1: Concentration response curves of compounds identified as “actives” from the NCC library screen
Compound G protein EC50 Emax Arrestin EC50 Emax
GR8969 0.515nM
(-9.29 +/-0.11)
95.38 0.25nM
(-9.60+/-0.06)
93.92
Bestatin - - - -
2-(2-aminoethyl) pyridine
1050nM
(-5.98+/-0.68)
184 550nM
(-6.26+/-0.09)
110
Guanidine, N-cyano-N’- (1,1-dimethylpropyl)-N’’-3-pyridinyl
159nM
(-6.81+/-0.34)
85.0 233nM
(-6.63+/-0.32) 73
Doxapram - - - -
Brucine - - - -
Diphenyoxylate - - - -
28
Table 2.2: Affinity and potency values for arylacetamides using GloSensor and Tango
Arylacetamides G protein EC50 G
protein Emax
Arrestin EC50 Arrestin
Emax
Bias Factor Salvinorin A 5.183 nM
(-8.29 +/-0.10)
99.7 5.75 nM (-8.24+/-0.06)
97.2 1
ICI 199,441 1.63 nM (-8.79 +/-0.07)
101 0.428 nM (-9.37+/- 0.05)
84.8 4
Arrestin ICI 204,448 4.22 nM
(-8.38 +/-0.09)
111 3.28nM
(-8.48+/-0.06)
77.4 2
Arrestin
U69593 5.89 nM
(-8.23 +/-0.07)
109 6.42 nM (-8.19 +/-0.09)
89.3 1
GR89696 0.970 nM
(-9.01 +/-0.11)
96.4 0.259 nM (-9.60+/-0.06)
92.8 5
Arrestin
U62066 1.01 nM
(-9.00 +/-0.05)
103 6.21 nM (-8.21 +/-0.10)
92.7 6
G protein (+) U50,488 246 nM
(-6.61 +/-0.12)
102 959 nM
(-6.02 +/-0.08)
92.3 8
G protein (-) U50,488 0.858 nM
(-9.06+/-0.07)
95.5 0.822nM (-9.09+/-0.09)
94.6 2
Arrestin
DIPPA 14.5 nM
(-7.84+/-0.09)
111 8.49 nM (-8.07 +/-0.07)
68.5 1
N-MPPP 4.45 nM
(-8.35 +/-0.09)
109 2.41 nM (-8.62 +/-0.06)
79.7 1
BRL 52537 1.85 nM (-8.73 +/-0.07)
112 1.35 nM (-8.87 +/-0.05)
29
Table 2.3: Affinity and potency values for dynorphin peptides using GloSensor and Tango assays
Peptides G protein EC50 G protein
Emax
Arrestin EC50 Arrestin
Emax
Bias Factor Salvinorin A 5.183 nM
(-8.29 +/-0.10)
99.7 5.75 nM (-8.24 +/-0.06)
97.24 1 Dynorphin A 8.12 nM
(-8.09 +/-0.07)
101 268 nM
(-6.57 +/-0.11)
74.8 34
G protein
Dyn 1-8 57.7 nM
(-7.24 +/-0.05)
106 720 nM
(-6.14+/-0.11)
89.9 4
G protein
Dyn 1-9 10.2nM
(-7.99+/-0.06)
101 600nM
(-6.22+/-0.09)
64.7 16
G protein Dyn 1-11 3.26nM
(-8.49+/-0.08)
101 450nM
(-6.35 +/-0.09)
75.8 44
G protein Dyn 1-13 2.07nM
(-8.68+/-0.07)
96.6 97.8nM (-7.01 +/-0.07)
72.4 34
30
Table 2.4: Affinity and potency values for morphinans using GloSensor and Tango assays Morphinans G protein EC50 G protein
Emax
Arrestin EC50 Arrestin
Emax
Bias Factor Salvinorin A 5.18 nM
(-8.29 +/-0.10)
99.7 5.75 nM (-8.24 +/-0.06)
97.2 1
β-NNTA 0.305 nM
(-9.52+/-0.12)
97.0 0.268 nM (-9.57+/-0.12)
84.5 1
6' GNTI 4.74 nM (-8.32 +/-0.09)
96.5 7.38 nM (-8.13 +/-0.12)
34.7 6
G protein
31
Table 2.5: Affinity and potency values for benzomorphans using GloSensor and Tango assays
Benzomorphans G protein EC50 G protein
Emax
Arrestin EC50 Arrestin
Emax
Bias Factor Salvinorin A 3.63nM
(-8.29 +/- 0.10)
103 6.67nM
(-8.18+/-0.05)
99.42 1
Naltrindole Antagonist - Antagonist -
Diprenorphine 0.960 nM (-9.02 +/-0.08)
88.3 3.35 nM (-8.48 +/-0.14)
87.0 2
G protein Nalbuphine 61.5 nM
(-7.21 +/-0.11)
81.3 47.2 nM (-7.33+/-0.08)
74.1 3
Arrestin Butorphanol 1.82 nM
(-8.74 +/-0.07)
94.3 1.70nM
(-8.77+/-0.06)
59.2 2
G protein Cyclazocine 1.19 nM
(-8.92 +/-0.09)
102 0.806nM
(-9.09+/-0.03)
81.7 1
32
Table 2.6: Affinity and potency values for RB family of salvinorin derivatives using GloSensor and Tango assays
RB
Salvinorins
G protein EC50 G protein
Emax
Arrestin EC50 Arrestin
Emax
Bias Factor G protein Salvinorin A 5.183 nM
(-8.29 +/-0.10)
99.7 5.75 nM (-8.24+/-0.06)
97.2 1
Salvinorin B 73.4 nM (-7.13 +/-0.08)
95.9 428 nM
(-6.37+/-0.07)
115 4
G protein
RB-64 5.29 nM
(-8.27 +/-0.06)
101 391 nM
(-6.41 +/-0.05)
104 35
G protein
RB-48 8.82 nM
(-8.05+/- 0.07)
101 143 nM
(-6.84 +/-0.09)
63.2 25
G protein RB-55_1 119nM
(-6.93+/- 0.07)
101 1492 nM
(-5.83 +/-0.15)
52.2 22
G protein RB-55_2 142 nM
(-6.84+/- 0.10)
105 2284 nM
(-5.64 +/-0.09)
56.8 33
G protein
RB 55 31.3 nM
(-7.50+/-0.08)
103 229 nM
(-6.64 +/-0.07)
86.9 8
G protein
RB 50 166 nM
(-6.78+/- 0.10)
103 3812 nM
(-5.42+/-0.21)
89.2 69
G protein
RB 59 35.8 nM
(-7.45+/-0.10)
95.7 4290 nM
(-5.37+/-0.13)
76.6 95
G protein
RB 65 145 nM
(-6.83+/-0.10)
95.9 2767 nM
(-5.56+/-0.13)
42.7 29
33
Table 2.7. BRET arrestin affinity and potency values
Compound EC50 Emax
34
Table 2.8: Comparison of Bias Factor generated with Tango and BRET assays
Compound EC50 and
Emax GloSensor
EC50 and
Emax Tango
EC50 and
Emax BRET
Bias Factor (Tango)
Bias Factor (BRET)
Salvinorin A 5.18 nM 99.7 5.75 nM 97.2 5.54 nM 98.8 1 1
GR89696 0.970 nM
96.4
0.259 nM 92.8
0.265 nM 104
5 Arrestin 5 Arrestin
ICI 199,441 1.63 nM 101
0.428 nM 84.8
0.461 nM 100
4 Arrestin 4 Arrestin
U62066 1.01 nM
103
6.21 nM 92.3
19.8 nM 101
6 G protein 18 G protein
RB 64 5.29 nM
102
391 nM 103
118 nM 105
35 G protein 13 G protein
RB 48 8.82 nM
101
143 nM 63.2
45.0 nM 101
25 G protein 4 G protein
RB 55 31.3 nM
103
229 nM 86.9
196 nM 79.0
8 G protein 10 G protein
RB 59 35.8 nM
95.7
4290 nM 76.6
3560 nM 177
95 G protein 35 G protein
Dyn 1-13 2.07 nM
96.6
97.8 nM 72.4
78.2 nM 86.3
34 G protein 32 G protein
Dyn 1-11 3.26 nM
101
450 nM 75.8
253 nM 92.0
44 G protein 27 G protein
Dyn 1-9 10.2 nM
101
600 nM 64.6
132 nM 86.9
16 G protein 15 G protein
Dyn 1-8 57.7 nM
106
720 nM 89.9
1068 nM 103
4 G protein 8 G protein
Dyn A 8.12 nM
101
268 nM 74.8
112 nM 99.2
35
Table 2.9: LogTau/KA values for all ligands tested
Drug LogTau/KA
GloSensor
LogTau/KA Tango LogTau/KA BRET Salvinorin A 8.197 +/-0.08 8.175 +/-0.07 8.182 +/-0.04
U69593 8.140 +/-0.08 8.126 +/-0.06
(+) U50488 6.783 +/-0.09 5.873 +/-0.09
U62066 8.979 +/-0.09 8.173 +/-0.08 7.563 +/-0.11
DIPPA 7.838 +/-0.09 7.765 +/-0.09
N-MPPP 8.621 +/-0.09 8.423 +/-0.08
BRL 52537 8.843 +/-0.09 8.702 +/-0.07 ICI 204488 8.025 +/-0.08 8.255 +/-0.12
ICI 199441 8.587 +/-0.07 9.189 +/-0.05 9.188 +/-0.05
GR8969 8.819 +/-0.08 9.492 +/-0.06 9.506 +/-0.05
(-)U50488 8.600 +/-0.09 8.910 +/-0.09 Beta-NNTA 9.395 +/-0.13 9.354 +/-0.09 6' GNTI 8.252 +/-0.08 7.489 +/-0.23 Diprenorphine 8.615 +/-0.11 8.404 +/-0.10 Butorphanol 8.611 +/-0.09 8.249 +/-0.19 Nalbuphine 6.735 +/-0.14 7.240 +/-0.16 Cyclazocine 8.771 +/-0.09 8.804 +/-0.14
RB 48 7.87 +/-0.07 6.44 +/-0.09 7.221 +/-0.06
RB 64 7.94 +/-0.07 6.38+/-0.06 6.824 +/-0.06
RB 50 6.89 +/-0.12 5.03 +/-0.13
RB 65 6.56 +/-0.13 5.08 +/-0.22
RB 59 6.98 +/-0.10 4.97 +/-0.12 5.400 +/-0.70
RB 55-2 6.74 +/-0.08 5.19 +/-0.15
RB 55-1 6.85 +/-0.09 5.49 +/-0.15
RB 55 7.32 +/-0.09 6.42 +/-0.07 6.286 +/-0.14
Salvinorin B 6.89 +/-0.10 6.30 +/-0.05
Dyn 1-13 8.497 +/-0.04 6.94 +/-0.09 6.979 +/-0.16
Dyn 1-9 7.636 +/-0.07 6.415 +/-0.13 6.439 +/-0.12
Dyn 1-11 8.263 +/-0.07 6.594 +/-0.12 6.816 +/-0.22
Dyn 1-8 7.249 +/-0.07 6.574 +/-0.09 6.344 +/-0.14
36
Figure 2.1: Depiction of the parallel screening approach and results of the NCC library screen
37
38
Figure 2.3: Log Relative Max vs Log Bias of tested compounds
This figure summarizes the functional effects of the ligands tested. The best approach for testing biased compounds in vivo is to test a compounds from each quadrant because the ligands in each quadrant are biased via different signaling effects. The cell type specific signaling effect cannot be predicted so testing compounds that cause a variety of biased effects
39
CHAPTER 3: IN VIVO PROBING OF SELECT KAPPA OPIOID RECEPTOR SIGNALING PATHWAYS
3.1 INTRODUCTION AND RATIONALE
In the past decade, the phenomenon of functional selectively has been increasingly explored, providing an additional opportunity for GPCR-targeted therapies with improved safety and fewer side effects (Urban et al., 2007). The term “functional selectivity” or “biased agonism” describes the ability of a ligand to selectively activate a subset of signaling cascades of a particular receptor, as opposed to the activation of all downstream signaling cascades (G proteins, arrestins, and/or kinases for example). Currently, the field is investigating the potential for biased agonist therapies for a wide range of targets and disease states: for example, the angiotensin II receptor (acute heart failure), the μ-opioid receptor (postoperative pain and moderate to severe pain), the δ-opioid receptor (Parkinson’s disease, pain, and depression), and the dopamine D2 receptor (schizophrenia and related disorders). (Allen et al., 2011; DeWire et
al., 2013; Monasky et al., 2013; Pradhan et al., 2011; Whalen et al., 2011) Additionally, recent studies have suggested a potential for biased KOR ligands as analgesics with lower addiction potential and fewer side effects (Bruchas et al., 2007a; Ranganathan et al., 2012; Tao et al., 2008).
40
Pfeiffer et al., 1986; Ranganathan et al., 2012). Stimulation of KOR leads to KOR-dependent p38 MAPK activation in vivo, and this p38 activation mediates KOR-induced aversion in mice, but not analgesia (Bruchas et al., 2007a). This activation of p38 has been hypothesized to be mediated by β-arrestin 2 signaling (Bruchas and Chavkin, 2010), suggesting a therapeutic potential for G protein-biased KOR ligands to produce analgesia free of dysphoria. However, this hypothesis has not been directly tested by examining either β-arrestin 2 KO mice or KOR-selective biased ligands to probe individual KOR signaling pathways in vivo.
To better understand which KOR signaling pathways mediate specific behavioral outputs, we first examined WT and β-arrestin 2 KO mice treated with unbiased KOR agonists to measure well- established KOR-mediated effects, such as analgesia, aversion, deficits in motor coordination, sedation, and anhedonia-like effects. The absence of a normal KOR behavior in β-arrestin 2 KO mice would suggest that β-β-arrestin 2 signaling might mediate that behavior. As an orthologous approach, we tested a G protein-biased, KOR-selective ligand (RB 64) in these behavioral paradigms, along with the KOR-selective unbiased ligands U69593 and sal A ((White et al., 2014); Chapter 2).
41 3.2 METHODS
In Vitro functional analysis of U69593, sal A and RB 64
G protein activation assay was measured by the GloSensor assay (Promega) and arrestin mobilization was measured by Tango assay exactly as described in Chapter 2 except the mouse KOR was used instead of human KOR. Additionally, bias calculations were performed exactly as described in Chapter 2.
Animal Subjects
C57BL/6 mice and KOR KO mice were acquired from The Jackson Laboratory (Bar Harbor, ME), and β-arrestin 2 KO mice were donated by the laboratory of Robert Lefkowitz (Duke University, Durham, NC). Behavioral studies were conducted at the University of North Carolina following the National Institute of Health’s guidelines for care and use of animals and with approved mouse protocols from the Institutional Animal Care and Use Committees. Subjects were age matched, 2- to 8-month-old mice weighing between 22 and 35 g; genotypes were determined by PCR analysis of tail tip digestions. WT and arrestin 2 KO mice from β-arrestin 2 KO heterozygous parents (C57BL/6 background) were used for all behavioral experiments. All mice were given food and water ad libitum.
Drugs
42
Lastly, (+)-(5α,7α,8β)-N-Methyl-N-[7-(1-pyrrolidinyl)-1-oxaspiro[4.5]dec-8-yl]-benzeneacetamide (U69593) was acquired from Sigma (St. Louis, MO). All drugs were administered subcutaneously using 10% Tween-80 as vehicle, unless otherwise stated.
Hotplate Assay
Analgesia-like responses were measured using a hotplate analgesia meter with dimensions of 29.2 x 26.7 cm, with mice restricted to a cylinder 8.9 cm in diameter and 15.2 cm high (IITC Life Sciences, Woodland Hills, CA). Response was measured by recording the latency to lick, flutter, or splay hind paw(s), or an attempt to jump out of the apparatus at 55 °C, with a maximum cutoff time of 30 s. Once a response was observed, or the cutoff time had elapsed, the subject was immediately removed from the hotplate and placed back in its home cage (Balter and Dykstra, 2013). The animals were acclimated to the hotplate, while cool, and a baseline analgesic response time was acquired several hours before drug treatment and testing. The analgesia-like effect was measured 10, 20, and 30 minutes after treatment administration. If animals did not display hind paw lick, splay, or flutter, they were removed from the trial.
Conditioned Place Aversion
43
compartment was recorded. The experiments were conducted in a room used only for animal behavior studies, and no other activity in the room occurred during testing. The three compartments of the chamber can be separated by sliding doors, and the center compartment was 40 cm long, 30 cm deep, 5 cm wide with white walls and plastic floor. The two larger compartments used during training were 40 cm long, 30 cm deep, and 17.5 cm wide. One compartment had white and black vertical stripes with brown, perforated paper strips on the flooring, and the other conditioning chamber had white and black vertical stripes with Diamond Dry bedding (Harlan Laboratories, Indianapolis IN) on the floor.
Pretest (Days 1-3). During this phase, mice were placed in the center compartment and the doors were opened, so both test chambers were accessible. The location of the mice was monitored for 15 minutes during three days of pretest training. Mice were not considered suitable for testing if they did not meet the following criteria during the pretest: they cannot spent more than 25% of the time in the center compartment, they cannot spend less than 25% of the time in one of the conditioning compartments, and/or they cannot spend more time in the center compartment than one of the conditioning compartments (Medvedev et al., 2005).
44
Test Phase (Day 11). After a one day drug washout period, mice were placed in the center chamber and the doors were opened to allow access to all rooms. No drug or vehicle was given on this day, and the location of the mouse was measured for 15 minutes. Data were pooled over the 15 minute testing phase for each mouse, and the CPA result was analyzed for each mouse. The results were recorded as the difference in time spent in the drug-paired compartment on the test day vs pretest day.
Rotarod Performance
Balance and motor coordination were measured on an accelerating rotarod after drug treatment (Ugo-Basile, Stoelting Co., Wood Dale, IL) as previously reported (Huang et al., 2013). Briefly, the rod initially rotated at 3 rpm, gradually increasing to a maximum of 30 rpm over a 5 minute period, which was also the maximum length of the trial. Two days prior to the experiment, mice were trained on the apparatus in 2-3 trials, with a 1 minute break between trials. The latency to fall off the rod was measured by the rotarod timer. Additionally, mice were stopped from testing if they rotated off the top of the rod. On testing days, each mouse first completed a drug-free trial to determine baseline performance before administration of drug. Rotarod performance was assessed 10, 20, and 30 minutes after drug administration.
Novelty Induced Locomotion
45
throughout the entire chamber, and data were collected in 5 minute bins. Mice were given drug or vehicle treatments 15 minutes prior to being placed in the chamber and locomotion was recorded for 1 hour.
Intracranial Self-Stimulation (ICSS)
ICSS is an operant behavioral method in which mice respond for rewarding electrical stimulation of the medial forebrain bundle at the level of the lateral hypothalamus. All ICSS methods were done as previously described (Robinson et al., 2012), using a curve-shift method of ICSS (Carlezon and Chartoff, 2007).
Statistics
46
with the drug treatments dissolved in DMSO vehicle controls to determine potential ceiling effects of the 10% Tween-80 vehicle on 1mg/kg U69593 and 3mg/kg RB64.
Rotarod data were assessed by a two-way RM ANOVA for each treatment condition. The within subject effect of time, the between subject effect of genotype, and the effect of time on genotype were reported. A one-way ANOVA was used to analyze any difference between baseline performances for each genotype. Results are plotted as % baseline performance for each mouse. Novelty induced locomotion data were assessed by a two-way RM ANOVA to determine effect of genotype on locomotion. To determine the effect of treatment on total distance traveled and the effect of treatment on center time one-way ANOVAs was performed. Prior to one-way ANOVA analysis a Bartlett’s test for equal variances was performed. Data which did not satisfy this criteria were log transformed prior to one-way ANOVA analysis, which was only the case for the center time data.
47 3.3 RESULTS
3.3.1 RB 64 Is A G Protein-Biased Ligand At The Mouse KOR
RB 64 was originally identified as a G protein-biased ligand from a screen using the human KOR (White et al., 2014). In an in vitro assay system we showed that RB 64 is also a G protein-biased ligand for the mouse KOR (bias factor = 79), while U69593 is unbiased (bias factor = 3) relative to sal A (Table 1).
3.3.2 KOR-promoted G Protein Signaling Induces Analgesia-like Effects
U69593 had analgesia-like action in both WT mice (F(1,54) = 5.73, p = 0.0277) and
β-arrestin 2 KO mice (F(1,51) = 6.46, p = 0.0211) compared to vehicle treated mice, but there was
no difference in analgesia-like effects between genotypes (F(1,48) = 2.05, p = 0.1719) (Fig. 3.2a).
Additionally, the analgesia induced by U69593 in both WT showed temporal variability (F(3,54) =
8.91, p < 0.0001) and β-arrestin 2 KO mice (F(3,51 )= 7.85, p = 0.0002). Furthermore, there was an
interaction of time and U69593 treatment compared to vehicle treated mice in WT mice (F(3,54) =
11.93, p < 0.0001) and β-arrestin 2 KO mice (F(3,51) = 4.25, p = 0.0093). WT mice showed an
analgesia-like effect at 10 and 20 minutes post U69593 treatment (p < 0.001) and β-arrestin 2 KO mice displayed an analgesia-like effect 10 minutes (p < 0.01) and 20 minutes (p < 0.05) after U69593 treatment.
There was also an analgesia-like effect of 3 mg/kg sal A in WT mice (F(1,63) = 5.10, p =
0.0347), but not β-arrestin 2 KO mice (F(1,69) = 2.08, p = 0.1626). However, there was no
difference in analgesia-like effects between WT and β-arrestin 2 KO mice (F(1,75) = 0.03, p =
48
0.0040) and β-arrestin 2 KO mice (F(3,69) = 5.70, p = 0.0015). Additionally, there was an
interaction of sal A treatment and time for both WT (F(3,63) = 3.51, p = 0.0201) and β-arrestin 2
KO mice (F(3,69) = 3.14, p = 0.0309). The analgesia-like effect of sal A occurred 10 minutes post
treatment for both WT and β-arrestin 2 KO mice (p < 0.01).
RB 64 (3 mg/kg) caused an analgesia-like effect in WT (F(1,57) = 8.53, p = 0.0088) and
β-arrestin 2 KO mice (F(1,48) = 9.25, p = 0.0078), but there was no difference in response between
WT and β-arrestin 2 KO mice (F(1,48) = 0.16, p = 0.6958) (Fig. 3.2c). There was also an effect of
time on analgesia in both WT (F(3,57) = 7.92, p = 0.0002) and β-arrestin 2 KO mice (F(3,48) = 9.68,
p = 0.0001). Furthermore, there was an interaction of time and treatment for both WT (F(3,57) =
5.81, p = 0.0016) and β-arrestin 2 KO mice (F(3,48) = 2.96, p = 0.0417). The analgesia-like effects
of 3 mg/kg RB 64 occurred 20 minutes after treatment (p < 0.001, WT mice; and p < 0.01, β-arrestin 2 KO mice) and 30 minutes after treatment (p < 0.05, for both WT and β-β-arrestin 2 KO mice).
To determine if KOR mediated the analgesia-like effects of drug treatments, KOR KO and WT mice were treated with 1 mg/kg U69593, 3 mg/kg sal A, or 3 mg/kg RB64 (F(5,40) =
4.734, p = 0.0017) (Fig. 3.2d). There was an absence of analgesia-like effects in KOR KO mice for all treatments (p < 0.05). Furthermore, there was no effect of genotype on analgesia-like effects of vehicle treated mice (F(1,48) = 0.37, p = 0.5526) (Fig. 3.2a-c). However, genotype did
affect the baseline performance (F(2,33) = 3.438, p = 0.044) (Fig. 3.2e). β-arrestin 2 KO mice have
49
3.3.3 KOR-Mediated G Protein Signaling Induces Aversion
KOR agonists cause aversion in both WT and β-arrestin 2 KO mice (F(11,78) = 3.241, p =
0.0011) (Fig. 3.3a). In WT mice there was an aversive effect of 1 mg/kg U69593 (p < 0.05), 3 mg/kg sal A (p < 0.01), and 3 mg/kg RB 64 (p < 0.05), but no aversive effect of 1 mg/kg sal A (p > 0.05) and 1 mg/kg RB 64 (p > 0.05). Similarly, in β-arrestin 2 KO mice there was an aversive effect of 1 mg/kg U69593 (p < 0.05), 3 mg/kg sal A (p < 0.05), and 3 mg/kg RB 64 (p < 0.05), but there was no aversive effect of 1 mg/kg sal A (p > 0.05) or 1 mg/kg RB 64 (p > 0.05). Furthermore, there was no difference in aversion effects between WT and β-arrestin 2 KO mice for any of the treatment conditions (vehicle, 1 mg/kg U69593, 1 mg/kg sal A, 3 mg/kg sal A, 1 mg/kg RB 64, or 3 mg/kg RB 64).
To address the potential ceiling effect of the 10% Tween-80 vehicle on drug treatment, we examined the effect of 1 mg/kg U69593 or 3 mg/kg RB 64 dissolved in DMSO, instead of 10% Tween-80. The drugs were microinjected into WT mice using a Hamilton syringe at a volume of 1 ul/mg (Fig. 3.3b). There was no difference in aversion effect between U69593 and RB 64 (t(10) = 1.237, p > 0.2442).
50
was an effect of time on performance (F(2,88) = 49.18, p < 0.0001), but there was no interaction of
time and genotype (F(2,88) = 0.62, p = 0.5397) (Fig. 3.4a). Similarly, 3 mg/kg sal A caused a
stronger deficit in performance in WT mice than β-arrestin 2 KO mice (F(1,96) = 13.69, p <
0.0006), time did effect performance (F(2,96) = 14.06, p < 0.0001), but there was no interaction
between time and genotype (F(2,96) = 2.27, p = 0.1090) (Fig. 3.4b). Furthermore, 3 mg/kg RB 64
had no effect on rotarod performance (Fig 3.4C). After treatment with RB 64, there was no genotype effect on performance (F(1,24)=0.14, p = 0.7124), there was no effect of time on
performance (F(2,24)=0.48, p = 0.6227), and there was no effect of time on genotype (F(2,24) =
1.42, p = 0.2617) (Fig. 3.4c).
To ensure the specificity of drugs, we demonstrated that KOR KO animals show no deficit in rotarod performance when treated with 1 mg/kg U69593 or 3 mg/kg sal A. (Fig. 3.4d). For both drug treatments, all KOR KO animals performed at 100% baseline for all time points tested. Additionally, there was no difference in baseline performance among genotypes (F(2,53) =
0.6736, p = 0.5142) (Fig. 3.4e).