www.atmos-chem-phys.net/16/4897/2016/ doi:10.5194/acp-16-4897-2016
© Author(s) 2016. CC Attribution 3.0 License.
Assessing the impact of anthropogenic pollution on isoprene-derived
secondary organic aerosol formation in PM
2
.
5
collected from the
Birmingham, Alabama, ground site during the 2013 Southern
Oxidant and Aerosol Study
Weruka Rattanavaraha1, Kevin Chu1, Sri Hapsari Budisulistiorini1,a, Matthieu Riva1, Ying-Hsuan Lin1,b, Eric S. Edgerton2, Karsten Baumann2, Stephanie L. Shaw3, Hongyu Guo4, Laura King4, Rodney J. Weber4, Miranda E. Neff5, Elizabeth A. Stone5, John H. Offenberg6, Zhenfa Zhang1, Avram Gold1, and Jason D. Surratt1 1Department of Environmental Sciences and Engineering, Gillings School of Global Public Health, The University of North
Carolina at Chapel Hill, Chapel Hill, NC, USA
2Atmospheric Research & Analysis, Inc., Cary, NC, USA 3Electric Power Research Institute, Palo Alto, CA, USA
4Earth and Atmospheric Science, Georgia Institute of Technology, Atlanta, GA, USA 5Department of Chemistry, University of Iowa, Iowa City, IA, USA
6Human Exposure and Atmospheric Sciences Division, United States Environmental Protection Agency, Research Triangle
Park, NC, USA
anow at: Earth Observatory of Singapore, Nanyang Technological University, Singapore
bnow at: Michigan Society of Fellows, Department of Chemistry, University of Michigan, Ann Arbor, MI, USA Correspondence to: J. D. Surratt ([email protected])
Received: 7 December 2015 – Published in Atmos. Chem. Phys. Discuss.: 19 January 2016 Revised: 2 April 2016 – Accepted: 6 April 2016 – Published: 21 April 2016
Abstract. In the southeastern US, substantial emissions of isoprene from deciduous trees undergo atmospheric oxida-tion to form secondary organic aerosol (SOA) that con-tributes to fine particulate matter (PM2.5). Laboratory studies
have revealed that anthropogenic pollutants, such as sulfur dioxide (SO2), oxides of nitrogen (NOx), and aerosol
acid-ity, can enhance SOA formation from the hydroxyl radical (OH)-initiated oxidation of isoprene; however, the mecha-nisms by which specific pollutants enhance isoprene SOA in ambient PM2.5 remain unclear. As one aspect of an
in-vestigation to examine how anthropogenic pollutants influ-ence isoprene-derived SOA formation, high-volume PM2.5
filter samples were collected at the Birmingham, Alabama (BHM), ground site during the 2013 Southern Oxidant and Aerosol Study (SOAS). Sample extracts were analyzed by gas chromatography–electron ionization-mass spectrometry (GC/EI-MS) with prior trimethylsilylation and ultra perfor-mance liquid chromatography coupled to electrospray ion-ization high-resolution quadrupole time-of-flight mass
spec-trometry (UPLC/ESI-HR-QTOFMS) to identify known iso-prene SOA tracers. Tracers quantified using both surrogate and authentic standards were compared with collocated gas-and particle-phase data as well as meteorological data pro-vided by the Southeastern Aerosol Research and Character-ization (SEARCH) network to assess the impact of anthro-pogenic pollution on isoprene-derived SOA formation. Re-sults of this study reveal that isoprene-derived SOA trac-ers contribute a substantial mass fraction of organic matter (OM) (∼7 to∼20 %). Isoprene-derived SOA tracers corre-lated with sulfate (SO24−)(r2=0.34,n=117) but not with NOx. Moderate correlations between methacrylic acid
epox-ide and hydroxymethyl-methyl-α-lactone (together abbrevi-ated MAE/HMML)-derived SOA tracers with nitrate radical production (P[NO3]) (r2=0.57,n=40) were observed
dur-ing nighttime, suggestdur-ing a potential role of the NO3
radi-cal in forming this SOA type. However, the nighttime cor-relation of these tracers with nitrogen dioxide (NO2)(r2=
with MAE/HMML-derived tracers (r2=0.72, n=30) and moderately with 2-methyltetrols (r2=0.34,n=15) during daytime only, suggesting that a fraction of SOA formation could occur from isoprene ozonolysis in urban areas. No correlation was observed between aerosol pH and isoprene-derived SOA. Lack of correlation between aerosol acidity and isoprene-derived SOA is consistent with the observation that acidity is not a limiting factor for isoprene SOA for-mation at the BHM site as aerosols were acidic enough to promote multiphase chemistry of isoprene-derived epoxides throughout the duration of the study. All in all, these results confirm previous studies suggesting that anthropogenic pol-lutants enhance isoprene-derived SOA formation.
1 Introduction
Fine particulate matter, suspensions of liquid or solid aerosol in a gaseous medium that are less than or equal to 2.5 µm in diameter (PM2.5), play a key role in physical and
chem-ical atmospheric processes. They influence climate patterns both directly, through the absorption and scattering of solar and terrestrial radiation, and indirectly, through cloud forma-tion (Kanakidou et al., 2005). In addiforma-tion to climatic effects, PM2.5 has been demonstrated to pose a human health risk
through inhalation exposure (Pope and Dockery, 2006; Hal-lquist et al., 2009). Despite the strong association of PM2.5
with climate change and environmental health, there remains a need to more fully resolve its composition, sources, and chemical formation processes in order to develop effective control strategies to address potential hazards in a cost-effective manner (Hallquist et al., 2009; Boucher et al., 2013; Noziére et al., 2015).
Atmospheric PM2.5 is comprised in a large part (up to
90 % by mass in some locations) of organic matter (OM) (Carlton et al., 2009; Hallquist et al., 2009). OM can be de-rived from many sources. Primary organic aerosol (POA) is emitted from both natural (e.g., fungal spores, vegeta-tion, vegetative detritus) and anthropogenic sources (fossil fuel and biomass burning) prior to atmospheric processing. As a result of large anthropogenic sources, POA is abun-dant largely in urban areas. Processes such as natural plant growth, biomass burning, and combustion also yield volatile organic compounds (VOCs), which have high vapor pres-sures and can undergo atmospheric oxidation to form sec-ondary organic aerosol (SOA) through gas-to-particle phase partitioning (condensation or nucleation) with subsequent particle-phase (multiphase) chemical reactions (Grieshop et al., 2009).
With around 600 Tg emitted into the atmosphere per year, isoprene (2-methyl-1,3-butadiene, C5H8)is the most
abun-dant volatile non-methane hydrocarbon (Guenther et al., 2012). The abundance of isoprene is particularly high in the southeastern US due to emissions from broadleaf deciduous
tree species (Guenther et al., 2006). Research over the last decade has revealed that isoprene, via hydroxyl radical (OH)-initiated oxidation, is a major source of SOA (Claeys et al., 2004; Edney et al., 2005; Kroll et al., 2005, 2006; Surratt et al., 2006, 2010; Lin et al., 2012, 2013a). In addition, it is known that SOA formation is enhanced by anthropogenic emissions, namely oxides of nitrogen (NOx)and sulfur
diox-ide (SO2), that are a source of acidic aerosol onto which
photochemical oxidation products of isoprene are reactively taken up to yield a variety of SOA products (Edney et al., 2005; Kroll et al., 2006; Surratt et al., 2006, 2007b, 2010; Lin et al., 2013b).
Recent work has begun to elucidate some of the critical intermediates of isoprene oxidation that lead to SOA forma-tion through acid-catalyzed heterogeneous chemistry (Kroll et al., 2005; Surratt et al., 2006). Under low-NOx
condi-tions, such as in a pristine environment, multiple isomers of isoprene epoxydiols (IEPOX) have been demonstrated to be critical to the formation of isoprene SOA (Paulot et al., 2009). On advection of IEPOX to an urban environment and mixing with anthropogenic emissions of acidic sulfate aerosol, SOA formation is enhanced (Surratt et al., 2006; Lin et al., 2012, 2013b). This pathway has been shown to yield 2-methyltetrols as major SOA constituents of ambi-ent PM2.5 (Claeys et al., 2004; Surratt et al., 2010; Lin et
al., 2012). Further work has revealed a number of addi-tional IEPOX-derived SOA tracers, including C5-alkene
tri-ols (Wang et al., 2005; Lin et al., 2012), cis- and trans-3-methyltetrahydrofuran-3,4-diols (3-MeTHF-3,4-diols) (Lin et al., 2012; Zhang et al., 2012), IEPOX-derived organosul-fates (OSs) (Lin et al., 2012), and IEPOX-derived oligomers (Lin et al., 2014). Some of the IEPOX-derived oligomers have been shown to contribute to aerosol components known as brown carbon that absorb light in the near ultraviolet (UV) and visible ranges (Lin et al., 2014). Under high-NOx
con-ditions, such as encountered in an urban environment, iso-prene is oxidized to methacrolein (MACR) and SOA for-mation occurs via the further oxidation of MACR (Kroll et al., 2006; Surratt et al., 2006) to methacryloyl perox-ynitrate (MPAN) (Chan et al., 2010; Surratt et al., 2010; Nguyen et al., 2015). It has recently been shown that when MPAN is oxidized by OH it yields at least two SOA precur-sors, methacrylic acid epoxide (MAE) and hydroxymethyl-methyl-α-lactone (HMML) (Surratt et al., 2006, 2010; Lin et al., 2013a; Nguyen et al., 2015). Whether SOA precursors are formed under high- or low-NOxconditions, aerosol
glyoxal-, methylglyoxal-, and hydroxyacetone-derived OS mass concentrations in the atmosphere remains unclear since these SOA tracers can also be formed from a wide variety of biogenic and anthropogenic precursors (Galloway et al., 2009; Liao et al., 2015).
Due to the large emissions of isoprene, an SOA yield of even 1 % would contribute significantly to ambient SOA (Carlton et al., 2009; Henze et al., 2009). This conclusion is supported by measurements showing that up to a third of total fine organic aerosol (OA) mass can be attributed to IEPOX-derived SOA tracers in Atlanta, GA (JST), dur-ing summer months (Budisulistiorini et al., 2013, 2015). A recent study in Yorkville, GA (YRK), similarly found that IEPOX-derived SOA tracers comprised 12–19 % of the fine OA mass (Lin et al., 2013b). Another Southern Oxidant and Aerosol Study (SOAS) site at Centreville, Alabama (CTR), revealed that IEPOX–SOA contributed 18 % of total OA mass (Xu et al., 2015). The individual ground sites corrob-orate recent aircraft-based measurements made in the Stud-ies of Emissions and Atmospheric Composition, Clouds, and Climate Coupling by Regional Surveys (SEAC4RS) aircraft campaign, which estimated an IEPOX–SOA contribution of 32 % to OA mass in the southeastern US (Hu et al., 2015).
It is clear from the field studies discussed above that particle-phase chemistry of isoprene-derived oxidation prod-ucts plays a large role in atmospheric SOA formation. How-ever, much remains unknown regarding the exact nature of its formation, limiting the ability of models to accu-rately account for isoprene SOA (Carlton et al., 2010b; Fo-ley et al., 2010). Currently, traditional air quality models in the southeastern US do not incorporate detailed particle-phase chemistry of isoprene oxidation products (IEPOX or MAE/HMML) and generally underpredict isoprene SOA for-mation (Carlton et al., 2010a). Recent work demonstrates that incorporating the specific chemistry of isoprene epoxide precursors into models increases the accuracy and number of isoprene SOA predictions (Pye et al., 2013; Karambelas et al., 2014; McNeilll, 2015), suggesting that understanding the formation mechanisms of biogenic SOA, especially with re-gard to the effects of anthropogenic emissions, such as NOx
and SO2, will be key to more accurate models. More
accu-rate models are needed in order to devise cost-effective con-trol strategies for reducing PM2.5 levels. Since isoprene is
primarily biogenic in origin, and therefore not controllable, the key to understanding the public health and environmental implications of isoprene SOA lies in resolving the effects of anthropogenic pollutants.
This study presents results from the 2013 SOAS, where several well-instrumented ground sites dispersed through-out the sthrough-outheastern US made intensive gas- and particle-phase measurements from 1 June to 16 July 2013. The pri-mary purpose of this campaign was to examine, in greater detail, the formation mechanisms, composition, and prop-erties of biogenic SOA, including the effects of anthro-pogenic emissions. This study pertains specifically to the
re-sults from the Birmingham, Alabama (BHM), ground site, where the city’s substantial urban emissions mix with bio-genic emissions from the surrounding rural areas, creating an ideal location to investigate such interactions. The results presented here focus on analysis of PM2.5collected on
fil-ters during the campaign by gas chromatography–electron ionization-mass spectrometry (GC/EI-MS) and ultra perfor-mance liquid chromatography coupled to electrospray ion-ization high-resolution quadrupole time-of-flight mass spec-trometry (UPLC/ESI-HR-QTOFMS). The analysis of PM2.5
was conducted in order to determine quantities of known iso-prene SOA tracers using collocated air quality and meteoro-logical measurements to investigate how anthropogenic pol-lutants including NOx, SO2, aerosol acidity (pH), PM2.5
sul-fate (SO24−), and O3affect isoprene SOA formation. These
results, along with the results presented from similar stud-ies during the 2013 SOAS campaign, seek to elucidate the chemical relationships between anthropogenic emissions and isoprene SOA formation in order to provide better parameter-izations needed to improve the accuracy of air quality models in this region of the US.
2 Methods
2.1 Site description and collocated data
Filter samples were collected in the summer of 2013 as part of the SOAS field campaign at the BHM ground site (33.553◦N, 86.815◦W). In addition to the SOAS campaign, the site is also part of the Southeastern Aerosol Research and Characterization Study (SEARCH) (Fig. S1 of the Supple-ment), an observation and monitoring program initiated in 1998. SEARCH and this site are described elsewhere in de-tail (Hansen et al., 2003; Edgerton et al., 2006). The BHM site is surrounded by significant transportation and industrial sources of PM. West of BHM are US 31 and I-65 highways. To the north, northeast and southwest of BHM several cok-ing ovens and an iron pipe foundry are located (Hansen et al., 2003).
2.2 High-volume filter sampling and analysis methods
2.2.1 High-volume filter sampling
From 1 June to 16 July 2013, PM2.5samples were collected
onto Tissuquartz™Filters (8×10 in., Pall Life Sciences) us-ing high-volume PM2.5samplers (Tisch Environmental)
op-erated at 1 m3min−1 at an ambient temperature described
in detail elsewhere (Budisulistiorini et al., 2015; Riva et al., 2016). All quartz filters were prebaked prior to collection. The procedure consisted of baking filters at 550◦C for 18 h followed by cooling to 25◦C over 12 h.
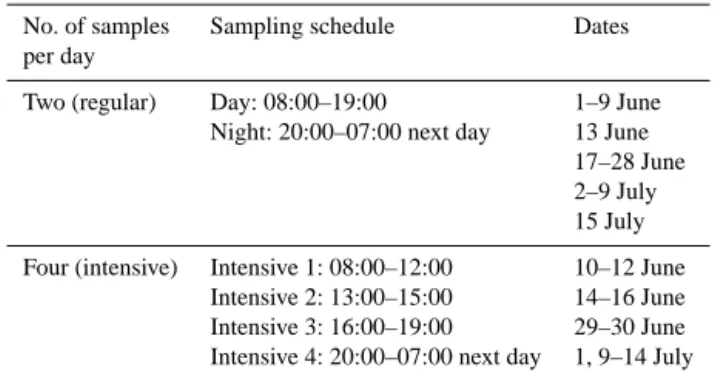
the second at night – each collected for 11 h. On intensive sampling days, four samples were collected, with the single daytime sample being subdivided into three separate peri-ods. The intensive sampling schedule was conducted on days when high levels of isoprene, SO24−and NOx were forecast
by the National Center for Atmospheric Research (NCAR) using the Flexible Particle dispersion model (FLEXPART) (Stohl et al., 2005) and Model for Ozone and Related Chem-ical Tracers (MOZART) (Emmons et al., 2010) simulations. Details of these simulations have been summarized in Bud-isulistiorini et al. (2015); however, these model data were only used qualitatively to determine the sampling schedule. The intensive collection frequency allowed enhanced time resolution for offline analysis to examine the effect of anthro-pogenic emissions on the evolution of isoprene SOA tracers throughout the day.
In total, 120 samples were collected throughout the field campaign with a field blank filter collected every 10 days to identify errors or contamination in sample collection and analysis. All filters were stored at −20◦C in the dark un-til extraction and analysis. In addition to filter sampling of PM2.5, SEARCH provided a suite of additional instruments
at the site that measured meteorological and chemical vari-ables, including temperature, relative humidity (RH), solar radiation (SR), barometric pressure (BP), trace gases (i.e., CO, O3, SO2, NOx, and NH3), and continuous PM
mon-itoring. The exact variables measured with their respective instrumentation are summarized in Table S1 of the Supple-ment.
2.2.2 Isoprene-derived SOA analysis by GC/EI-MS
SOA collected in the field on quartz filters was extracted and isoprene tracers quantified by GC/EI-MS with prior trimethylsilylation. A 37 mm diameter circular punch from each filter was extracted in a pre-cleaned scintillation vial with 20 mL of high-purity methanol (LC-MS CHROMA-SOLV grade, Sigma-Aldrich) by sonication for 45 min. The extracts were filtered through polytetrafluorethylene (PTFE) syringe filters (Pall Life Science, Acrodisc®, 0.2-µm pore size) to remove insoluble particles and resid-ual quartz fibers. The filtrate was then blown dry under a gentle stream of N2 at room temperature. The dried
residues were immediately trimethylsilylated by reaction with 100 µL of N,O-bis(trimethylsilyl)trifluoroacetamide (BSTFA) + trimethylchlorosilane (TMCS) (99:1 v/v, Su-pelco) and 50 µL of pyridine (anhydrous, 99.8 %, Sigma-Aldrich) at 70◦C for 1 h. Trimethylsilyl derivatives of car-bonyl and hydroxyl functional groups were measurable by our GC/EI-MS method. Derivatized samples were analyzed within 24 h after trimethylsilylation using a Hewlett-Packard (HP) 5890 Series II gas chromatograph coupled to an HP 5971A mass selective detector. The gas chromatograph was equipped with an Econo-Cap®-EC®-5 Capillary Column
(30 m × 0.25 mm i.d.; 0.25 µm film thickness) to separate
Table 1. Sampling schedule during SOAS at the BHM ground site.
No. of samples Sampling schedule Dates per day
Two (regular) Day: 08:00–19:00 1–9 June Night: 20:00–07:00 next day 13 June
17–28 June 2–9 July 15 July Four (intensive) Intensive 1: 08:00–12:00 10–12 June
Intensive 2: 13:00–15:00 14–16 June Intensive 3: 16:00–19:00 29–30 June Intensive 4: 20:00–07:00 next day 1, 9–14 July
trimethylsilyl derivatives before MS detection. 1 µL aliquots were injected onto the column. Operating conditions and pro-cedures have been described elsewhere (Surratt et al., 2010). Extraction efficiency was assessed and taken into ac-count for the quantification of all SOA tracers. Efficiency was determined by analyzing four prebaked filters spiked with 50 ppmv of 2-methyltetrols, 2-methylglyceric acid, lev-oglucosan, and cis- and trans-3−MeTHF-3,4-diols. Extrac-tion efficiency was above 90 % and was used to correct the quantification of samples. Extracted ion chromatograms (EICs) ofm/z 262, 219, 231, and 335 were used to quan-tify the cis-/trans-3-MeTHF-3,4-diols, 2-methyltetrols and 2-methylglyceric acid, C5-alkene triols, and IEPOX-dimers,
respectively (Surratt et al., 2006).
2-Methyltetrols were quantified using an authentic refer-ence standard that consisted of a mixture of racemic dias-teroisomers. Similarly, 3-MeTHF-3,4-diol isomers were also quantified using authentic standards; however, 3-MeTHF-3,4-diol isomers were detected in few field samples. 2-Methylglyceric acid was also quantified using an authen-tic standard. Procedures for synthesis of the 2-methyltetrols, 3-MeTHF-3,4-diol isomers, and 2-methylglyceric acid have been described elsewhere (Zhang et al., 2012; Budisulis-tiorini et al., 2015). C5-alkene triols and IEPOX dimers
were quantified using the average response factor of the 2-methyltetrols.
2.2.3 Isoprene-derived SOA analysis by UPLC/ESI-HR-QTOFMS
A 37 mm diameter circular punch from each quartz filter was extracted following the same procedure as described in Sect. 2.2.2 for the GC/EI-MS analysis. However, after drying, the dried residues were reconstituted with 150 µL of a 50:50 (v/v) solvent mixture of methanol (LC-MS CHROMASOVL grade, Sigma-Aldrich) and high-purity wa-ter (Milli-Q, 18.2 M). The extracts were immediately an-alyzed by the UPLC/ESI-HR-QTOFMS (6520 Series, Agi-lent) operated in the negative ion mode. Detailed operating conditions have been described elsewhere (Riva et al., 2016). Mass spectra were acquired at a mass resolution of 7000– 8000.
Extraction efficiency was determined by analyzing three prebaked filters spiked with propyl sulfate and octyl sulfate (electronic grade, City Chemical LLC). Extraction efficien-cies were in the range of 86–95 %. EICs ofm/z215, 333, and 199 were used to quantify the derived OS, IEPOX-derived dimer OS, and the MAE-IEPOX-derived OS, respectively (Surratt et al., 2007a). EICs were generated with a ±5 ppm tolerance. Accurate masses for all measured organosulfates (OSs) were within ±5 ppm. For simplicity, only the nom-inal masses are reported in the text when describing these products. IEPOX-derived OS and IEPOX-derived dimer OS were quantified by the IEPOX-derived standard synthesized in-house (Budisulistiorini et al., 2015). The MAE-derived OS was quantified using an authentic MAE-derived OS stan-dard synthesized in-house by a procedure to be described in a forthcoming publication (1H nuclear magnetic reso-nance (NMR) trace, Fig. S2). Although the MAE-derived OS (Gómez-González et al., 2008), which is more formally called 3-sulfooxy-2-hydroxy-2-methyl propanoic acid, has been chemically verified from the reactive uptake of MAE on wet acidic sulfate aerosol (Lin et al., 2013a), the term MAE/HMML-derived OS will be used hereafter to denote the two potential precursors (MAE and HMML) contribut-ing to this OS derivative as recently discussed by Nguyen et al. (2015). It should be noted that Nguyen et al. (2015) pro-vided indirect evidence for the possible existence of HMML. As a result, further work is needed to synthesize this com-pound to confirm its structure and likely role in SOA forma-tion from isoprene oxidaforma-tion.
EICs of m/z 155, 169, and 139 were used to quan-tify the glyoxal-derived OS, methylglyoxal-derived OS, and the hydroxyacetone-derived OS, respectively (Surratt et al., 2007a). In addition, EICs of m/z 211, 260, and 305 were used to quantify other known isoprene-derived OSs (Surratt et al., 2007a). Glycolic acid sulfate synthesized in-house was used as a standard to quantify the glyoxal-derived OS (Gal-loway et al., 2009), and propyl sulfate was used as a surrogate standard to quantify the remaining isoprene-derived OSs.
2.2.4 OC and WSOC analysis
A 1.5 cm2square punch from each quartz filter was analyzed for total organic carbon (OC) and elemental carbon (EC) by the thermal-optical method (Birch and Cary, 1996) on a Sunset Laboratory OC–EC instrument (Tigard, OR) at the National Exposure Research Laboratory (NERL) at the US Environmental Protection Agency, Research Triangle Park, NC. The details of the instrument and analytical method have been described elsewhere (Birch and Cary, 1996). In addition to the internal calibration using methane gas, four different mass concentrations of sucrose solution were used to verify the accuracy of the instrument during the analysis.
Water-soluble organic carbon (WSOC) was measured in aqueous extracts of quartz fiber filter samples using a total organic carbon (TOC) analyzer (Sievers 5310C, GE Water & Power) equipped with an inorganic carbon remover (Sievers 900). To maintain low background carbon levels, all glass-ware used was washed with water, soaked in 10 % nitric acid, and baked at 500◦C for 5 h and 30 min prior to use. Samples were extracted in batches that consisted of 12–21 PM2.5
sam-ples and field blanks, one laboratory blank, and one spiked solution. A 17.3 cm2filter portion was extracted with 15 mL of purified water (> 18 M, Barnstead Easypure II, Thermo Scientific) by ultra-sonication (Branson 5510). Extracts were then passed through a 0.45 µm PTFE filter to remove insolu-ble particles. The TOC analyzer was calibrated using potas-sium hydrogen phthalate (KHP, Sigma-Aldrich) and was ver-ified daily with sucrose (Sigma-Aldrich). Samples and stan-dards were analyzed in triplicate; the reported values corre-spond to the average of the second and third trials. Spiked solutions yielded recoveries that averaged (±1 standard de-viation) 96±5 % (n=9). All ambient concentrations were field blank subtracted.
2.2.5 Estimation of aerosol pH by ISORROPIA
Aerosol pH was estimated using a thermodynamic model, ISORROPIA-II (Nenes et al., 1998). SO24−, nitrate (NO−3), and ammonium (NH+4) ion concentrations measured in PM2.5 collected from BHM, as well as RH, temperature,
and gas-phase ammonia (NH3)were used as inputs into the
Aerosol pH= −log10aH+= −log10
H+
air
LMASS ×ρaer×1000
, (1)
whereaH+ is H+ activity in the aqueous phase (mol L−1),
LMASS is total liquid-phase aerosol mass (µg m−3), andρ aer
is aerosol density. Details of the ISORROPIA-II model and its ability to predict pH, LWC, and gas-to-particle partition-ing are not the focus of this study and are discussed elsewhere (Fountoukis et al., 2009).
2.2.6 Estimation of nighttime NO3
Nitrate radical (NO3)production (P[NO3]) was calculated
using the following equation:
P[NO3] =k[NO2] [O3], (2)
where [NO2] and [O3] correspond to the measured ambient
NO2and O3concentrations (mol cm−3), respectively, andk
is the temperature-dependent rate constant (Herron and Huie, 1974; Graham and Johnston, 1978). Since no direct measure of NO3radical was made at this site during SOAS, P[NO3]
was used as a proxy for NO3 radicals present in the
atmo-sphere to examine whether there is any association of it with isoprene-derived SOA tracers.
3 Results and discussion
3.1 Overview of the study
The campaign extended from 1 June through 16 July 2013. Temperature during this period ranged from a high of 32.6◦C to a low of 20.5◦C, with an average of 26.4◦C. RH varied from 37–96 % throughout the campaign, with an average of 71.5 %. Rainfall occurred intermittently over 2–3-day peri-ods and averaged 0.1 in. per day. Wind analysis reveals that air masses approached largely from the south-southeast at an average wind speed of 2 m s−1. Summaries of meteorologi-cal conditions as well as wind speed and direction during the course of the campaign are given in Table 2 and illustrated in Figs. 1 and 2.
The average concentration of carbon monoxide (CO), a combustion byproduct, was 208.7 ppbv. The mean concen-tration of O3was significantly higher (t test, p value < 0.05)
on intensive sampling days (37.0 ppbv) compared to regu-lar sampling days (25.2 ppbv). Campaign average concentra-tions of NOx, NH3, and SO2 were 7.8, 1.9, and 0.9 ppbv,
respectively. On average, OC and WSOC levels were 7.2 (n=120) and 4 µg m−3(n=100), respectively. The largest
inorganic component of PM2.5 was SO24−, which averaged
2 µg m−3 with excursions between 0.4 and 4.9 µg m−3 dur-ing the campaign. NH+4 and NO−3 were present at low levels,
Figure 1. Wind rose illustrating wind direction during the campaign
at the BHM site. Bars indicate direction of incoming wind, with 0◦ set to geographic north. Length of bar size indicates frequency with color segments indicating the wind speed in meters per second.
Figure 2. Time series of (a) meteorological data, (b) trace gases, (c) PM2.5constituents, (d) MAE/HMML-derived SOA tracers, and
(e) IEPOX-derived SOA tracers during the 2013 SOAS campaign at
the BHM site.
averaging 0.66 and 0.14 µg m−3, respectively. Time series of gas and PM2.5components are shown in Fig. 2. WSOC
(Bud-isulistiorini et al., 2015; Hu et al., 2015) but consistent with previous observations at the BHM site (Ding et al., 2008). WSOC/OC ratios are commonly lower in urban than ru-ral areas, as a consequence of higher primary OC emissions; thus, PM at BHM probably contains increased OC.
Diurnal variation of meteorological parameters, trace gases, and PM2.5components is shown in Fig. S4 of the
Sup-plement. Temperature dropped during nighttime and reached a maximum in the afternoon (Fig. S4a). Conversely, RH was low during the day and high at night. High NOx
lev-els were found in the early morning and decreased during the course of the day (Fig. S4c), most likely due to the for-mation of NOx sinks (e.g., RONO2, ROONO2, and HNO3)
as well as possibly due to increasing planetary boundary layer (PBL) heights. O3 reached a maximum
concentra-tion between 12:00–15:00 local time due to photochemistry (Fig. S4b). SO2was slightly higher in the morning (Fig. S4c)
but decreased during the day, most likely as a result of PBL dynamics. NH3remained fairly constant throughout the day
(Fig. S4c). No significant diurnal variation was found in the concentration of inorganic PM2.5components, including
SO24−, NO−3, and NH+4 (Fig. S4d). Unfortunately, a measure-ment of isoprene could not be made at BHM during the cam-paign. However, the diurnal trend of isoprene levels might be similar to the data at the CTR site (Xu et al., 2015), which is only 61 miles away from BHM. Xu et al. (2015) observed the highest levels of isoprene (∼6 ppb) at CTR in the mid-afternoon (15:00 local time) and its diurnal trend was simi-lar to isoprene OA measured by the Aerodyne Aerosol Mass Spectrometer (AMS) during the SOAS campaign at the CTR site.
3.2 Characterization of isoprene SOA
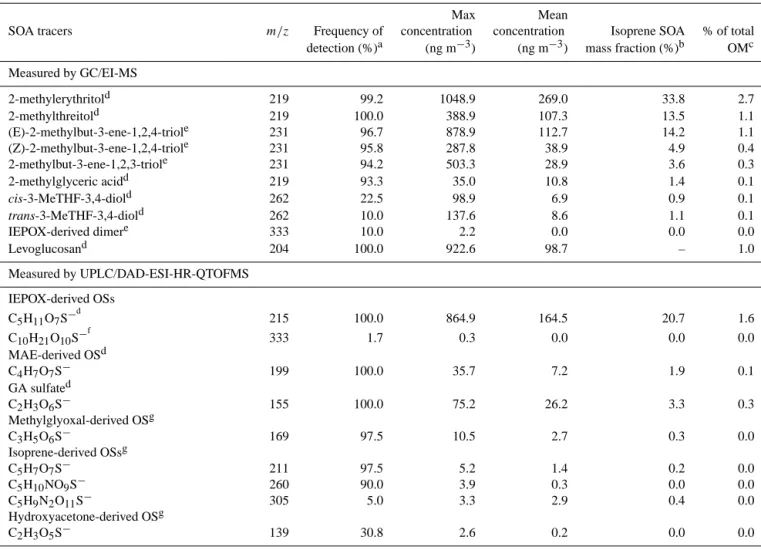
Table 3 summarizes the mean and maximum concen-trations of known isoprene-derived SOA tracers detected by GC/EI-MS and UPLC/ESI-HR-QTOFMS. Levoglucosan was also analyzed as a tracer for biomass burning. Among the isoprene-derived SOA tracers, the highest mean con-centration was for 2-methyltetrols (376 ng m−3), followed by the sum of C5-alkene triols (181 ng m−3) and the
IEPOX-derived OS (165 ng m−3). The concentrations ac-count for 3.8, 1.8, and 1.6 %, respectively, of total OM mass. It is noteworthy that maximum concentrations of 2-methylerythritol (a 2-methyltetrol isomer; 1049 ng m−3), IEPOX-derived OS (865 ng m−3), and
(E)-2-methylbut-3-ene-1,2,4-triol (879 ng m−3)were attained during the
inten-sive sampling period of 16:00–19:00 local time on 15 June 2013, following 5 consecutive days of dry weather (Fig. 2a and d) when high levels of isoprene, SO24−, and NOx were
forecast.
Our investigation for the potential of OS hydroly-sis or decomposition during GC/EI-MS analyhydroly-sis demon-strated that only 1.7 % of methylthreitol and 2.4 % of 2-methylerythritol could be derived from the IEPOX-derived
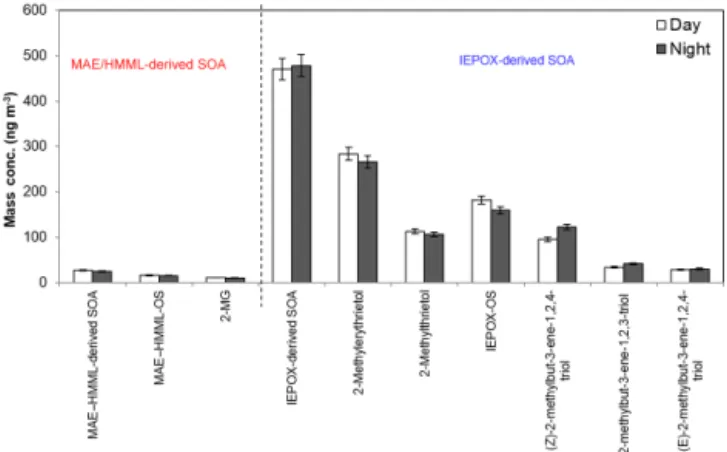
Figure 3. The bar chart shows average daytime and nighttime
con-centrations of isoprene-derived SOA tracers with 95 % confident in-terval. No significant variation between daytime and nighttime was observed.
OSs. In order to accurately estimate the mass concentra-tions of the IEPOX-derived SOA tracers, we took this ef-fect into account. Together, the IEPOX-derived SOA tracers, which represent SOA formation from isoprene oxidation pre-dominantly under the low-NOxpathway, comprised 92.45 %
of the total detected isoprene-derived SOA tracer mass at the BHM site. This contribution is slightly lower than ob-servations reported at rural sites located in Yorkville, GA (97.50 %), and Look Rock, Tennessee (LRK) (97 %) (Lin et al., 2013b; Budisulistiorini et al., 2015).
The sum of MAE/HMML-OS and 2-methylglyceric acid (2-MG), which represent SOA formation from isoprene ox-idation predominantly under the high-NOx pathway,
con-tributed 3.25 % of the total isoprene-derived SOA tracer mass, while the OS derivative of glycolic acid (GA sulfate) contributed 3.3 %. The contribution of GA sulfate was con-sistent with the level of GA sulfate measured by the airborne NOAA Particle Analysis Laser Mass Spectrometer (PALMS) over the continental US during the Deep Convective Clouds and Chemistry Experiment and SEAC4RS (Liao et al., 2015). However, the contribution of GA sulfate to the total OM at BHM (0.3 %) is lower than aircraft-based measurements made by Liao et al. (2015) near the ground in the eastern US (0.9 %). GA sulfate can form from biogenic and anthro-pogenic emissions other than isoprene, including glyoxal, which is thought to be a primary source of GA sulfate (Gal-loway et al., 2009). For this reason, GA sulfate will not be further discussed in this study.
Table 2. Summary of collocated measurements of meteorological variables, gaseous species, and PM2.5constituents.
Category Condition Average SD Minimum Maximum
Meteorology Rainfall (in.) 0.1 0.2 0.0 1.4
Temp (◦C) 26.4 3.0 20.5 32.7
RH (%) 71.5 15.0 36.9 96.1
BP (mbar) 994.2 3.9 984.2 1002.4
SR (W m−2) 303.7 274.5 7.0 885.0
Trace gas (ppbv) O3 31.1 14.8 8.3 62.2
CO 208.7 72.0 99.6 422.9
SO2 0.9 0.8 0.1 3.7
NO 1.3 1.2 0.1 7.0
NO2 6.6 5.1 1.0 22.7
NOx 7.8 6.0 1.3 29.7
NOy 9.1 5.8 2.2 30.4
HNO3 0.3 0.2 0.1 1.0
NH3 1.9 0.8 0.7 4.0
PM2.5(µg m−3) OC 7.2 3.2 1.4 14.9
EC 0.6 0.5 0.1 2.7
WSOC 4.0 1.8 0.5 7.5
SO24− 2.0 0.9 0.4 4.9
NO−3 0.1 0.1 0.0 0.8
NH+4 0.7 0.3 0.2 1.2
Aerosol pH 1.8 0.1 1.6 1.9
USA, including both rural LRK (Budisulistiorini et al., 2015; Hu et al., 2015) and urban Atlanta, GA (Budisulistiorini et al., 2013). The contribution of SOA tracers to OM in the cur-rent study was estimated on the basis of the offline analy-sis of filters, while tracer estimates in the two earlier stud-ies were based on online Aerodyne Aerosol Chemical Spe-ciation Monitor (ACSM)/AMS measurements. The low iso-prene SOA/OM ratio is consistent with the low WSOC/OC ratio reported in Sect. 3.1, suggesting a larger contribution of primary OA or hydrophobic secondary OM originating from anthropogenic emissions to the total OM at BHM. However, it should be noted that total IEPOX-derived SOA mass at BHM may actually be closer to ∼14 % since recent mea-surements by the Aerodyne ACSM at LRK indicated that tracers could only account for ∼50 % of the total IEPOX-derived SOA mass resolved by the ACSM (Budisulistiorini et al., 2015). Unfortunately, an Aerodyne ACSM or AMS was not available at the BHM site to confirm that IEPOX-derived SOA mass at BHM might account for 14 % (on average) of the total OM mass.
Levoglucosan, a biomass-burning tracer, averaged 1 % of total OM with spikes up to 8 %, the same level measured for 2-methylthreitol and (E)-2-methylbut-3-ene-1,2,4-triol (Ta-ble 3). The ratio of average levoglucosan at BHM relative to CTR was 5.4, suggesting significantly more biomass burning impacting the BHM site.
IEPOX- and MAE/HMML-derived SOA tracers ac-counted for 18 and 0.4 % of the WSOC mass, respectively
(Fig. S3b), lower than the respective contributions of 24 and 0.7 % measured at LRK (Budisulistiorini et al., 2015).
Figure 3 shows no difference for the average day and night concentration of isoprene-derived SOA tracers, suggesting that the majority of isoprene SOA tracers are potentially long-lived and formed upwind. A recent study by Lopez-Hilfiker et al. (2016) at the CTR site during the 2013 SOAS demonstrated that isoprene-derived SOA was comprised of effectively nonvolatile material, which could allow for this type of SOA to be long-lived in the atmosphere. Although 2-MG and MAE-derived OS are known to form under high-NOx conditions (Lin et al., 2013a), no correlation between
2-MG and MAE-derived OS with NOx(Table 4) is observed
Table 3. Summary of isoprene-derived SOA tracers measured by GC/EI-MS and UPLC/ESI-HR-QTOFMS.
Max Mean
SOA tracers m/z Frequency of concentration concentration Isoprene SOA % of total
detection (%)a (ng m−3) (ng m−3) mass fraction (%)b OMc
Measured by GC/EI-MS
2-methylerythritold 219 99.2 1048.9 269.0 33.8 2.7
2-methylthreitold 219 100.0 388.9 107.3 13.5 1.1
(E)-2-methylbut-3-ene-1,2,4-triole 231 96.7 878.9 112.7 14.2 1.1
(Z)-2-methylbut-3-ene-1,2,4-triole 231 95.8 287.8 38.9 4.9 0.4
2-methylbut-3-ene-1,2,3-triole 231 94.2 503.3 28.9 3.6 0.3
2-methylglyceric acidd 219 93.3 35.0 10.8 1.4 0.1
cis-3-MeTHF-3,4-diold 262 22.5 98.9 6.9 0.9 0.1
trans-3-MeTHF-3,4-diold 262 10.0 137.6 8.6 1.1 0.1
IEPOX-derived dimere 333 10.0 2.2 0.0 0.0 0.0
Levoglucosand 204 100.0 922.6 98.7 – 1.0
Measured by UPLC/DAD-ESI-HR-QTOFMS
IEPOX-derived OSs
C5H11O7S− d
215 100.0 864.9 164.5 20.7 1.6
C10H21O10S−f 333 1.7 0.3 0.0 0.0 0.0
MAE-derived OSd
C4H7O7S− 199 100.0 35.7 7.2 1.9 0.1
GA sulfated
C2H3O6S− 155 100.0 75.2 26.2 3.3 0.3
Methylglyoxal-derived OSg
C3H5O6S− 169 97.5 10.5 2.7 0.3 0.0
Isoprene-derived OSsg
C5H7O7S− 211 97.5 5.2 1.4 0.2 0.0
C5H10NO9S− 260 90.0 3.9 0.3 0.0 0.0
C5H9N2O11S− 305 5.0 3.3 2.9 0.4 0.0
Hydroxyacetone-derived OSg
C2H3O5S− 139 30.8 2.6 0.2 0.0 0.0
aTotal filters: 120.
bMass fraction is the contribution of each species among total known isoprene-derived SOA mass detected by GC/EI-MS and UPLC/DAD-ESI-HR-QTOFMS. cOM/OC=1.6.
dOA tracers quantified by authentic standards.
eSOA tracers quantified by 2-methyltetrols as a surrogate standard.
fSOA tracer quantified by IEPOX-derived OS (m/z215) as a surrogate standard. gSOA tracers quantified by propyl sulfate as a surrogate standard.
of a significant correlation between isoprene SOA tracers and O3, to be discussed in more detail in Sect. 3.3.2.
3.3 Influence of anthropogenic emissions on isoprene-derived SOA
3.3.1 Effects of reactive nitrogen-containing species
During the campaign, no isoprene-derived SOA tracers, in-cluding MAE/HMML-derived OS and 2-MG, correlated with NOx or NOy (r2=0, n=120). This is inconsistent
with the current understanding of SOA formation from iso-prene oxidation pathways under high-NOxconditions, which
proceeds through the uptake of MAE (Lin et al., 2013a), and, as recently suggested, HMML (Nguyen et al., 2015), to yield 2-MG and its OS derivative. Plume age, as a ratio of NOx:NOy, in this study was highly correlated with O3(r2=
0.79,n=120), which is consistent with the relative diurnal variation of NOx, NOy, and O3 as discussed in Sect. 3.1.
This correlation might also be explained by the photolysis of NO2, which is abundant due to traffic at the urban ground
site, resulting in the formation of tropospheric O3. A negative
correlation coefficient (r2=0.22,n=120) between plume age and 2-MG abundance was found as a consequence of relative diurnal variations. The peak of 2-MG was observed in the afternoon after NOx has decreased. This correlation
leads to the hypothesis that the formation of 2-MG may be associated with the ageing of air masses; however, further in-vestigation is warranted. A previous study supported a major role for NO3in the nighttime chemistry of isoprene (Ng et
al., 2008). Correlation of IEPOX- and MAE/HMML-derived SOA with nighttime NO2, O3, and P[NO3] were examined
Table 4. Overall correlation (r2)of isoprene-derived SOA tracers and collocated measurements at BHM during 2013 SOAS campaign.
SOA tracers CO O3 NOx NOy SO2 NH3 SO4 NO3 NH4 OC WSOC pH
MAE/HMML-derived SOA tracers* 0.07 0.26 0.00 0.01 0.06 0.11 0.33 0.01 0.18 0.47 0.20 0.00
2-Methylglyceric acid 0.01 0.26 0.01 0.00 0.01 0.07 0.10 0.00 0.06 0.19 0.02 0.00 MAE-derived OS 0.10 0.14 0.00 0.02 0.07 0.09 0.38 0.01 0.18 0.32 0.23 0.01
IEPOX-derived SOA tracers** 0.04 0.05 0.00 0.01 0.05 0.01 0.36 0.00 0.21 0.24 0.12 0.00
2-Methylerythritol 0.00 0.16 0.03 0.02 0.01 0.00 0.30 0.02 0.18 0.18 0.19 0.00 2-Methylthreitol 0.00 0.13 0.02 0.03 0.02 0.00 0.20 0.01 0.16 0.17 0.15 0.00 (E)-2-methylbut-3-ene-1,2,4-triol 0.07 0.00 0.02 0.01 0.07 0.00 0.15 0.00 0.19 0.11 0.04 0.00 (Z)-2-methylbut-3-ene-1,2,4-triol 0.04 0.00 0.00 0.00 0.06 0.00 0.28 0.00 0.20 0.04 0.00 0.00 2-methylbut-3-ene-1,2,3-triol 0.02 0.00 0.03 0.00 0.00 0.02 0.32 0.01 0.03 0.17 0.04 0.00 IEPOX-derived OS 0.02 0.14 0.03 0.00 0.00 0.00 0.27 0.00 0.16 0.29 0.29 0.00
IEPOX dimer 0.00 0.00 0.00 0.00 0.00 0.00 0.00 0.00 0.00 0.00 0.00 0.00
Other isoprene SOA tracers
GA sulfate
C2H3O6S− 0.30 0.23 0.01 0.00 0.08 0.09 0.27 0.00 0.19 0.38 0.18 0.00
Methylglyoxal-derived OS
C3H5O6S− 0.14 0.04 0.02 0.03 0.03 0.07 0.31 0.02 0.25 0.21 0.24 0.00
Isoprene-derived OSs
C5H7O7S− 0.01 0.23 0.03 0.01 0.00 0.02 0.21 0.00 0.16 0.31 013 0.00
C5H10NO9S− 0.17 0.00 0.12 0.14 0.10 0.14 0.31 0.16 0.23 0.20 0.07 0.00
C5H9N2O11S−∗∗∗ 0.32 0.71 0.66 0.58 0.42 0.02 0.68 0.50 0.42 0.00 0.50 0.00 Hydroxyacetone-derived OS
C2H3O5S− 0.02 0.10 0.08 0.07 0.05 0.00 0.00 0.03 0.00 0.01 0.01 0.00
Other tracer
Levoglucosan 0.00 0.09 0.02 0.01 0.02 0.00 0.00 0.02 0.00 0.08 0.04 0.01
∗Summed tracers for MAE/HMML-derived SOA. ∗∗Summed tracers for IEPOX-derived SOA. ∗∗∗Found only in 6 of 120 filters. The correlations in this table are positive.
correlation between MAE/HMML-derived SOA and night-time P[NO3] (r2=0.57,n=40) was observed. The
regres-sion analysis revealed a significant correlation at the 95 % confidence interval (p value < 0.05) (Table S7). This finding suggests that some MAE/HMML-derived SOA may form lo-cally from the reaction of isoprene with the NO3radical at
night. A field study reported a peak isoprene mixing ratio in the early evening (Starn et al., 1998) as the PBL height decreases at night. As a result, lowering PBL heights could concentrate the remaining isoprene, NO2, and O3 that can
continue to react during the course of the evening. 2-MG for-mation has been reported to be NO2-dependent via the
for-mation and further oxidation of MPAN (Surratt et al., 2006; Chan et al., 2010). Hence, decreasing PBL may be related to nighttime MAE/HMML-derived SOA formation through isoprene oxidation by both P[NO3] and NO2.
Although P[NO3] depends on both NO2 and O3
lev-els, O3 correlates moderately with MAE/HMML-derived
SOA tracers during the day (r2=0.48, n=75) but not at night (r2=0.08, n=45). The effect of O3 on
isoprene-derived SOA formation during daytime will be discussed fur-ther in Sect. 3.3.2. NO2 levels correlate only weakly with
MAE/HMML-derived SOA tracers (r2=0.26, n=45), in-dicating that NO2levels alone do not explain the moderate
correlation of P[NO3] with these tracers. To our knowledge,
the correlation of P[NO3] with high-NOx SOA tracers has
not been observed in previous field studies, indicating that further work is needed to examine the potential role of night-time NO3radicals in forming these SOA tracers.
As shown in Fig. 7f, IEPOX-derived SOA was weakly correlated (r2=0.26,n=40) with nighttime P[NO3]. The
correlation appears to be driven by the data at the low end of the scale and could therefore be misleading. However, Schwantes et al. (2015) demonstrated that NO3-initiated
ox-idation of isoprene yields isoprene nitrooxy hydroperoxides (INEs) through the nighttime reaction of RO2+HO2, which
Figure 4. The box-and-whisker plot (n=15) of (a) MAE/HMML-derived SOA, (b) MAE/HMML-OS, and (c) 2-MG. These demon-strate that the statistical distribution of SOA abundance during each intensive sampling period. No significant variation amongst inten-sive samples was observed.
possibility that a fraction of IEPOX-derived SOA comes from NO3-initiated oxidation of isoprene at night. The work
of Ng et al. (2008), which only observed SOA as a conse-quence of the RO2+RO2and RO2+NO3reactions
dom-inating the fate of the RO2 radicals, does not explain the
weak association between IEPOX-derived SOA tracers and P[NO3] which we observe in this study. It is now thought that RO2+HO2should dominate the fate of RO2radicals in
the atmosphere (Paulot et al., 2009; Schwantes et al., 2015). 3.3.2 Effect of O3
During the daytime, O3 was moderately correlated
(r2=0.48, n=75) with total MAE/HMML-derived SOA (Fig. 6b). This correlation was stronger (r2=0.72, n=30,pvalue < 0.05; Table S7) when filters taken during regular daytime sampling periods are considered, suggesting that the formation of MACR (a precursor to MAE and HMML) (Lin et al., 2013b; Nguyen et al., 2015) was enhanced by oxidation of isoprene by O3 (Kamens et al.,
1982). O3 was not correlated (r2=0.08, n=45) with
MAE/HMML-derived SOA at night (Fig. 6e). The latter finding is consistent with the absence of photolysis to drive the production of O3. However, residual O3 may play an
Figure 5. The box-and-whisker plot (n=15) of (a) IEPOX-derived SOA, (b) IEPOX-OS, (c) 2-methyltetrols, and (d) (E)-2-methylbut-3-ene-1,2,4-triol. These demonstrate that the statistical distribution of SOA abundance during each intensive sampling period. No sig-nificant variation amongst intensive samples was observed.
important role at night to form MAE/HMML-derived SOA via the P[NO3] pathway discussed in Sect. 3.3.1.
O3 was not correlated (r2=0.10, n=75) with
IEPOX-derived SOA during daytime (Fig. 7b) but weakly corre-lated with 2-methylerythritol (r2=0.25,n=30) as shown in Table S2, especially during Intensive 3 sampling peri-ods (r2=0.34,n=15; Table S5). An important observation with regard to this result is that no correlation has been found between O3and 2-methyltetrols (r2<0.01) in previous field
studies (Lin et al., 2013b; Budisulistiorini et al., 2015). Iso-prene ozonolysis yielded 2-methyltetrols in chamber studies in the presence of acidified sulfate aerosol (Riva et al., 2016), but C5-alkene-triols were not formed by this pathway. The
greatest abundance of isoprene-derived SOA tracers in day-time samples was generally observed in Intensive 3 samples; however, there was no statistically significant difference ob-served between intensive samples. The moderate correlation (r2=0.34,n=15,p value < 0.05) between O3 and the
2-methyltetrols observed in Intensive 3 samples occurred when O3 reached maximum levels, suggesting that ozonolysis of
Figure 6. Correlation of MAE/HMML-derived SOA tracers with (a) daytime NO2, (b) daytime O3, (c) daytime P[NO3], (d)
night-time NO2, (e) nighttime O3, and (f) nighttime P[NO3]. Nighttime
P[NO3] correlation suggests that NO3radical chemistry could
ex-plain some fraction of the MAE/HMML-derived SOA tracer con-centrations.
3 sampling (r2=0.10,n=15) supports this contention. Pre-vious studies (Nguyen et al., 2010; Inomata et al., 2014) pro-posed that SOA formation from isoprene ozonolysis occurs from stabilized Criegee intermediates (sCIs) that can fur-ther react in the gas phase to form higher molecular weight products that subsequently partition to the aerosol phase to make SOA. Recent work by Riva et al. (2016) systemati-cally demonstrated that isoprene ozonolysis in the presence of wet acidic aerosol yields 2-methyltetrols and organosul-fates unique to this process. Notably, no C5-alkene triols
were observed, which are known to form simultaneously with 2-methyltetrols if IEPOX multiphase chemistry is in-volved (Lin et al., 2012). Riva et al. (2016) tentatively pro-posed that hydroperoxides formed in the gas phase from iso-prene ozonolysis potentially partition to wet acidic sulfate aerosols and hydrolyze to yield 2-methyltetrols as well as the unique set of organosulfates observed (Riva et al., 2016). Additional work using authentic hydroperoxide standards is needed to validate this tentative hypothesis.
3.3.3 Effect of particle SO24−
SO24− was moderately correlated with IEPOX-derived SOA (r2=0.36,n=117) and MAE/HMML-derived SOA (r2= 0.33,n=117) at the 95 % confidence interval as shown in Table S7. The strength of the correlations was consistent with studies at other sites across the southeastern US
(Bud-Figure 7. Correlation of IEPOX-derived SOA tracers with (a)
day-time NO2, (b) daytime O3, (c) daytime P[NO3], (d) nighttime NO2, (e) nighttime O3, and (f) nighttime P[NO3]. Nighttime P[NO3]
cor-relation suggests that NO3 radical chemistry could explain some
fraction of the IEPOX-derived SOA tracer concentrations. The con-tribution of nighttime P[NO3] to IEPOX-derived SOA would be
smaller than MAE/HMML-derived SOA due to the weaker corre-lation.
isulistiorini et al., 2013, 2015; Lin et al., 2013b; Xu et al., 2015). Aerosol surface area provided by acidic SO24− has been demonstrated to control the uptake of isoprene-derived epoxides (Lin et al., 2012; Gaston et al., 2014; Nguyen et al., 2014; Riedel et al., 2015).
Furthermore, SO24− is proposed to enhance IEPOX-derived SOA formation by providing particle water (H2Optcl)
required for IEPOX uptake (Xu et al., 2015). Aerosol SO24−also promotes acid-catalyzed ring-opening reactions of IEPOX by H+, proton donors such as NH+
4, and nucleophiles
(e.g., H2O, SO24−, or NO −
3)(Surratt et al., 2010; Nguyen et
which the solubility of polar organic compounds would be increased in aqueous solution with increasing salt concentra-tion (Xu et al., 2015). However, systematic investigaconcentra-tions of this effect are lacking and further studies are warranted. 3.3.4 Effect of aerosol acidity
The aerosol at BHM was acidic throughout the SOAS cam-paign (pH range 1.60–1.94, average 1.76) in accordance with a study by Guo et al. (2015) that found aerosol pH ranging from 0 to 2 throughout the southeastern US. However, no cor-relation of pH with isoprene SOA formation was observed at BHM, also consistent with previous findings using the ther-modynamic models to estimate aerosol acidity in many field sites across the southeastern US region, including YRK (Lin et al., 2013b), JST (Budisulistiorini et al., 2013), and LRK (Budisulistiorini et al., 2015). However, it is important to point out that the lack of correlation between SOA tracers and acidity may stem from the small variations in aerosol acidity and the fact that aerosols are very acidic throughout the campaign. Gaston et al. (2014) and Riedel et al. (2015) recently demonstrated that an aerosol pH < 2 at atmospheri-cally relevant aerosol surface areas would allow the reactive uptake of IEPOX onto acidic (wet) sulfate aerosol surfaces to be competitive with other loss processes (e.g., deposition and reaction of IEPOX with OH). In fact, it was estimated that under such conditions IEPOX would have a lifetime of ∼5 h. The constant presence of acidic aerosol has also been observed at other field sites in the southeastern US (Bud-isulistiorini et al., 2013, 2015; Xu et al., 2015), supporting the conclusion that acidity is not the limiting variable in forming isoprene SOA.
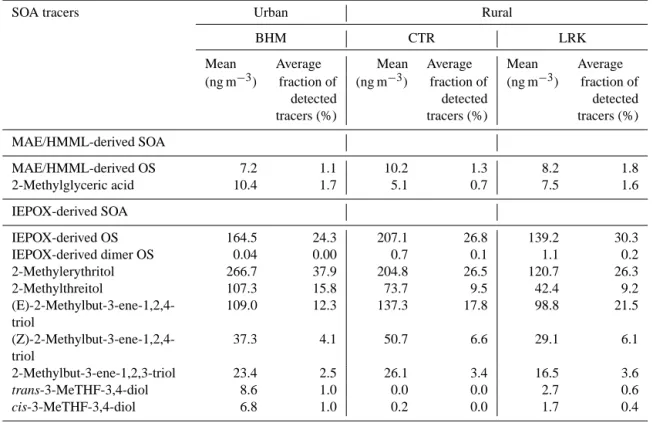
3.4 Comparison among different sampling sites during 2013 SOAS campaign
Table 5 summarizes the mean concentration and contri-bution of each isoprene SOA tracer at BHM, CTR, and LRK. BHM is an industrial–residential area; LRK and CTR are rural areas, although LRK is influenced by a diur-nal upslope–downslope cycle of air from an urban local-ity (Knoxville) (Tanner et al., 2005). IEPOX-derived SOA (isoprene SOA produced under low-NOx conditions) was
predominant at all three sites during the SOAS campaign, while MAE/HMML-derived SOA (isoprene SOA produced under high-NOx conditions) constituted a minor
contribu-tion. The average ratio of 2-methyltetrols to C5-alkene
tri-ols at BHM was 2.2, nearly double that of CTR (1.3) and LRK (1.1). Although 2-methyltetrols and C5-alkene triols
are considered to form readily from the acid-catalyzed reac-tive uptake and multiphase chemistry of IEPOX (Edney et al., 2005; Surratt et al., 2006), Riva et al. (2016) recently demonstrated that only 2-methyltetrols can be formed via isoprene ozonolysis in the presence of acidic sulfate aerosol. The detailed mechanism explaining isoprene ozonolysis is
still unclear, but acid-catalyzed heterogeneous reaction with organic peroxides or H2O2 was considered to be a
possi-ble route for 2-methyltetrol formation. The higher levels of the 2-methyltetrols observed at the urban BHM site indi-cate a likely competition between the IEPOX uptake and ozonolysis pathways. Together, these findings suggest that urban O3 may play an important role in forming the
2-methyltetrols observed at BHM. There were notable trends found among the three sites: (1) average C5-alkene triol
concentrations were higher at CTR (214.1 ng m−3)than at BHM (169.7 ng m−3) and LRK (144.4 ng m−3); (2) aver-age isomeric 3-MeTHF-diol concentrations were lower at CTR (0.2 ng m−3) than the BHM (15.4 ng m−3) or LRK (4.4 ng m−3)sites. Except for the 2-methyltetrols, reasons for the differences observed for the other tracers between sites remain unclear and warrant future investigations.
4 Conclusions
This study examined isoprene SOA tracers in PM2.5
sam-ples collected at the BHM ground site during the 2013 SOAS campaign and revealed the complexity and potential multi-tude of chemical pathways leading to isoprene SOA forma-tion. Isoprene SOA contributed up to∼20 % (∼7 % on av-erage) of total OM mass. IEPOX-derived SOA tracers were responsible for 92.45 % of the total quantified isoprene SOA tracer mass, with 2-methyltetrols being the major component (47 %). Differences in the relative contributions of IEPOX-and MAE/HMML-derived SOA tracers at BHM IEPOX-and the ru-ral CTR and LRK sites (Budisulistiorini et al., 2015) during the 2013 SOAS campaign support suggestions that anthro-pogenic emissions affect isoprene SOA formation. The cor-relation between 2-methyltetrols and O3 at BHM is in
ac-cordance with work by Riva et al. (2016), demonstrating a potential role of O3in generating isoprene-derived SOA in
addition to the currently accepted IEPOX multiphase path-way.
At BHM, the statistical correlation of particulate SO24− with IEPOX- (r2=0.36, n=117, p<0.05) and MAE-derived SOA tracers (r2=0.33,n=117,p<0.05) suggests that SO24−plays a role in isoprene SOA formation. Although none of the isoprene-derived SOA tracers correlated with gas-phase NOx and NOy, MAE/HMML-derived SOA
trac-ers correlated with nighttime P[NO3] (r2=0.57, n=40),
indicating that NO3 may affect local MAE/HMML-derived
SOA formation. Nighttime P[NO3] was weakly correlated
(r2=0.26,n=40) with IEPOX-derived SOA tracers, lend-ing some support to recent work by Schwantes et al. (2015) showing that isoprene + NO3 yields INHEs that can
un-dergo reactive uptake to yield IEPOX tracers and contribute to IEPOX-derived SOA tracer loadings. The correlation of daytime O3 with MAE/HMML-derived SOA and with
cor-Table 5. Summary of isoprene-derived SOA tracers from the three SOAS ground sites: BHM, CTR, and LRK.
SOA tracers Urban Rural
BHM CTR LRK
Mean Average Mean Average Mean Average
(ng m−3) fraction of (ng m−3) fraction of (ng m−3) fraction of
detected detected detected
tracers (%) tracers (%) tracers (%)
MAE/HMML-derived SOA
MAE/HMML-derived OS 7.2 1.1 10.2 1.3 8.2 1.8
2-Methylglyceric acid 10.4 1.7 5.1 0.7 7.5 1.6
IEPOX-derived SOA
IEPOX-derived OS 164.5 24.3 207.1 26.8 139.2 30.3
IEPOX-derived dimer OS 0.04 0.00 0.7 0.1 1.1 0.2
2-Methylerythritol 266.7 37.9 204.8 26.5 120.7 26.3
2-Methylthreitol 107.3 15.8 73.7 9.5 42.4 9.2
(E)-2-Methylbut-3-ene-1,2,4-triol
109.0 12.3 137.3 17.8 98.8 21.5
(Z)-2-Methylbut-3-ene-1,2,4-triol
37.3 4.1 50.7 6.6 29.1 6.1
2-Methylbut-3-ene-1,2,3-triol 23.4 2.5 26.1 3.4 16.5 3.6
trans-3-MeTHF-3,4-diol 8.6 1.0 0.0 0.0 2.7 0.6
cis-3-MeTHF-3,4-diol 6.8 1.0 0.2 0.0 1.7 0.4
relate with isoprene-derived SOA tracers in previous field studies (Lin et al., 2013b; Budisulistiorini et al., 2015). In this study, the strong correlation (r2=0.72,n=30) at the 95 % confidence interval of O3 with MAE/HMML-derived
SOA tracers during the regular daytime sampling schedule indicates that O3likely oxidizes some isoprene to MACR as
a precursor of 2-MG at BHM. The weak correlation (r2= 0.16,n=75) between O3 and 2-methyltetrols early in the
day as well as the better correlation (r2=0.34,n=15) later in the day (Intensive 3, 16:00–19:00 local time) are con-sistent with recent laboratory studies demonstrating that 2-methyltetrols can be formed via isoprene ozonolysis in the presence of acidified sulfate aerosol (Riva et al., 2016).
Although urban O3 and nighttime P[NO3] may have a
role in local formation of MAE/HMML- and IEPOX-derived SOA tracers at BHM, this does not appear to explain the ma-jority of the SOA tracers, since no significant day–night vari-ation of the entire group of tracers was observed during the campaign. The majority of IEPOX-derived SOA was likely formed when isoprene SOA precursors (IEPOX) were gen-erated upwind and transported to the BHM site. Wind di-rections during the campaign are consistent with long-range transport of isoprene SOA precursors from southwest of the site, which is covered by forested areas. The absence of a cor-relation of aerosol acidity with MAE/HMML- and IEPOX-derived SOA tracers indicates that acidity is not the limit-ing variable that controls the formation of these compounds. Because the aerosols are acidic (campaign average aerosol
pH of 1.8), the lack of correlation between SOA tracers and acidity may stem from the nearly invariant aerosol acidity throughout the campaign. Hence, despite laboratory studies demonstrating that aerosol acidity can enhance isoprene SOA formation (Surratt et al., 2007, 2010; Lin et al., 2012), the effect may not be significant in the southeastern US during the summer months due to the constant acidity of aerosols. Future work should examine how well current models can predict the isoprene SOA levels observed during this study, especially in the presence of fresh urban emissions. Further-more, explicit models are now available to predict the iso-prene SOA tracers measured here (McNeill et al., 2012; Pye et al., 2013), which will allow the modeling community to test the current parameterizations that are used to capture the enhancing effect of anthropogenic pollutants on isoprene-derived SOA formation. In addition, the significant correla-tions of isoprene-derived SOA tracers with P[NO3] observed
during this study indicate a need to better understand night-time chemistry of isoprene. Lastly, although O3 appears to
have an enhancing effect on isoprene-derived SOA tracers, the intermediates are unknown. Hydroperoxides suggested by Riva et al. (2016) may be key, but chamber experiments with authentic precursors are needed to test this hypothesis.
Acknowledgements. This work was funded by the US Environ-mental Protection Agency (EPA) through grant number 835404. The contents of this publication are solely the responsibility of the authors and do not necessarily represent the official views of the US EPA. Further, the US EPA does not endorse the purchase of any commercial products or services mentioned in the publication. The authors would also like to thank the Electric Power Research Institute (EPRI) for their support. This study was supported in part by the National Oceanic and Atmospheric Administration (NOAA) Climate Program Office’s AC4 program, award number NA13OAR4310064. The authors thank the Camille and Henry Dreyfus Postdoctoral Fellowship Program in Environmental Chem-istry for their financial support. The authors thank Louisa Emmons and Christoph Knote for their assistance with chemical forecasts made available during the SOAS campaign. We would like to thank Annmarie Carlton, Joost deGouw, Jose Jimenez, and Allen Gold-stein for helping to organize the SOAS campaign and coordinating communication between ground sites. UPLC/ESI-HR-Q-TOFMS analyses were conducted in the UNC-CH Biomarker Mass Facility located within the Department of Environmental Sciences and Engineering, which is a part of the UNC-CH Center for Envi-ronmental Health and Susceptibility supported by the National Institute for Environmental Health Sciences (NIEHS), grant number 5P20-ES10126. WSOC measurements at the University of Iowa were supported through EPA STAR grant 8354101. The authors thank Theran Riedel for useful discussions. We also thank SCG Chemicals Co., Ltd., Siam Cement Group, Thailand, for the full support for W. Rattanavaraha attending UNC, Chapel Hill.
Edited by: A. Laskin
References
Birch, M. E. and Cary, R. A.: Elemental carbon-based method for occupational monitoring of particulate diesel exhaust: methodol-ogy and exposure issues, Analyst, 121, 1183–1190, 1996. Blanchard, C. L., Hidy, G. M., Shaw, S., Baumann, K., and
Edger-ton, E. S.: Effects of emission reductions on organic aerosol in the southeastern United States, Atmos. Chem. Phys., 16, 215– 238, doi:10.5194/acp-16-215-2016, 2016.
Boucher, O., Randall, D., Artaxo, P., Bretherton, C., Feingold, G., Forster, P., Kerminen, V.-M., Kondo, Y., Liao, H., and Lohmann, U.: Clouds and aerosols, in: Climate change 2013: the physi-cal science basis. Contribution of Working Group I to the Fifth Assessment Report of the Intergovernmental Panel on Climate Change, Cambridge University Press, 571–657, 2013.
Budisulistiorini, S. H., Canagaratna, M. R., Croteau, P. L., Marth, W. J., Baumann, K., Edgerton, E. S., Shaw, S. L., Knipping, E. M., Worsnop, D. R., and Jayne, J. T.: Real-time continuous char-acterization of secondary organic aerosol derived from isoprene epoxydiols in downtown Atlanta, Georgia, using the Aerodyne Aerosol Chemical Speciation Monitor, Environ. Sci. Technol., 47, 5686–5694, 2013.
Budisulistiorini, S. H., Li, X., Bairai, S. T., Renfro, J., Liu, Y., Liu, Y. J., McKinney, K. A., Martin, S. T., McNeill, V. F., Pye, H. O. T., Nenes, A., Neff, M. E., Stone, E. A., Mueller, S., Knote, C., Shaw, S. L., Zhang, Z., Gold, A., and Surratt, J. D.: Examining the effects of anthropogenic emissions on
isoprene-derived secondary organic aerosol formation during the 2013 Southern Oxidant and Aerosol Study (SOAS) at the Look Rock, Tennessee ground site, Atmos. Chem. Phys., 15, 8871–8888, doi:10.5194/acp-15-8871-2015, 2015.
Carlton, A. G., Wiedinmyer, C., and Kroll, J. H.: A review of Sec-ondary Organic Aerosol (SOA) formation from isoprene, At-mos. Chem. Phys., 9, 4987–5005, doi:10.5194/acp-9-4987-2009, 2009.
Carlton, A. G., Bhave, P. V., Napelenok, S. L., Edney, E. O., Sarwar, G., Pinder, R. W., Pouliot, G. A., and Houyoux, M.: Model repre-sentation of secondary organic aerosol in CMAQv4. 7, Environ. Sci. Technol., 44, 8553–8560, 2010a.
Carlton, A. G., Pinder, R. W., Bhave, P. V., and Pouliot, G. A.: To what extent can biogenic SOA be controlled?, Environ. Sci. Technol., 44, 3376–3380, 2010b.
Chan, A. W. H., Chan, M. N., Surratt, J. D., Chhabra, P. S., Loza, C. L., Crounse, J. D., Yee, L. D., Flagan, R. C., Wennberg, P. O., and Seinfeld, J. H.: Role of aldehyde chemistry and NOx
concen-trations in secondary organic aerosol formation, Atmos. Chem. Phys., 10, 7169–7188, doi:10.5194/acp-10-7169-2010, 2010. Claeys, M., Graham, B., Vas, G., Wang, W., Vermeylen, R.,
Pashyn-ska, V., Cafmeyer, J., Guyon, P., Andreae, M. O., and Artaxo, P.: Formation of secondary organic aerosols through photooxidation of isoprene, Science, 303, 1173–1176, 2004.
Ding, X., Zheng, M., Yu, L., Zhang, X., Weber, R. J., Yan, B., Rus-sell, A. G., Edgerton, E. S., and Wang, X.: Spatial and seasonal trends in biogenic secondary organic aerosol tracers and water-soluble organic carbon in the southeastern United States, Envi-ron. Sci. Technol., 42, 5171–5176, 2008.
Edgerton, E. S., Hartsell, B. E., Saylor, R. D., Jansen, J. J., Hansen, D. A., and Hidy, G. M.: The Southeastern Aerosol Research and Characterization Study, part 3: Continuous measurements of fine particulate matter mass and composition, J. Air Waste Manag. Assoc., 56, 1325–1341, 2006.
Edney, E. O., Kleindienst, T. E., Jaoui, M., Lewandowski, M., Offenberg, J. H., Wang, W., and Claeys, M.: Formation of 2-methyl tetrols and 2-2-methylglyceric acid in secondary organic aerosol from laboratory irradiated isoprene/NOX/SO2/air
mix-tures and their detection in ambient PM2.5 samples collected in the eastern United States, Atmos. Environ., 39, 5281–5289, doi:10.1016/j.atmosenv.2005.05.031, 2005.
El-Zanan, H. S., Zielinska, B., Mazzoleni, L. R., and Hansen, D. A.: Analytical determination of the aerosol organic mass-to-organic carbon ratio, J. Air Waste Manag. Assoc., 59, 58–69, 2009. Emmons, L. K., Walters, S., Hess, P. G., Lamarque, J.-F., Pfister,
G. G., Fillmore, D., Granier, C., Guenther, A., Kinnison, D., Laepple, T., Orlando, J., Tie, X., Tyndall, G., Wiedinmyer, C., Baughcum, S. L., and Kloster, S.: Description and evaluation of the Model for Ozone and Related chemical Tracers, version 4 (MOZART-4), Geosci. Model Dev., 3, 43–67, doi:10.5194/gmd-3-43-2010, 2010.
Foley, K. M., Roselle, S. J., Appel, K. W., Bhave, P. V., Pleim, J. E., Otte, T. L., Mathur, R., Sarwar, G., Young, J. O., Gilliam, R. C., Nolte, C. G., Kelly, J. T., Gilliland, A. B., and Bash, J. O.: Incremental testing of the Community Multiscale Air Quality (CMAQ) modeling system version 4.7, Geosci. Model Dev., 3, 205–226, doi:10.5194/gmd-3-205-2010, 2010.
-Ca2+-Mg2+-NH+4-Na+-SO24−-NO−3-Cl−-H2O aerosols, At-mos. Chem. Phys., 7, 4639–4659, doi:10.5194/acp-7-4639-2007, 2007.
Fountoukis, C., Nenes, A., Sullivan, A., Weber, R., Van Reken, T., Fischer, M., Matías, E., Moya, M., Farmer, D., and Cohen, R. C.: Thermodynamic characterization of Mexico City aerosol during MILAGRO 2006, Atmos. Chem. Phys., 9, 2141–2156, doi:10.5194/acp-9-2141-2009, 2009.
Galloway, M. M., Chhabra, P. S., Chan, A. W. H., Surratt, J. D., Flagan, R. C., Seinfeld, J. H., and Keutsch, F. N.: Glyoxal up-take on ammonium sulphate seed aerosol: reaction products and reversibility of uptake under dark and irradiated conditions, At-mos. Chem. Phys., 9, 3331–3345, doi:10.5194/acp-9-3331-2009, 2009.
Gómez-González, Y., Surratt, J. D., Cuyckens, F., Szmigielski, R., Vermeylen, R., Jaoui, M., Lewandowski, M., Offenberg, J. H., Kleindienst, T. E., Edney, E. O., Blockhuys, F., Van Alsenoy, C., Maenhaut, W., and Claeys, M.: Characterization of organosul-fates from the photooxidation of isoprene and unsaturated fatty acids in ambient aerosol using liquid chromatography/(-) electro-sprayionization massspectrometry, J. Mass Spectrom.,43, 371– 382, 2008.
Graham, R. A. and Johnston, H. S.: The photochemistry of the ni-trate radical and the kinetics of the nitrogen pentoxide-ozone sys-tem, J. Phys. Chem., 82, 254–268, 1978.
Guenther, A. B., Jiang, X., Heald, C. L., Sakulyanontvittaya, T., Duhl, T., Emmons, L. K., and Wang, X.: The Model of Emissions of Gases and Aerosols from Nature version 2.1 (MEGAN2.1): an extended and updated framework for modeling biogenic emis-sions, Geosci. Model Dev., 5, 1471–1492, doi:10.5194/gmd-5-1471-2012, 2012.
Grieshop, A. P., Logue, J. M., Donahue, N. M., and Robinson, A. L.: Laboratory investigation of photochemical oxidation of or-ganic aerosol from wood fires 1: measurement and simulation of organic aerosol evolution, Atmos. Chem. Phys., 9, 1263–1277, doi:10.5194/acp-9-1263-2009, 2009.
Hallquist, M., Wenger, J. C., Baltensperger, U., Rudich, Y., Simp-son, D., Claeys, M., Dommen, J., Donahue, N. M., George, C., Goldstein, A. H., Hamilton, J. F., Herrmann, H., Hoff-mann, T., Iinuma, Y., Jang, M., Jenkin, M. E., Jimenez, J. L., Kiendler-Scharr, A., Maenhaut, W., McFiggans, G., Mentel, Th. F., Monod, A., Prévôt, A. S. H., Seinfeld, J. H., Surratt, J. D., Szmigielski, R., and Wildt, J.: The formation, properties and im-pact of secondary organic aerosol: current and emerging issues, Atmos. Chem. Phys., 9, 5155–5236, doi:10.5194/acp-9-5155-2009, 2009.
Hansen, D. A., Edgerton, E. S., Hartsell, B. E., Jansen, J. J., Kan-dasamy, N., Hidy, G. M., and Blanchard, C. L.: The Southeastern aerosol research and characterization study: part 1 – overview, J. Air Waste Manag.Assoc., 53, 1460–1471, 2003.
Henze, D. K., Seinfeld, J. H., and Shindell, D. T.: Inverse model-ing and mappmodel-ing US air quality influences of inorganic PM2.5
precursor emissions using the adjoint of GEOS-Chem, At-mos. Chem. Phys., 9, 5877–5903, doi:10.5194/acp-9-5877-2009, 2009.
Herron, J. T. and Huie, R. E.: Rate constants for the reactions of ozone with ethene and propene, from 235.0 to 362.0. deg. K, J. Phys. Chem., 78, 2085–2088, 1974.
Hu, W. W., Campuzano-Jost, P., Palm, B. B., Day, D. A., Ortega, A. M., Hayes, P. L., Krechmer, J. E., Chen, Q., Kuwata, M., Liu, Y. J., de Sá, S. S., McKinney, K., Martin, S. T., Hu, M., Budisulistiorini, S. H., Riva, M., Surratt, J. D., St. Clair, J. M., Isaacman-Van Wertz, G., Yee, L. D., Goldstein, A. H., Carbone, S., Brito, J., Artaxo, P., de Gouw, J. A., Koss, A., Wisthaler, A., Mikoviny, T., Karl, T., Kaser, L., Jud, W., Hansel, A., Docherty, K. S., Alexander, M. L., Robinson, N. H., Coe, H., Allan, J. D., Canagaratna, M. R., Paulot, F., and Jimenez, J. L.: Characteri-zation of a real-time tracer for isoprene epoxydiols-derived sec-ondary organic aerosol (IEPOX-SOA) from aerosol mass spec-trometer measurements, Atmos. Chem. Phys., 15, 11807–11833, doi:10.5194/acp-15-11807-2015, 2015.
Inomata, S., Sato, K., Hirokawa, J., Sakamoto, Y., Tanimoto, H., Okumura, M., Tohno, S., and Imamura, T.: Analysis of secondary organic aerosols from ozonolysis of isoprene by proton trans-fer reaction mass spectrometry, Atmos. Environ., 97, 397–405, 2014.
Kamens, R., Gery, M., Jeffries, H., Jackson, M., and Cole, E.: Ozone-isoprene reactions: product formation and aerosol poten-tial, Int. J. Chem. Kinet., 14, 955–975, 1982.
Kanakidou, M., Seinfeld, J. H., Pandis, S. N., Barnes, I., Dentener, F. J., Facchini, M. C., Van Dingenen, R., Ervens, B., Nenes, A., Nielsen, C. J., Swietlicki, E., Putaud, J. P., Balkanski, Y., Fuzzi, S., Horth, J., Moortgat, G. K., Winterhalter, R., Myhre, C. E. L., Tsigaridis, K., Vignati, E., Stephanou, E. G., and Wilson, J.: Organic aerosol and global climate modelling: a review, At-mos. Chem. Phys., 5, 1053–1123, doi:10.5194/acp-5-1053-2005, 2005.
Karambelas, A., Pye, H. O., Budisulistiorini, S. H., Surratt, J. D., and Pinder, R. W.: Contribution of isoprene epoxydiol to urban organic aerosol: evidence from modeling and measurements, En-viron. Sci. Technol. Lett., 1, 278–283, 2014.
Kroll, J. H., Ng, N. L., Murphy, S. M., Flagan, R. C., and Seinfeld, J. H.: Secondary organic aerosol formation from isoprene pho-tooxidation under high-NOxconditions, Geophys. Res. Lett., 32,
doi:10.1029/2005GL023637, 2005.
Kroll, J. H., Ng, N. L., Murphy, S. M., Flagan, R. C., and Se-infeld, J. H.: Secondary Organic Aerosol Formation from Iso-prene Photooxidation, Environ. Sci. Technol., 40, 1869–1877, doi:10.1021/es0524301, 2006.
Liao, J., Froyd, K. D., Murphy, D. M., Keutsch, F. N., Yu, G., Wennberg, P. O., St Clair, J. M., Crounse, J. D., Wisthaler, A., and Mikoviny, T.: Airborne measurements of organosulfates over the continental US, J. Geophys. Res. A., 120, 2990–3005, 2015. Lin, Y.-H., Zhang, Z., Docherty, K. S., Zhang, H., Budisulistiorini, S. H., Rubitschun, C. L., Shaw, S. L., Knipping, E. M., Edgerton, E. S., and Kleindienst, T. E.: Isoprene epoxydiols as precursors to secondary organic aerosol formation: acid-catalyzed reactive uptake studies with authentic compounds, Environ. Sci. Technol., 46, 250–258, 2012.
Lin, Y.-H., Zhang, H., Pye, H. O., Zhang, Z., Marth, W. J., Park, S., Arashiro, M., Cui, T., Budisulistiorini, S. H., and Sexton, K. G.: Epoxide as a precursor to secondary organic aerosol formation from isoprene photooxidation in the presence of nitrogen oxides, P. Natl. Acad. Sci., 110, 6718–6723, 2013a.


![Figure 7. Correlation of IEPOX-derived SOA tracers with (a) day- day-time NO 2 , (b) daytime O 3 , (c) daytime P[NO 3 ], (d) nighttime NO 2 , (e) nighttime O 3 , and (f) nighttime P[NO 3 ]](https://thumb-us.123doks.com/thumbv2/123dok_us/8319780.2204985/12.918.79.442.97.456/figure-correlation-derived-daytime-daytime-nighttime-nighttime-nighttime.webp)