MUNICIPAL GOVERNANCE AND DEMOCRATIC PERCEPTIONS: THE ROLE OF PARTY COMPETITION AND MUNICIPAL GOVERNANCE ON EVALUATIONS OF
DEMOCRACY
Katherine M. McKiernan
A thesis submitted to the faculty of the University of North Carolina at Chapel Hill in partial fulfillment of the requirements for the degree of Master of Arts in the Department of Political Science, Concentration in Comparative Politics .
Chapel Hill 2016
Approved by: Evelyne Huber
© 2016
ABSTRACT
KATHERINE M. MCKIERNAN: Municipal Governance and Democratic Perceptions: The Role of Party Competition and Municipal Governance on Evaluations of Democracy
(Under the direction of Evelyne Huber.)
TABLE OF CONTENTS
LIST OF TABLES . . . v
LIST OF FIGURES . . . vi
INTRODUCTION . . . 1
Evaluating Quality of Democracy . . . 3
The Role of Municipal Governments . . . 6
Data and Methods . . . 15
Results and Analysis . . . 28
Discussion . . . 35
APPENDIX . . . 37
LIST OF TABLES
Table
1 Responses for Level of Democracy . . . 18
2 Correlation Matrix of Component Questions . . . 20
3 Proportion of Respondents for Each Control . . . 22
4 Regression Results for Electoral Cues . . . 29
5 Effect of Quality of Governance Cues on Level of Democracy . . . 32
6 Effect of Quality of Governance Cues on Trust in Democracy . . . 34
7 Regression Results for Electoral Cues, 2010 . . . 38
8 2010 Effect of Results cues on Level of Democracy . . . 39
9 2010 Effect of Results Cues on Trust in Democracy . . . 40
10 Electoral Cues Without Parties Squared . . . 41
11 Electoral Cues With Robust Standard Errors . . . 42
12 Effect of Quality of Governance Cues on Level of Democracy, Including Rebel Occupation . . . 43
13 Effect of Quality of Governance Cues on Level of Democracy, Robust Standard Errors . . . 44
14 Effect of Quality of Governance Cues on Trust in Democracy, Including Rebel Occupation . . . 45
LIST OF FIGURES
Figure
1 Theoretical Diagram . . . 8
2 Geographic Variance in Responses for Level of Democracy . . . 18
3 Distribution of Trust in Democratic Institutions and Processes . . . 21
4 Geographic Variance in Responses for Trust in Democratic Institutions and Processes . . . 21
5 Distribution of Years of Education . . . 23
6 Number of Parties Competing for Mayor . . . 24
7 Margin of Victory in Mayoral Elections . . . 24
8 Investment in Local Programs and Services . . . 25
9 Marginal Effect of the Number of Parties . . . 30
10 Predicted Trust in Democracy Across Number of Parties . . . 30
11 Probability of Perceived Levels of Democracy Across Investment in Mu-nicipal Infrastructure . . . 33
12 Marginal Effect of the Number of Parties . . . 37
INTRODUCTION
When third party observers evaluate the quality of democracy in newly developed democracies, they do so using a range of indicators for democratic institutions and pro-cesses. However, these outside evaluations fail to consider the perceptions of citizens living within the regime. Citizens’ perceptions of the quality of democracy illustrate their relative acceptance of the regime at large. If citizens have favorable perceptions of national-level democracy, they are likely to work within the current institutions rather than demand changes in democratic structures. These perceptions depend on whether governments are meeting citizens expectations for democracy. In new democracies, citizens will adopt a minimalist definition of what it means to be democratic, focusing most on free and fair elections while in older democracies, citizens are likely to expect higher levels of civil rights (Brinks, Leiras and Mainwaring 2014). In this paper, I explore how citizens’ experi-ences with political institutions, procedures, and investment influence their evaluations of national quality of democracy.
quality of democracy in the regime1 .
I argue that citizens’ perceptions of the quality of democracy are affected by municipal-level cues. Citizens use experiences with local governments as information shortcuts to as-sess the quality of national-level governance and institutions. Thus, variation in municipal-level governance helps to explain within-state variation in citizens’ perceptions of the qual-ity of the regime’s democracy. I argue that when political elites facilitate municipal demo-cratic elections, build strong municipal infrastructures, and implement policies that improve citizens quality of life, citizens are more likely to see the entire country as democratic.
When classifying democracies, there are many countries with weak democratic institu-tions that do not cleanly fit the category of democracy or autocracy. In weak democracies and hybrid regimes, there is variance in the number of voices in the political system, the level of competition, and the level of democracy within the country (Gibson 2005; Gin-gerich 2013; Giraudy 2010). These differences increase the importance of municipal cues since they help to capture the within-country variance in democracy. When a citizen lives in an authoritarian pocket, they may see their country as less democratic than those citi-zens living in municipalities with stronger cues that democracy is “working”. Municipal cues, therefore, may act as a key source of information for citizens about the political pro-cess and its effectiveness. Citizens are likely to evaluate the effectiveness of governance based on immediate needs: financial situations, infrastructure, and access to public goods (Faguet 2014; Gingerich 2013). Since this access is provided by municipal-level govern-ments, citizens may use these municipal experiences to derive information about the quality of national-level democracy.
In this paper, I test my theory that citizens use municipal-level cues to evaluate national quality of democracy in the context of municipal elections in Colombia. Colombia is a hard test of the theory: it is a unitary government where there is a great deal of autonomy given to local governments, but they are not legally classified as a federation with a distinct realm of authority reserved to departments and municipalities. This creates a conservative test for
the effect of municipal-level cues where municipal characteristics include both mandated and discretionary investment across levels of governance. I run a multi-level model includ-ing both individual-level factors that contribute to perceptions of the quality of democracy and two types of municipal cues: process-based cues, focusing on elections, and results-based cues focused on investment in government services. These measures seek to address signals sent by municipal governments about a commitment to meeting basic needs and the structure of party competition. In newly formed democracies, elections constitute the most basic definition of democracy, so a focus on elections represents a minimum threshold for building democratic regimes.
Evaluating Quality of Democracy
Scholars have used various different measures to evaluate the quality of democracy in newly democratic regions. These measures focus on two dimensions of democracy: proce-dure and results. Procedural components of democracy are characterized by the institution-alization of democratic processes such as the rule of law, accountability, and responsiveness while results are focused on the freedoms afforded to citizens and the pursuit of equality in policy implementation (Morlino 2004). Although both dimensions affect citizens’ percep-tions of the quality of democracy in the regime, there is little understanding about how their effects differ.
as a way to enhance their own legitimacy, without truly practicing democratic governance (Brownlee 2009; Diamond 2002; Gandhi and Przeworski 2007; Howard and Roessler 2006; Magaloni 2006). Scholars have sought to overcome this issue by disaggregating the compo-nents of democratic governance. For example, Levine and Molina (2011) measure quality of democracy as the development of basic elements of democratic governance, which com-bines an electoral dimension, a participation dimension, accountability, responsiveness, and government sovereignty. Yet this approach continues to ignore the importance of citizens perceptions of democracy (Brinks, Leiras and Mainwaring 2014).
Considering perceptions of the quality of democracy allows scholars to account for citizens’ changing expectations for democratic governance as a democracy ages. In new democracies, citizens adopt a minimalist definition of what it means to be democratic, fo-cusing primarily on free and fair elections, while in older democracies, citizens are likely to expect more expansive civil liberties and social welfare (Brinks, Leiras and Mainwaring 2014). I focus on perceptions of the quality of democracy, therefore, to account for citizens contextual understandings of democracy. This allows me to better evaluate how municipal experiences influence national-level evaluations of democracy.
Introducing additional levels of government further complicates how to best evaluate quality of democracy. Subnational governance likely affects perceptions of the quality of democracy because it introduces within-state geographic variation into citizens’ experi-ences with local institutions. When democratizing reforms are introduced at the local level, such as participatory budgeting, village councils, or increased electoral competition, these changes to government institutions, procedures, and policies positively affect how citizens’ feel about the regime in which they live (Truex 2014; Manion 1996; Malesky and Schuler 2010).
governance should matter across various types of formal power sharing agreements. Scholars offer a variety of perspectives on how and to what extent municipal-level insti-tutions and governance affect citizens’ perceptions of the nation’s overall quality of democ-racy. Some argue that democratic governance can be improved by increasing participatory venues to provide citizens with greater accountability and responsiveness from their rep-resentatives (Faguet 2014). However, the extent to which these reforms affect citizens’ perceptions regarding the quality of democracy depends largely on the outcome of policy reforms. Faguet (2014) asserts that although the transference of power to municipal govern-ments and the enactment of institutional reforms may threaten fiscal stability, they generally improve the quality of democratic governance. In turn, these reforms improve perceived levels of democracy. Truex (2014) finds that this logic has limits, however, since citizens have non-uniform expectations for democracy. Thus, elites are only able to manipulate citizen satisfaction with and support for regimes in limited subsamples of the population through municipal-level reforms.
Furthermore, scholars show that the size of a municipality affects how citizens evalu-ate of the quality of their regime’s democracy. In smaller municipalities, citizens are more likely to see themselves as having real power in government (Lassen and Serritzlew 2011). Thus, citizens perceptions of the quality of democracy should be higher in smaller munici-palities.
Gingerich 2013). In the case of authoritarian pockets, the national government will rarely intervene if a provincial government is neither openly authoritarian nor flagrantly violating human rights (Behrend 2011). Instead, national governments tend to focus on securing nec-essary support for elections, policy implementations, and approval of legislation (Behrend 2011). Within-regime variance provides a framework for considering how perceptions of quality of democracy change across subnational units. Democratization reforms are em-ployed non-uniformly across subnational units, which is likely to increase the variance in subnational experiences and perceptions of the quality of democracy.
The Role of Municipal Governments
In this paper, I argue that people build their perceptions of the quality of democracy not only using national-level information, but also by evaluating their experiences at the municipal level. Municipal governments offer readily-accessible signals concerning the provision of necessary resources and the implementation of national level policy. In all states, information about the quality of the regime’s governance can come from a variety of sources–the news, the economy, personal ideology, and personal preference over elected representatives can all affect the degree with which people think democracy “works” in their country. However, access to this information varies between established and weak democracies. When national-level democracy is weak, I argue that citizens rely more on municipal-level experiences to determine the quality of national-level democracy.
In weak democracies and hybrid regimes, traditional evaluations of the quality of democracy are muddled due to coexisting democratic institutions and authoritarian prac-tices. In the case of hybrid regimes, democratic institutions such as competitive elections and participatory venues help to increase regime stability (Gandhi and Przeworski 2007; Lehoucq and P´erez-Li˜n´an 2013). Since democratic institutions can exist in both democra-cies and autocrademocra-cies, evaluating the quality of democracy must look beyond institutions.
elec-toral democracies there is greater variation in citizens’ evaluations. The perceived level of democracy in a country is easily influenced by a country’s experiences with past difficul-ties establishing democratic regimes and histories of democratic backsliding. Citizens will use heuristic cues to evaluate elite decisions and democracy (Rodden and Wibbels 2010). I argue that citizens will respond to local level cues to evaluate national democracy and that variance in municipal-level democracy helps to explain the variance in citizen perceptions of the quality of democracy.
Third party observers such as Polity and Freedom House tend to assume that these cues occur at the national level (Rodden and Wibbels 2010). Uncompetitive elections, national-level corruption, electoral fraud, and government repression all serve as signs that democ-ratization is ineffective (Truex 2014; Reuter and Robertson 2012, 2015; Pop-Eleches and Robertson 2015; Lupu 2014; Morgan 2011). However, a focus on national cues does not account for the variance in electoral systems within developing and weak democracies that permit enduring subnational authoritarian pockets (Behrend 2011; Gibson 2005; Giraudy 2010)]. While at the national level there may be limited competition and strong, central-ized regimes, localities may be the initial locations for democratic reforms and growing oppositions that signal a potential change in national government structure.
This was the story in Mexico, where the single-party authoritarian regime under the Partido Revolucionario Institucional (PRI) opened a greater space for the opposition in municipal governments that initially allowed the PRI to maintain national strength, but ul-timately acted as a catalyst for democratization(Magaloni 2006). Early municipal reforms gave citizens a space to open up the political system and helped citizens push for greater democratization. This was possible because citizens’ demands placed on the political sys-tem changed. Citizens change their demands on elected officials and their expected levels of responsiveness as their information about the political system changed(Truex 2014). In Mexico, citizens first began pushing for greater democracy at the subnational level. After experiencing improvements with regional democracy, citizens pushed for increased levels of democratic competition at the national level.
democratization. In addition to improvements in elections, increased venues for participa-tion, spaces for deliberaparticipa-tion, and evidence of coalitions and cooperation can all signal that democracy is becoming stronger or more efficient. However, these indicators may not be evenly distributed across a country. Electoral cues exist in each municipality in both federal and unitary systems. Municipal governments are often the level of governance closest to the people and the space where immediate needs are met. This allows municipalities to act as an accessible venue to derive larger cues about the national quality of democracy by provid-ing immediate information about political processes and direct experiences to the citizens. Furthermore, since municipal governments implement national policy, citizens might form judgments about the success of national-level governments based on their experiences with municipal governance.
Fig. 1:Theoretical Diagram
to influence the perception of the quality of democracy (see Figure 1). Quality of democracy can be evaluated in different ways: as the perceived level of democracy (how democratic is your country?) or the level of trust in democratic institutions and processes. Thus, I con-sider the quality of democracy in both ways. While process-based and results-based cues are both likely to influence the perceived quality of democracy, citizens responses to these cues will differ. Therefore, both measures of quality of democracy are necessary to see how citizens evaluations change based on process-based and results-based cues.
Signals concerning the democratic process and democratic results represent citizen’s ability to see the government providing for their basic needs. Each of these cues captures one of the two main dimensions of quality of democracy (Morlino 2004; Levine and Molina 2011). I argue that both dimensions–experience with institutions and the observed results– have the potential to change a citizen’s evaluation of democracy because they allow citizens to update their beliefs about the political system by offering signs that the system is either succeeding, representing a high level of democracy, or failing, indicating that democracy is not meeting the needs of the people. These cues further capture the probability that citizens will base evaluations on a limited set of experiences that they share with people within their network.
success or failures of democracy at the subnational level than the national level, this infor-mation is likely to color their interpretation of national democracy. When elections are free, fair, and competitive, they meet the minimum definition of democracy and send a positive signal that democratic institutions are functioning. Where elections show evidence of frac-tionalization, are uncompetitive, or are perceived as corrupt, citizens receive a signal that democratic institutions are failing. I focus on differences in electoral competition across municipalities as a simple measure of within-country variance that prioritizes the first tenet of democracy: free, fair, and competitive elections.
Results-based cues send a more ambiguous signal about the state of democracy. There are various ways in which citizens evaluate changes in outcomes including access to public goods, improvements in the standard of living, opportunities available to citizens, and the efficiency of government services. Where there are improvements in access to goods and services, I hypothesize that citizens will see this as evidence of successful democracy and have a more favorable evaluation of the quality of democracy nationally. Conversely, where citizens see worsening local conditions and services, they are likely to see democracy as less successful. Measuring results poses questions of how to determine if the government is meeting the needs of citizens and how to asses questions of credit claiming across levels of governance. In a decentralized context, municipal governments receive money both via local taxation and federal transfers. However, municipal governments do not have consis-tent levels of autonomy in how to invest money that may not be observed by citizens within the municipality. How funds gained through taxation and transfers are invested offers in-sights concerning the focus of municipal governments and their ability to provide better governance through discretionary investment. Focusing on results allows me to account for subnational variance in democracy where local governments share similar electoral struc-tures.
to messages about democracy, regardless of their decision to vote. Together, citizens use this information to evaluate both the government in power and the political regime.
While these cues exist at the national level, in weak democracies where the national quality of democracy is unclear, municipal governance is important in giving citizens the necessary information to interpret their experiences and update their beliefs about national democracy. Where decentralization reforms offer high levels of autonomy to subnational governments, subnational cues become even more important since autonomous subnational governments send signals that might differ from those at the national level. Furthermore, even where signals overlap, municipal governments are largely responsible for enforcing national policy, offering a deeper insight into outcomes. This is evident through differences in the structure of elections across levels of government. Municipal governments are able to send direct signals concerning outcomes since they are the most immediate providers of services that citizens interact with regularly.
Empirical Tests and Expectations
In order to test my theory, I create a multi-level model that separates the individual-level factors that influence perception of quality of democracy from the municipal-level cues citizens receive about democracy in their country. In the context of a single-country case study, this model controls for national level cues, which provide constant information to citizens. In models for both types of cues, my dependent variable is “quality of democracy” operationalized in two ways: as the perceived level of democracy and as trust in democratic institutions and processes. Including both dependent variables allows me to separate how exposure to different cus effects perceived quality of democracy.
the local level. These categories capture the services most clearly provided by local gov-ernments.
In Colombia, the process of decentralization gives municipalities autonomy within cer-tain limits. Municipalities have the exclusive right to tax real property through Decree 1421 in 1993 and its revisions in 1998 and 2005. Municipalities also are responsible for deter-mining the base and rates of excise taxes. However,each municipality is responsible for creating a development plan to submit to the federal government for approval to request additional funds and provide information about ongoing programs and municipal budgets. Additional autonomy is granted to Bogot´a that allows it to set additional taxes for busi-nesses. The national government is able to limit the autonomy of municipalities due to the reliance on fiscal transfers from the central government.
access to social programs across municipalities. These funds allow the central government to intervene for the purpose of greater equality in implementing programs and in active conflict zones.
At the municipal level, I also control for the municipalities experience with rebel group takeover to account for experience with the Colombian Civil War, the proportion of the municipality that is rural, and the size of the municipality.
At the individual level, I consider exposure to news media since the level of interaction with the news will change a citizen’s knowledge about the national level regime and pro-vide additional information about the quality of democracy. This increase in available cues holds regardless of whether the news is state controlled or independent. I also consider the citizens’ perceptions of the state of the national economy, which is shown to influence their perception of the government and expect that those who see the economy as better will also see the country as more democratic. I include whether the citizen voted. While this is a form of political participation, whether a citizen votes may serve as an indicator for their trust in the democratic system. Finally, I control for a citizen’s level of education and gen-der. While there is evidence that citizens may also be influenced by their income, I do not include this variable because of the high volume of respondents that do not indicate their income which excludes the wealthiest and poorest respondents from the sample. Instead, I trust that education is a meaningful proxy for income as is standard in survey research (Carlin and Zechmeister 2015).
Process-Based Cues
an optimal number of parties competing for office that will maximize perceived quality of democracy. Where only one party competes, people receive cues that there is minimal competition. Conversely, where many fragmented parties compete, citizens receive the opposite message that there is little government consensus and efficiency. Thus, a non-linear relationship should emerge. Furthermore, in a democracy, we expect that elections are competitive rather than nominal. Thus, more competitive elections should lead to higher perceptions of the quality of democracy. I measure competitiveness by subtracting the percent of the vote received by the party receiving the second most votes from the percent of votes received by the winning political party.
This interpretation of process-based cues leads to two related hypotheses:
Hypothesis 1a: As the number of parties competing for office increases, perceptions of
the quality of democracy will increase initially and decrease with the addition of additional parties. This hypothesis assumes a “crowding out” effect in which there are too many political parties in the system and trust in electoral processes should decrease.
Hypothesis 1b: As an election becomes more competitive, citizens’ perceptions of the
quality of democracy will improve.
Results-Based Cues
I use investment in various government services and programs to proxy results-based cues since investment represents a commitment to various municipal services 2 . When considering investment categories, I consider the investment per capita in each municipal-ity. This allows me to capture a comparable measure of how much, per person, municipal governments invest in services. I argue that where investment in each of these services is higher, perceptions of the quality of democracy will also be higher. This test assumes that greater levels of investment per capita acts as a proxy for commitment to providing different government services. For example, higher levels of investment in municipal political
devel-2A potential criticism of this measure is that investment might better represent municipal capacity.
opment indicates greater commitment to opening spaces for local political engagement and participation.
This leads to the following hypothesis:
Hypothesis 2:As investment in the agricultural sector, municipal political development,
social services, and municipal infrastructure increase, citizens’ perceptions of the quality of democracy will improve. In municipalities with large rural populations, the effect of agricultural investment will be larger.
Since municipal-level GDP data is not available, I focus on absolute GDP per capita to allow for the variance in available funds in each municipality due to available tax revenue and the degree of federal transfers.
I test this theory in the context of Colombia because it is a hard test for the theory. If there is evidence that municipal level factors drive perceptions of democracy in a unitary country–where there is lower constitutional separation between the municipalities and the central government–than it may suggest that municipal level cues will continue to have an effect in federal states. Colombia’s vague rules concerning fiscal transfers and municipal autonomy force municipalities to compete for funds by showing fiscal responsibility via balanced municipal budgets. Furthermore, unlike in federal states where the effects of authoritarian pockets have been studied, there have not been studies exploring potential authoritarian pockets within Colombia, where the level of democracy is assumed to be consistent across the country. Despite these conditions, there is a high level of variance in how democratic respondents see Colombia. Geographic variance in respondents may be explained by differences across Colombian municipalities.
Data and Methods
fo-cus of citizens to be on national, rather than municipal, cues. Excluding a national election year, therefore, allows me to focus on respondents average evaluations of the quality of democracy when national-level information is constant. I would expect that a national-level election year would take the focus from municipal-level cues to national-level cues and the effect of municipal-level cues on citizens’ evaluations would disappear.
The use of LAPOP survey data allows me to identify perceptions of the quality of democracy, respondents’ access to news media, perceptions of the national economy, per-ceptions of corruption, and whether or not the respondent voted. I am also able to identify respondents levels of education and their gender. The LAPOP survey is used to construct my dependent variables and to control for demographic characteristics of the respondents.
In order to evaluate the municipal cues for democracy, I use municipal panel data col-lected through Universidad de los Andes’ Center for Economic Development (Facultad de
Economia: Centro de Datos2015). My subset of data includes the absolute investment in
different municipal services for 2004-2008 and mayoral election data from the 2007 and 2011 elections in each of the 1119 municipalities in Colombia. The investment data is re-ported in thousands of pesos. The election data provides the names and political parties of each candidate, the raw votes for each candidate and the number of ballots that were dis-counted because they were either invalid, left blank, or were never cast. Furthermore, this dataset includes demographic characteristics for each municipality such as the total popu-lation broken down by urban and rural popupopu-lations. With this data, I will measure lagged effects of investment per capita and two waves of local elections. I only include observa-tions of municipalities from which there are survey respondents, which allows me to test 81 total municipalities for process-based cues and 53 total municipalities for results-based cues. The reduced number of municipalities for results-based cues occurs because I only look at a single round of LAPOP survey data.3 .
3Using LAPOP survey methods, the respondents are voting-aged individuals from each of the geographic
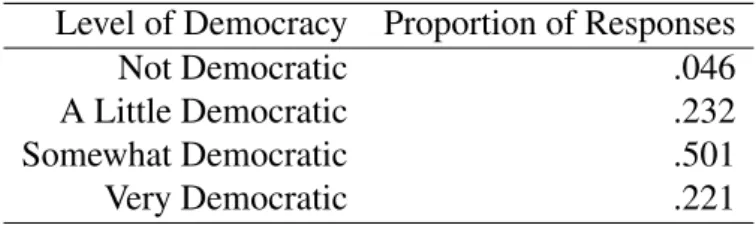
My dependent variable in my models is “Perception of the Quality of Democracy”. I divide this variable into two component parts: perceived level of democracy and trust in democratic institutions and processes. Perceived level of democracy provides an over-all measure of citizens’ perception of the quality of the regime’s democracy whereas trust in democratic institutions provides a more nuanced representation of citizens’ experiences with democratic governance. These two components also reflect citizens’ distinct responses to policy outcomes versus satisfaction with governing institutions. I measure level of democracy using a LAPOP survey question that directly asks “In your opinion, is (Colom-bia) very democratic, somewhat democratic, a little democratic, or not democratic? 4 ”. I recode this variable so that 1 represents “not democratic” and 4 represents “very demo-cratic”. Although this question asks directly about democracy, the respondent’s evaluation is likely influenced by both his or her experience with governance and preference for the current leadership. When considering responses for perceived level of democracy in 1, most respondents chose category 3, “somewhat democratic”, but about as many respondents see Colombia as “very democratic” as those that see Colombia as “a little democratic”5. I also divide the perception of democracy geographically to see the variance of the proportion of respondents who evaluate the level of democracy as “not democratic” and “very democratic in each municipality. In Figure 2, each bar represents a municipality and the proportion of respondents who see Colombia as “not democratic” varies from 0 to just over 15% while the respondents who see Colombia as “very democratic” ranges from 0 to just over 70%.
My second dependent variable is an index of questions pertaining to independent com-ponents of democracy. This index captures the level of trust in democratic institutions and processes, and is correlated with the perception of the level of democracy at r = 0.32.
person has an equal probability of being included in the survey sample. Each subsample is drawn from stratified regions, municipal size, and urban/rural regions to avoid excluding subgroups from geographic regions, different sized municipalities, or the capital city due to the random sample. My sample is equivalent to the LAPOP samples for 2008 and 2012.
4For each survey question, the questions are translated from Spanish to English
5I produce the summary statistics based on my largest sample that will be tested, for the election
Level of Democracy Proportion of Responses
Not Democratic .046
A Little Democratic .232
Somewhat Democratic .501
Very Democratic .221
Table 1:Responses for Level of Democracy
Municipality
Propor
tion of Respondents
0.00
0.05
0.10
0.15
0.20
(a)Proportion of Respondents Responding
Not Democratic
Municipality
Propor
tion of Respondents
0.0
0.2
0.4
0.6
0.8
(b)Proportions of Respondents Responding
Very Democratic
Fig. 2:Geographic Variance in Responses for Level of Democracy
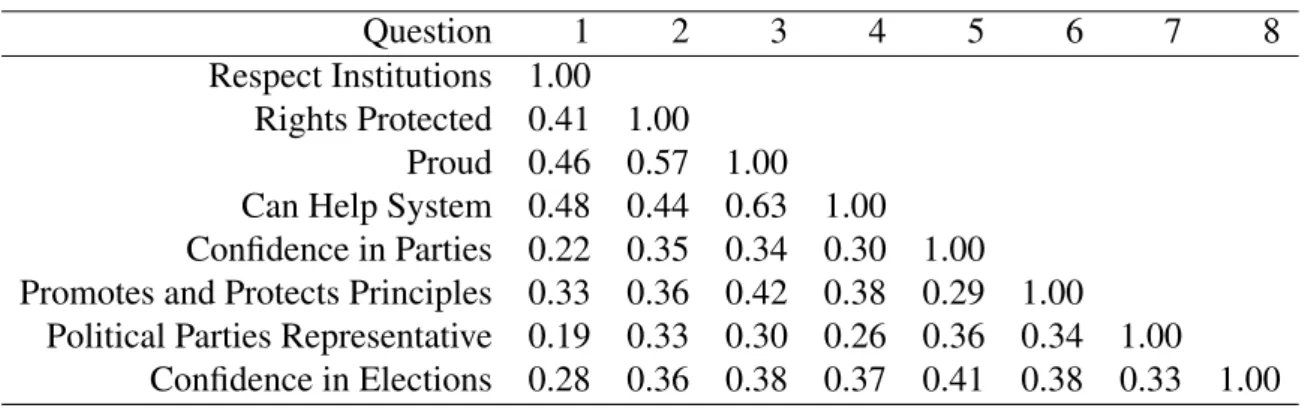
Respondents were asked to rate how much they agree with a series of statements from 1-meaning not at all, to 7- 1-meaning completely. I include the following questions:
1. To what extent do you respect your political institutions? 2. To what point do you have confidence in elections?
3. To what extent do you have confidence in political parties? 4. To what extent do you believe that political parties represent you?
5. To what extent do you believe that your basic rights as a citizen are protected by the political system?
6. To what point do you believe the government promotes and protects democratic prin-ciples?
8. To what extent do you believe that you can help the political system?
I include each of these questions because they reflect trust in electoral dimensions of democracy, representation, and commitment to democratic principles. Questions one and two capture citizens’ feelings about democratic institutions while questions three and four capture how well institutions represent the population. Questions five and six explore whether citizens believe, broadly, that the country upholds democratic standards and re-spects rights. Finally, questions seven and eight consider whether citizens have political efficacy and relative support for their political regime. Combined, these questions create a comprehensive assessment of the level of respect in institutions, the commitment of the po-litical system to upholding democratic principals, belief in democracy at large, and the level of representation in the political system. Each question, therefore, contributes to a compre-hensive understanding of the quality of democracy from both an individual and institutional level.
While the trust variable would benefit from including more information in trust for each branch of government, the ultimate goal of this variable, to capture the quality of democracy, is better realized by focusing on questions concerning the political system at large, institutionalized parties, support for democracy, and efficacy to avoid the instability of trust in weak institutions based on who currently holds power. Question seven might also tap into nationalism, but the benefit of including relative pride for the political system is that it looks at the system at large rather than separating each component part of democracy. The alternative, including questions about support for the presidency, congress, and the supreme court, risks capturing fleeting support based on partisan affiliations or rule of law rather than trust in democracy. Pride in the political system, therefore, taps into feelings about the entire political system. Furthermore, pride in the political system can indicate support for democracy as opposed to alternate forms of government. Similarly, question eight might also tap into optimism, but it explores the degree to which citizens believe their vote holds value.6
This variable is built using an additive index where each question contributes to1/8of the total score for perceptions of the quality of democracy. Using Stata to create this index, I find that the answers track together reliably atα = 0.83. This method creates a continuous scale ranging from 1 to 7 where 1 is no trust in institutions and 7 is the highest level of trust in institutions. The correlation between these eight questions can be seen in Figure 2.
Question 1 2 3 4 5 6 7 8
Respect Institutions 1.00 Rights Protected 0.41 1.00
Proud 0.46 0.57 1.00 Can Help System 0.48 0.44 0.63 1.00 Confidence in Parties 0.22 0.35 0.34 0.30 1.00 Promotes and Protects Principles 0.33 0.36 0.42 0.38 0.29 1.00
Political Parties Representative 0.19 0.33 0.30 0.26 0.36 0.34 1.00 Confidence in Elections 0.28 0.36 0.38 0.37 0.41 0.38 0.33 1.00
Table 2:Correlation Matrix of Component Questions
In addition to a correlation matrix, I run a factor analysis to see if these questions are capturing the same underlying latent variable. The factor analysis shows ambiguity over whether these questions are best represented as one or two factors. The Eigen Test, which is most commonly used, suggests that these components represent two factors with R2
values of 0.72 and 0.61. However, a parallel analysis, optimal coordinates analysis, and acceleration factor test all suggest that these questions are best represented as a single factor with aR2value of 0.84. This suggests that each question is tapping into a single dimension
and can be included in a single index.
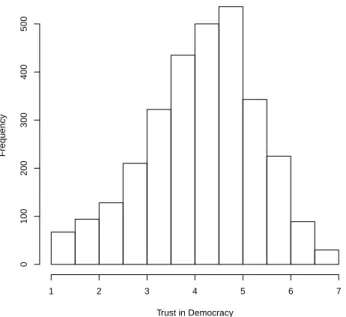
The overall distribution of trust in democratic institutions and processes can be seen in Figure 3 and the municipal variance in the highest and lowest evaluations can be seen in Figure 4. Municipalities range from 0 to 25% of the respondents exhibiting low levels of trust and 0 to just under 30% showing high levels of trust.
Trust in Democracy
Frequency
1 2 3 4 5 6 7
0
100
200
300
400
500
Fig. 3:Distribution of Trust in Democratic Institutions and Processes
Municipality
Propor
tion of Respondents
0.00
0.05
0.10
0.15
0.20
0.25
0.30
(a)Proportion of Respondents With Low
Levels of Trust
Municipality
Propor
tion of Respondents
0.00
0.05
0.10
0.15
0.20
0.25
0.30
(b)Proportions of Respondents With High
Levels of Trust
Fig. 4:Geographic Variance in Responses for Trust in Democratic Institutions and Processes
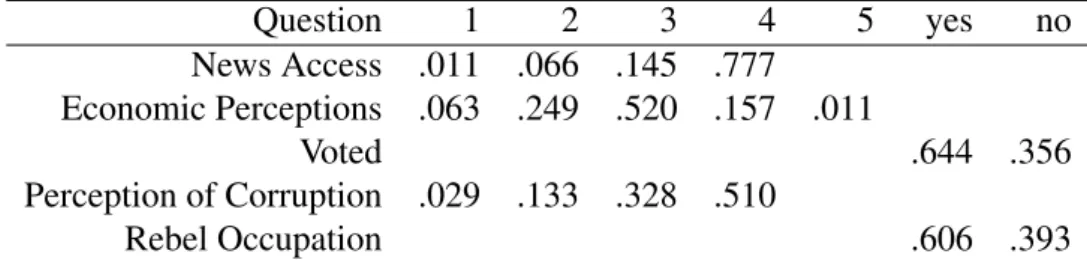
Question 1 2 3 4 5 yes no News Access .011 .066 .145 .777
Economic Perceptions .063 .249 .520 .157 .011
Voted .644 .356
Perception of Corruption .029 .133 .328 .510
Rebel Occupation .606 .393
Table 3:Proportion of Respondents for Each Control
increase in categories corresponds with an increase in how frequently respondents consume the news. In my sample, respondents news access can be found in Table 3, showing that most respondents consume some form of news daily.
For perception of the national economy, I use the question “How would you evaluate the economic situation of (Colombia)?” This question is asked on a 5-point scale where 1 is very good, 2 is good, 3 is neither good nor poor, 4 is poor, and 5 is very poor. I invert this scale so that 5 represents a very good economy. In Table 3, most citizens see the economy as neither good nor poor. Whether a citizen voted is coded as 1 for yes and 0 for no and more than half of the respondents voted in Table 3. I also include a variable for perception of corruption that is coded from 1, not widespread, to 4, very widespread, where most respondents saw corruption as “very widespread” in Table 3. Finally, I use Education as a proxy for income in order to account for the high proportion of missing data on the income question. Education is measured as the last year of schooling that the respondent completed, where most respondents had ten years of schooling in Figure 5.
Years of Education
Frequency
0 5 10 15
0
200
400
600
800
Fig. 5:Distribution of Years of Education
investment four ways: as a one year lag, as the difference between two years to account for change in investment, as average investment over the prior two years, and as average investment from 2004-2008. These categories allow time for any programs or results of the investment to be witnessed and to consider immediate changes in investment. In order to further control for differences between municipalities, I include the logged population of the municipality, the proportion of the population that is rural, and a dummy variable to represent whether a municipality has experienced occupation by a rebel group during the Colombian Civil War.
In most municipalities, only a handful of parties compete, but there are municipalities with up to fourteen independent parties as seen in Figure 6. Many of these elections were also decided by a very small margin of victory, as seen in Figure 7. When evaluating invest-ment, most respondents live in a municipality with low levels of investment in agriculture, political development, and municipal infrastructure while many respondents see high levels of social investment, as seen in Figure 8. The high levels of social investment occur be-cause the limits on transfers from the central government stipulate high levels of investment in health and education.
Number of Parties Competing
Frequency
2 4 6 8 10 12 14
0
100
200
300
400
500
600
Fig. 6:Number of Parties Competing for Mayor
Margin of Victory
Frequency
0 10 20 30 40 50 60
0
200
400
600
800
Per Capita Investment in Agriculture, Pesos(1000)
Frequency
0 5 10 15 20
0
200
400
600
800
(a)Agriculture Investment
Per Capita Investment in Local Political Development, Pesos(1000)
Frequency
0 5 10 15
0
200
400
600
800
(b)Political Development Investment
Per Capita Investment in Social Spending, Pesos(1000)
Frequency
100 200 300 400 500 600 700 800
0
50
100
150
200
250
300
350
(c)Social Investment
Per Capita Investment in Municipal Infrastructure, Pesos(1000)
Frequency
0 50 100 150
0
100
200
300
(d)Municipal Infrastructure Investment
Fig. 8:Investment in Local Programs and Services
perceived level of democracy, I perform an ordered logit model since there are four ordered categories7. However, when testing trust, I use a continuous scale from 1 to 7 and run the multi-level model using Ordinary Least Squares regression.
Process-Based Cues
In order to test the effect of process-based cues on perceptions of the quality of democ-racy, I run the following model:
Quality of Democracy=β0+β1Access to News Media+β2Economic Perception+β3Voted+
β4Education+β5Corruption+β6Number of Parties+β7Parties2+
β8Margin of Victory+β9Population (log)+β10Proportion Rural+
β11Conflict+
(1)
As detailed above, β1 through β4 represent the individual level determinants and β5
through β11 represent municipal-level determinants. Within the multi-level model
frame-work, I allow the intercept to vary by municipality.
In hypothesis 1a, I predict that as the number of candidates competing increases, the perception of quality of democracy increases at first and then decreases. As a result, I expect that the coefficient onβ6Number of Parties will be positive while the coefficient on
β7 Parties2 will be negative. This captures the idea that as more parties enter the political
Results-Based Cues
I follow the same modeling structure when considering results-based cues. Thus, I test the following model:
Quality of Democracy=β0+β1Access to News Media+β2Economic Perception+β3Voted+
β4Education+β5Corruption+β6Population (log)+β7Proportion Rural+
β8Agriculture+β9Agriculture*Rural+β10Political Development+
β11Social Programs+β12Municipal Infrastructure+β13Conflict+
(2)
This model follows the same structure as the model in equation 1. Here, I expect the coefficients onβ8Agriculture,β10Political Development,β11Social Programs andβ12
Municipal Infrastructure will all be positive so that increases in investment correspond with increases in perceptions of the quality of democracy. This follows the expectations outlined in Hypothesis 2.
I control for the effects of individual-level factors. I expect that as perception of the countries economic condition improves, perceptions of quality of democracy will improve. Since income and education are both associated with greater political awareness, I expect that wealthier and more educated citizens will have a lower perception of the quality of democracy so that these coefficients will be negative. Furthermore, citizens with higher perceptions of corruption are likely to have lower evaluations of the quality of democracy. Finally, I expect respondents in municipalities that have higher levels of experience with conflict and larger populations will have lower perceptions of the quality of democracy.
Results and Analysis
I separate my analysis into an analysis of process-based and results-based cues. In each of the models, I allow the intercepts to vary by municipality. Despite the random effects of municipalities, the constant slopes allow me to consider the overall effect of each type of signal that voters receive.
Process-Based Cues
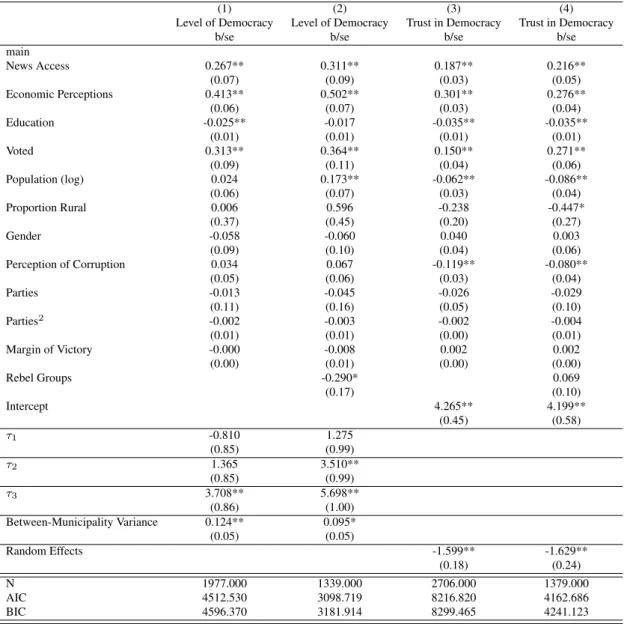
There is limited support that municipal-level electoral cues change citizens perceptions of the quality of national democracy. This is evident in Table 4.
The margin of victory for the winning mayoral candidate is not statistically significant in citizens evaluations of the level of democracy or their trust in democracy. Thus, the level of competitiveness does not appear to alter citizen’s evaluations of democracy.
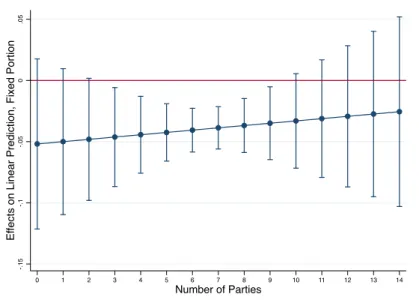
When evaluating the effects of parties, however, I find mixed results. In order to evaluate when the number of parties are statistically significant, I produce marginal effects to account for the changes in the effect of parties across the number of parties. When evaluating the level of democracy, the number of parties are not statistically significant. This implies that the number of parties does not alter perceived levels of democracy.
However, the number of parties has a statistically significant effect on trust in democracy from three through nine parties, as seen in Figure 9. Within this range, an increase in the number of parties competing for mayor has an increasingly negative effect. Since the mean number of parties across municipalities is 5 parties, the results indicate that the majority of respondents find an increase in competing parties decreases their trust in democracy. These results suggest that the increase in parties occurs beyond the observable range and that the squared term is not appropriate8 . The results hold when I control for rebel control of the municipality.
The coefficients on parties and parties squared are both negative. This indicates that,
(1) (2) (3) (4) Level of Democracy Level of Democracy Trust in Democracy Trust in Democracy
b/se b/se b/se b/se
main
News Access 0.267** 0.311** 0.187** 0.216**
(0.07) (0.09) (0.03) (0.05)
Economic Perceptions 0.413** 0.502** 0.301** 0.276**
(0.06) (0.07) (0.03) (0.04)
Education -0.025** -0.017 -0.035** -0.035**
(0.01) (0.01) (0.01) (0.01)
Voted 0.313** 0.364** 0.150** 0.271**
(0.09) (0.11) (0.04) (0.06)
Population (log) 0.024 0.173** -0.062** -0.086**
(0.06) (0.07) (0.03) (0.04)
Proportion Rural 0.006 0.596 -0.238 -0.447*
(0.37) (0.45) (0.20) (0.27)
Gender -0.058 -0.060 0.040 0.003
(0.09) (0.10) (0.04) (0.06)
Perception of Corruption 0.034 0.067 -0.119** -0.080**
(0.05) (0.06) (0.03) (0.04)
Parties -0.013 -0.045 -0.026 -0.029
(0.11) (0.16) (0.05) (0.10)
Parties2 -0.002 -0.003 -0.002 -0.004
(0.01) (0.01) (0.00) (0.01)
Margin of Victory -0.000 -0.008 0.002 0.002
(0.00) (0.01) (0.00) (0.00)
Rebel Groups -0.290* 0.069
(0.17) (0.10)
Intercept 4.265** 4.199**
(0.45) (0.58)
τ1 -0.810 1.275
(0.85) (0.99)
τ2 1.365 3.510**
(0.85) (0.99)
τ3 3.708** 5.698**
(0.86) (1.00) Between-Municipality Variance 0.124** 0.095* (0.05) (0.05)
Random Effects -1.599** -1.629**
(0.18) (0.24)
N 1977.000 1339.000 2706.000 1379.000
AIC 4512.530 3098.719 8216.820 4162.686
BIC 4596.370 3181.914 8299.465 4241.123
-. 1 5 -. 1 -. 0 5 0 .05 Ef fe ct s o n L in e a r Pre d ict io n , F ixe d Po rt io n
0 1 2 3 4 5 6 7 8 9 10 11 12 13 14
Number of Parties
Fig. 9:Marginal Effect of the Number of Parties
3.6 3.8 4 4.2 4.4 4.6 L in e a r Pre d ict io n , F ixe d Po rt io n
0 1 2 3 4 5 6 7 8 9 10 11 12 13 14
Number of Parties
Fig. 10:Predicted Trust in Democracy Across Number of Parties
their trust in institutions from about 4.5 to 4 on the continuous, 7 point scale.
Neither the presence of rebel groups nor the proportion of the municipality that is rural are statistically significant indicators of the level of democracy or trust in institutions at p < 0.05. However, population has an inconsistent effect: when citizens are in larger
municipalities, they tend to see a higher level of democracy and have less trust in democracy. At the individual level, those who consume more news, those with higher perceptions of the national economy, and those who vote tend to have higher perceptions of the level of democracy and trust in democracy while those who are more educated and who see a higher level of corruption tend to see lower levels of democracy and have less trust in institutions.
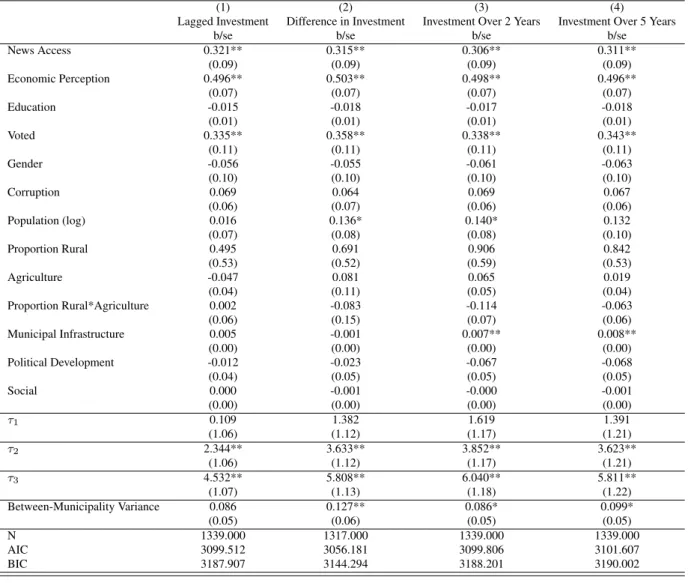
Results-Based Cues
Similar to institutional cues, information concerning democratic outcomes also have mixed effects on the perceived levels of democracy. I run these tests only for individuals’ perceptions in 2008 because there is a shortage of data available for 2010-2012 that prevents me from properly estimating the effects of outcomes on the second wave of surveys.
The outcomes of municipal investment have a different effect on the perceived level of democracy than the trust in democratic institutions. When considering the level of democ-racy, increased investment in municipal infrastructure– composed of investment in prisons, administration, municipal development, municipal spaces, and the justice system–is asso-ciated with increases in the perceived level of democracy. This is evident in Table 5, where investment in municipal infrastructure is positive and statistically significant when aver-aged over the prior two years and averaver-aged over the prior five years. These models account for the delay from increases in spending and the observable effects of this investment that can be witnessed by the population. These results hold when controlling for occupation of rebel groups, although this occupation is not statistically significant 9 . As spending per capita in the municipality increases, the predicted probability in seeing Colombia as “very democratic” also increases.
(1) (2) (3) (4)
Lagged Investment Difference in Investment Investment Over 2 Years Investment Over 5 Years
b/se b/se b/se b/se
News Access 0.321** 0.315** 0.306** 0.311**
(0.09) (0.09) (0.09) (0.09)
Economic Perception 0.496** 0.503** 0.498** 0.496**
(0.07) (0.07) (0.07) (0.07)
Education -0.015 -0.018 -0.017 -0.018
(0.01) (0.01) (0.01) (0.01)
Voted 0.335** 0.358** 0.338** 0.343**
(0.11) (0.11) (0.11) (0.11)
Gender -0.056 -0.055 -0.061 -0.063
(0.10) (0.10) (0.10) (0.10)
Corruption 0.069 0.064 0.069 0.067
(0.06) (0.07) (0.06) (0.06)
Population (log) 0.016 0.136* 0.140* 0.132
(0.07) (0.08) (0.08) (0.10)
Proportion Rural 0.495 0.691 0.906 0.842
(0.53) (0.52) (0.59) (0.53)
Agriculture -0.047 0.081 0.065 0.019
(0.04) (0.11) (0.05) (0.04)
Proportion Rural*Agriculture 0.002 -0.083 -0.114 -0.063
(0.06) (0.15) (0.07) (0.06)
Municipal Infrastructure 0.005 -0.001 0.007** 0.008**
(0.00) (0.00) (0.00) (0.00)
Political Development -0.012 -0.023 -0.067 -0.068
(0.04) (0.05) (0.05) (0.05)
Social 0.000 -0.001 -0.000 -0.001
(0.00) (0.00) (0.00) (0.00)
τ1 0.109 1.382 1.619 1.391
(1.06) (1.12) (1.17) (1.21)
τ2 2.344** 3.633** 3.852** 3.623**
(1.06) (1.12) (1.17) (1.21)
τ3 4.532** 5.808** 6.040** 5.811**
(1.07) (1.13) (1.18) (1.22)
Between-Municipality Variance 0.086 0.127** 0.086* 0.099*
(0.05) (0.06) (0.05) (0.05)
N 1339.000 1317.000 1339.000 1339.000
AIC 3099.512 3056.181 3099.806 3101.607
BIC 3187.907 3144.294 3188.201 3190.002
0 .1 .2 .3 .4 .5 Probability
0 25 50 75 100 125 150 175
Investment Per Capita in Municipal Infrastructure, Pesos(1000)
Not Democratic A Little Democratic
Somewhat Democratic Very Democratic
(a)Lagged Investment(1 year)
0 .1 .2 .3 .4 .5 Probability
-75 -50 -25 0 25 50 75 100 125 150
Investment Per Capita in Municipal Infrastructure, Pesos(1000)
Not Democratic A Little Democratic
Somewhat Democratic Very Democratic
(b)Difference in Investment from 2007 to
2008 0 .1 .2 .3 .4 .5 Probability
0 25 50 75 100 125
Investment Per Capita in Municipal Infrastructure, Pesos(1000)
Not Democratic A Little Democratic
Somewhat Democratic Very Democratic
(c)Average Investment Over Prior 2 Years
(2006 and 2007)
0
.2
.4
.6
Probability
0 25 50 75 100 125 150 175
Investment Per Capita in Municipal Infrastructure, Pesos(1000)
Not Democratic A Little Democratic
Somewhat Democratic Very Democratic
(d)Average Investment Over Prior 5 Years
(2004-2008)
Fig. 11:Probability of Perceived Levels of Democracy Across Investment in Municipal
Infrastruc-ture
(1) (2) (3) (4)
Lagged Investment Difference in Investment Investment Over 2 Years Investment Over 5 Years
b/se b/se b/se b/se
News Access 0.221** 0.218** 0.216** 0.218**
(0.05) (0.05) (0.05) (0.05)
Economic Perception 0.276** 0.281** 0.277** 0.275**
(0.04) (0.04) (0.04) (0.04)
Education -0.036** -0.037** -0.036** -0.035**
(0.01) (0.01) (0.01) (0.01)
Voted 0.268** 0.270** 0.269** 0.265**
(0.06) (0.06) (0.06) (0.06)
Gender 0.006 0.002 0.004 0.002
(0.06) (0.06) (0.06) (0.06)
Perception of Corruption -0.080** -0.084** -0.080** -0.079**
(0.04) (0.04) (0.04) (0.04)
Population (log) -0.104** -0.042 -0.058 -0.111**
(0.04) (0.05) (0.05) (0.05)
Proportion Rural -0.199 -0.185 0.048 -0.318
(0.32) (0.29) (0.35) (0.30)
Agriculture -0.011 0.030 0.034 0.004
(0.03) (0.06) (0.03) (0.02)
Proportion Rural*Agriculture -0.014 -0.028 -0.070 -0.036
(0.04) (0.09) (0.04) (0.03)
Municipal Infrastructure -0.001 0.001 -0.000 0.001
(0.00) (0.00) (0.00) (0.00)
Political Development 0.028 -0.010 0.001 0.024
(0.02) (0.03) (0.03) (0.03)
Social 0.001 -0.001 0.001 0.000
(0.00) (0.00) (0.00) (0.00)
Intercept 4.263** 3.758** 3.624** 4.519**
(0.63) (0.63) (0.69) (0.68)
Random Effects -1.665** -1.590** -1.673** -1.723**
(0.25) (0.24) (0.26) (0.28)
N 1379.000 1357.000 1379.000 1379.000
AIC 4161.089 4099.494 4162.917 4162.285
BIC 4244.755 4182.903 4246.583 4245.951
Table 6:Effect of Quality of Governance Cues on Trust in Democracy
However, investment in agriculture, social programs, and political development do not have a statistically significant effect on perceived levels of democracy. Thus, while I find some support for results-based cues influencing perceptions of the level of democracy, the support is limited to improvements in the municipality and municipal operations.
I focus on 2008 and 2012 because I suspect that during a Presidential election year, the focus will be on national, rather than subnational, cues. Thus, in a presidential year, I would not expect variance in municipalities to effect perceptions of the quality of democ-racy because the primary source of information used to evaluate democdemoc-racy will occur at the national level. When I run the models on 2010, these expectations are supported: process-based cues no longer effect the trust in democratic institutions and no categories of munici-pal investment are statistically significant. Thus, municimunici-pal cues are most important outside of the context of national level changes. 10
Discussion
I find weak support for the role of municipal level cues on perceptions of the quality of democracy in Colombia. Municipal cues do have an influence on citizen’s evaluations, however, these cues do not operate equally across different measures for the quality of democracy. Overall, institutional cues that provide information about the process of demo-cratic governance tend to influence the level of trust that citizens have in democracy while results-based cues, which provide information about the outcomes of democracy, have an effect on perceptions of the overall level of democracy.
Colombia has a multi-party system, where the modal number of parties competing for mayor across respondents was five. My results, however, suggest that once a third party enters a political system, the effect of adding additional parties is negative and statistically significant through nine parties. In this framework, the structure of municipal competition is sending a signal that lowers overall trust in democracy. It is possible that, in addition to lowering trust, the number of candidates competing contributes to the high overall percep-tions of corruption.
Despite these characteristics, the margin of victory does not seem to have an effect on trust in democracy. In my sample, the margin of victory ranges from 0.03% of the vote to 56.73% of the vote. This suggests a large amount of variance in the level of competition
in mayoral elections. People, however, tend to respond more to the number of candidates competing than to the level of competition.
The importance of municipal infrastructure cues may be specific to Colombia. While the presence of rebel groups does not have a statistically significant effect on trust in democ-racy or level of democdemoc-racy, the context of the Colombian civil war may increase the im-portance of a strong justice system and prison system on citizens’ overall perceptions of the level of democracy. Furthermore, one of the components for determining the level of central-government transfers to municipalities is the strength of the municipal infrastruc-ture. Strong municipal infrastructure is necessary to perform daily governance operations during ongoing threats to security and to continue to receive transfers that can be invested elsewhere. Thus, investment in municipal infrastructure likely offers a minimum threshold for outcomes in the same way that elections provide a first threshold for classification as a democracy.
APPENDIX
National Level Cues
National-level cues continue to effect citizens perceptions of democracy. I discounted 2010, due to the national presidential election, since in this information environment. I present the results of each of my main models for 2010. The results change drastically. Municipal elections now take on a “U” shape, rather than the inverted “U” I predicted, but only have statistical significance for three through six parties. This gives limited credibility to an ongoing importance of the 2007 municipal election. When considering outcomes, the difference in municipal spending is the only statistically significant finding.
-. 3 -. 2 -. 1 0 .1 .2 Ef fe ct s o n L in e a r Pre d ict io n , F ixe d Po rt io n
0 1 2 3 4 5 6 7 8 9 10 11 12 13 14
Number of Parties
Fig. 12:Marginal Effect of the Number of Parties
4 4.5 5 L in e a r Pre d ict io n , F ixe d Po rt io n
0 1 2 3 4 5 6 7 8 9 10 11 12 13 14
Number of Parties
Fig. 13:Predicted Trust in Democracy Across Parties
(1) (2)
Level of Democracy Trust in Democracy
b/se b/se
News Access 0.022 0.124**
(0.09) (0.05)
Economic Perception 0.338** 0.365**
(0.06) (0.04)
Education -0.023* -0.022**
(0.01) (0.01)
Voted 0.410** 0.214**
(0.11) (0.06)
Population (log) -0.029 -0.009
(0.06) (0.04)
Proportion Rural 0.036 -0.057
(0.41) (0.26)
Gender 0.024 0.145**
(0.10) (0.06)
Perception of Corruption -0.065 -0.163**
(0.07) (0.04)
Parties 0.051 -0.119
(0.15) (0.09)
Parties2 -0.004 0.006
(0.01) (0.01)
Margin of Victory -0.004 -0.003
(0.01) (0.00)
Intercept 4.009**
(0.59)
τ1 -2.559**
(0.94)
τ2 -0.533
(0.94)
τ3 1.736*
(0.94)
Between-Municipality Variance 0.100*
(0.05)
Random Effects -1.420**
(0.19)
N 1359.000 1400.000
AIC 3146.475 4203.444
BIC 3224.692 4276.863
(1) (2) (3) (4)
Lagged Investment Difference in Investment Investment Over 2 Years Investment Over 5 Years
b/se b/se b/se b/se
News Access 0.027 0.009 0.027 0.030
(0.09) (0.09) (0.09) (0.09)
Economic Perception 0.343** 0.342** 0.341** 0.341**
(0.06) (0.07) (0.06) (0.06)
Education -0.022* -0.020 -0.023* -0.022*
(0.01) (0.01) (0.01) (0.01)
Voted 0.405** 0.423** 0.407** 0.405**
(0.11) (0.11) (0.11) (0.11)
Gender 0.024 0.009 0.025 0.025
(0.10) (0.10) (0.10) (0.10)
Perception of Corruption -0.057 -0.063 -0.068 -0.065
(0.07) (0.07) (0.07) (0.07)
Population (log) -0.125* -0.066 -0.014 -0.048
(0.08) (0.06) (0.08) (0.09)
Proportion Rural -0.248 -0.282 0.365 0.194
(0.54) (0.43) (0.55) (0.61)
Agriculture -0.058 -0.017 0.026 -0.000
(0.04) (0.02) (0.04) (0.04)
Proportion Rural*Agriculture 0.038 0.039 -0.059 -0.037
(0.06) (0.07) (0.06) (0.06)
Municipal Infrastructure -0.002 0.003* 0.000 0.001
(0.00) (0.00) (0.00) (0.00)
Political Development 0.027 -0.020 0.007 0.007
(0.03) (0.03) (0.03) (0.04)
Social 0.001 -0.001 -0.000 -0.000
(0.00) (0.00) (0.00) (0.00)
τ1 -3.729** -3.257** -2.364** -2.862**
(1.09) (0.93) (1.13) (1.20)
τ2 -1.704 -1.235 -0.339 -0.837
(1.08) (0.93) (1.13) (1.20)
τ3 0.564 1.068 1.930* 1.431
(1.08) (0.93) (1.13) (1.20)
Between-Municipality Variance 0.077 0.079 0.097* 0.094*
(0.05) (0.05) (0.05) (0.05)
N 1359.000 1335.000 1359.000 1359.000
AIC 3146.317 3075.068 3149.842 3149.778
BIC 3234.964 3163.412 3238.489 3238.424
(1) (2) (3) (4)
Lagged Investment Difference in Investment Investment Over 2 Years Investment Over 5 Years
b/se b/se b/se b/se
News Access 0.123** 0.126** 0.124** 0.125**
(0.05) (0.05) (0.05) (0.05)
Economic Perception 0.364** 0.375** 0.365** 0.364**
(0.04) (0.04) (0.04) (0.04)
Education -0.023** -0.023** -0.022** -0.023**
(0.01) (0.01) (0.01) (0.01)
Voted 0.219** 0.221** 0.219** 0.216**
(0.06) (0.06) (0.06) (0.06)
Gender 0.144** 0.146** 0.146** 0.146**
(0.06) (0.06) (0.06) (0.06)
Perception of Corruption -0.159** -0.153** -0.159** -0.158**
(0.04) (0.04) (0.04) (0.04)
Population (log) -0.106** -0.068 -0.094* -0.100*
(0.05) (0.04) (0.05) (0.06)
Proportion Rural -0.015 -0.247 0.083 -0.010
(0.35) (0.27) (0.35) (0.39)
Agriculture -0.025 -0.015 -0.012 -0.027
(0.02) (0.02) (0.02) (0.03)
Proportion Rural*Agriculture -0.003 0.029 -0.024 -0.004
(0.04) (0.05) (0.04) (0.04)
Municipal Infrastructure -0.001 0.003** -0.001 0.001
(0.00) (0.00) (0.00) (0.00)
Political Development 0.035* -0.005 0.031 0.021
(0.02) (0.02) (0.02) (0.02)
Social 0.001 -0.000 0.001 0.000
(0.00) (0.00) (0.00) (0.00)
Intercept 4.497** 4.254** 4.299** 4.466**
(0.71) (0.59) (0.71) (0.78)
Random Effects -1.499** -1.523** -1.456** -1.430**
(0.21) (0.21) (0.20) (0.20)
N 1400.000 1376.000 1400.000 1400.000
AIC 4204.217 4133.137 4206.296 4207.955
BIC 4288.125 4216.768 4290.203 4291.863
Robustness Checks
(1) (2) (3) (4)
Level of Democracy Level fo Democracy Trust in Democracy Trust in Democracy
b/se b/se b/se b/se
News Access 0.267** 0.311** 0.187** 0.216**
(0.07) (0.09) (0.03) (0.05)
Economic Perception 0.413** 0.502** 0.301** 0.276**
(0.06) (0.07) (0.03) (0.04)
Education -0.025** -0.017 -0.035** -0.035**
(0.01) (0.01) (0.01) (0.01)
Voted 0.312** 0.364** 0.150** 0.271**
(0.09) (0.11) (0.04) (0.06)
Population (log) 0.025 0.176** -0.061** -0.081*
(0.06) (0.07) (0.03) (0.04)
Proportion Rural 0.000 0.602 -0.245 -0.438
(0.37) (0.45) (0.20) (0.27)
Gender -0.059 -0.060 0.040 0.002
(0.09) (0.10) (0.04) (0.06)
Perception of Corruption 0.034 0.067 -0.119** -0.080**
(0.05) (0.06) (0.03) (0.04)
Parties -0.039 -0.079** -0.049** -0.021
(0.03) (0.04) (0.01) (0.02)
Margin of Victory -0.000 -0.008 0.002 0.002
(0.00) (0.01) (0.00) (0.00)
Rebel -0.296* 0.060
(0.16) (0.10)
Intercept 4.319** 4.276**
(0.43) (0.56)
τ1 -0.870 1.224
(0.82) (0.96)
τ2 1.305 3.459**
(0.82) (0.96)
τ3 3.648** 5.647**
(0.82) (0.97) Between-Municipality Variance 0.125** 0.095* (0.05) (0.05)
Random Effects -1.596** -1.622**
(0.18) (0.24)
N 1977.000 1339.000 2706.000 1379.000
AIC 4510.588 3096.765 8215.022 4160.980
BIC 4588.839 3174.760 8291.764 4234.188
(1) (2) (3) (4) Level of Democracy Level of Democracy Trust in Democracy Trust in Democracy
b/se b/se b/se b/se
News Access 0.267** 0.307** 0.191** 0.221**
(0.08) (0.10) (0.04) (0.05)
Economic Perceptions 0.411** 0.501** 0.306** 0.282**
(0.06) (0.07) (0.03) (0.04)
Education -0.025** -0.018 -0.035** -0.036**
(0.01) (0.01) (0.01) (0.01)
Voted 0.321** 0.389** 0.154** 0.282**
(0.09) (0.11) (0.04) (0.06)
Population (log) 0.018 0.122** -0.064** -0.079**
(0.03) (0.05) (0.02) (0.03)
Proportion Rural -0.030 0.429 -0.280** -0.475**
(0.28) (0.34) (0.14) (0.19)
Gender -0.054 -0.057 0.040 0.003
(0.09) (0.10) (0.04) (0.06)
Perception of Corruption 0.035 0.068 -0.128** -0.084**
(0.06) (0.07) (0.03) (0.04)
Parties -0.003 -0.073 -0.022 0.017
(0.09) (0.12) (0.05) (0.07)
Parties2 -0.004 0.000 -0.002 -0.003
(0.01) (0.01) (0.00) (0.01)
Margin of Victory -0.002 -0.006 0.000 0.000
(0.00) (0.00) (0.00) (0.00)
Rebel -0.279** 0.065
(0.13) (0.08)
Intercept 4.296** 4.185**
(0.31) (0.43)
τ1 -0.863 0.686
(0.61) (0.75)
τ2 1.289** 2.901**
(0.61) (0.74)
τ3 3.584** 5.050**
(0.61) (0.75)
N 1977.000 1339.000 2706.000 1379.000
AIC 4520.421 3103.918 8228.213 4166.671
BIC 4598.672 3181.914 8299.052 4234.650
(1) (2) (3) (4)
Lagged Investment Difference in Investment Investment Over 2 Years Investment Over 5 Years
b/se b/se b/se b/se
News Access 0.319** 0.311** 0.303** 0.310**
(0.09) (0.09) (0.09) (0.09)
Economic Perception 0.495** 0.505** 0.498** 0.496**
(0.07) (0.07) (0.07) (0.07)
Education -0.015 -0.018 -0.017 -0.017
(0.01) (0.01) (0.01) (0.01)
Voted 0.336** 0.361** 0.339** 0.344**
(0.11) (0.11) (0.11) (0.11)
Gender -0.054 -0.052 -0.060 -0.061
(0.10) (0.10) (0.10) (0.10)
Perception of Corruption 0.073 0.068 0.072 0.069
(0.06) (0.07) (0.06) (0.06)
Population (log) 0.068 0.230** 0.192** 0.186*
(0.08) (0.09) (0.08) (0.10)
Proportion Rural 0.834 1.187** 1.272** 1.228**
(0.56) (0.56) (0.62) (0.57)
Agriculture -0.042 0.092 0.073 0.022
(0.04) (0.11) (0.05) (0.04)
Proportion Rural*Agriculture -0.010 -0.102 -0.130* -0.079
(0.06) (0.15) (0.07) (0.06)
Municipal Infrastructure 0.004 -0.002 0.006** 0.007*
(0.00) (0.00) (0.00) (0.00)
Political Development -0.009 -0.032 -0.065 -0.062
(0.03) (0.05) (0.05) (0.05)
Social 0.000 -0.002 -0.000 -0.000
(0.00) (0.00) (0.00) (0.00)
Rebel -0.246 -0.366** -0.245 -0.286*
(0.16) (0.18) (0.16) (0.17)
τ1 0.712 2.368** 2.260* 1.987
(1.11) (1.19) (1.22) (1.24)
τ2 2.946** 4.618** 4.494** 4.219**
(1.11) (1.19) (1.23) (1.24)
τ3 5.134** 6.792** 6.681** 6.407**
(1.11) (1.20) (1.23) (1.25)
Between-Municipality Variance 0.074 0.105* 0.076 0.087*
(0.05) (0.06) (0.05) (0.05)
N 1339.000 1317.000 1339.000 1339.000
AIC 3099.122 3054.265 3099.460 3100.732
BIC 3192.717 3147.561 3193.054 3194.326
Table 12:Effect of Quality of Governance Cues on Level of Democracy, Including Rebel
(1) (2) (3) (4)
Lagged Investment Difference in Investment Investment Over 2 Years Investment Over 5 Years
b/se b/se b/se b/se
News Access 0.320** 0.311** 0.298** 0.305**
(0.10) (0.10) (0.10) (0.10)
Economic Perception 0.492** 0.501** 0.495** 0.492**
(0.07) (0.07) (0.07) (0.07)
Education -0.016 -0.020 -0.018 -0.019
(0.01) (0.01) (0.01) (0.01)
Voted 0.328** 0.363** 0.331** 0.341**
(0.11) (0.11) (0.11) (0.11)
Gender -0.048 -0.046 -0.056 -0.058
(0.10) (0.10) (0.10) (0.10)
Perception of Corruption 0.072 0.063 0.070 0.069
(0.07) (0.07) (0.07) (0.07)
Population (log) 0.010 0.115** 0.129** 0.112
(0.05) (0.06) (0.06) (0.08)
Proportion Rural 0.484 0.604* 0.878* 0.769*
(0.41) (0.36) (0.46) (0.43)
Agriculture -0.042 0.065 0.065 0.018
(0.04) (0.09) (0.04) (0.03)
Proportion Rural*Agriculture -0.003 -0.058 -0.113* -0.061
(0.05) (0.12) (0.06) (0.04)
Municipal Infrastructure 0.005** -0.001 0.007** 0.007**
(0.00) (0.00) (0.00) (0.00)
Political Development -0.014 -0.030 -0.058* -0.064*
(0.03) (0.04) (0.03) (0.04)
Social 0.000 -0.001 -0.000 -0.000
(0.00) (0.00) (0.00) (0.00)
τ1 0.063 1.124 1.483 1.162
(0.81) (0.82) (0.94) (0.99)
τ2 2.281** 3.349** 3.700** 3.375**
(0.81) (0.82) (0.94) (0.99)
τ3 4.436** 5.476** 5.854** 5.525**
(0.81) (0.82) (0.95) (1.00)
N 1339.000 1317.000 1339.000 1339.000
AIC 3101.709 3063.042 3102.275 3105.487
BIC 3184.904 3145.972 3185.470 3188.682