AN EMPIRICAL ANALYSIS OF INCENTIVE CLAUSES AND PERFORMANCE AMONG HEAD COACHES AT NCAA FOOTBALL BOWL SERIES PUBLIC INSTITUTIONS
John J. Dougherty Jr.
A thesis submitted to the faculty of the University of North Carolina at Chapel Hill in partial fulfillment of the requirements for the degree of Master of Arts in the Department of Exercise and
Sport Science (Sport Administration) Chapel Hill
2014
Approved By:
©2014
ABSTRACT
JOHN J. DOUGHERTY JR.: AN EMPIRICAL ANALYSIS OF INCENTIVE CLAUSES AND PERFORMANCE AMONG HEAD COACHES AT NCAA FOOTBALL BOWL SERIES PUBLIC INSTITUTIONS
(Under the direction of Barbara Osborne)
The trend of increased compensation among college football head coaches has been well documented. (Brady, E., Berkowitz, S., & Upton, J., 2012). Along with increased compensation have come elaborate contract dynamics and incentive clauses that reward coaches for academic and athletic performance. (Reynolds, 2012).
The purpose of this study was to quantify the prevalence of incentive clauses in coaching contracts and determine incentive clauses’ effect on athletic and academic performance.
This study analyzed 747 contract years from 78 public, FBS member institutions from 2002-2012. Contract data was compared to athletic and academic performance information to determine whether incentive presence and/or size significantly affected performance outcomes.
ACKNOWLEDGEMENTS
Thank you to all of the wonderful individuals who have invested in my life and supported me throughout this research project. Among the many, these persons require special mention:
My thesis advisor, Barbara Osborne, for inspiration and guidance throughout my academic journey. You provided the keen eye and direction necessary to make the entire thesis experience both productive and enjoyable.
Paul Pogge, for devoting your time, energy, and support into helping me accomplish so many goals over the past year. I hope to repay your kindness by always striving to be my best and paying my good fortune forward.
Erianne Weight, for uniquely unyielding enthusiasm. Your energy and optimism is
unmatched among everyone I know. You gave me the confidence to believe in myself and accept a great challenge.
My classmates for always accepting the person I am and encouraging me to become the person I aspire to be.
My fiancée, Tiffany, whose contribution to my life might never properly be acknowledged. I will forever appreciate the splendor and purpose with which you fill my every day.
TABLE OF CONTENTS CHAPTER
I. INTRODUCTION ... 1
1. BACKGROUND ... 1
2. PURPOSE ... 3
3. RESEARCH QUESTIONS... 3
4. HYPOTHESIS ... 4
5. DEFINITION OF TERMS... 4
6. LIMITATIONS... 7
7. DELIMITATIONS... 7
8. ASSUMPTIONS... 7
9. SIGNIFICANCE OF STUDY... 7
II. REVIEW OF LITERATURE... 10
1. PRIOR COACHING COMPENSATION ANALYSIS... 10
2. THEORETICAL BASES... 14
i. UNILATERAL CONTRACT THEORY... 14
ii. AGENCY THEORY... 15
iii. INSTITUTIONAL ISOMORPHISM... 17
III. METHODOLOGY... 20
1. SURVEY INSTRUMENT... 20
2. DRAWING THE SAMPLE... 21
4. CONTRACT CONTENT ANALYSIS... 22
5. HISTORICAL RECORD ANALYSIS... 24
6. STATISTICAL ANALYSIS... 24
IV. RESULTS... 26
1. INCENTIVE CLAUSE FREQUENCY AND SIZE... 26
2. EFFECT OF INCENTIVE CLAUSE PRESENCE... 31
3. EFFECT OF INCENTIVE CLAUSE SIZE... 35
4. SUPPLEMENTAL RESULTS... 40
V. DISCUSSION... 46
1. SUMMARY... 46
2. INCENTIVE CLAUSE ATTRIBUTES... 46
3. EFFECT OF INCENTIVE PRESENCE... 49
4. EFFECT OF INCENTIVE SIZE... 51
5. SUPPLEMENTAL RESULTS... 52
6. RECOMMENDATIONS... 56
7. FURTHER RESEARCH ... 57
APPENDIX A ... 58
APPENDIX B... 61
APPENDIX C... 62
APPENDIX D... 64
APPENDIX E... 66
APPENDIX F... 86
LIST OF TABLES
Table 1 - Incentive Frequency and Completion Rate... 27
Table 2 - Incentive Frequency by Year... 28
Table 3 - Incentive Size by Type... 29
Table 4 - Total Incentive Offerings in Dollars and Relative to Total Compensation... 31
Table 5 - Effect of Incentive Presence ... 32
Table 6 - Effect of APR Incentive Presence... 35
Table 7 - Non Significant Incentive Presence... 35
Table 8 - Significant Incentive Size t-tests... 37
Table 9 - Non Significant Incentive Size in Dollars ... 38
Table 10 - Non Significant Relative Incentive Size... 39
Table 11 - Academic Incentive Size in Dollars... 40
Table 12 - Average Incentive Frequency and Size by Conference ... 41
Table 13 - Incentive Frequency by Conference and Season... 41
Table 14 - Incentive Attributes v. Total Compensation... 43
Graph 1 – Incentive Dollars Offered v. Total Compensation... 43
Graph 2 – Average Number of Incentives vs. Total Compensation ... 44
Graph 3 – Relative Size of Incentive Offer vs. Total Compensation... 44
Table 15 - Season Winning Percentage vs. Total Compensation ... 45
CHAPTER I: INTRODUCTION I-1. BACKGROUND
When Charlie Strong signed an eight-year contract extension to remain the head football coach at the University of Louisville in January 2013, the University made a large investment in Strong’s abilities; an investment to the tune of $3.7 million dollars in annual base salary. While that figure might seem staggering in a vacuum, it was likely in line with the market value, as data indicate 43 FBS head football coaches made $2 million or more in 2012 (Brady, Berkowitz, & Upton, 2012). Also, Strong’s Cardinals had just completed an 11-2 season, earned a share of the Big East Conference title, and won the school’s first ever Sugar Bowl (Staples, 2013). The pay raise made Strong the seventh highest paid active coach in college football and the highest paid coach outside the Southeastern, Big 12, and Big Ten conferences (Associated Press, 2013). The University was undoubtedly impressed by Strong’s accomplishments and was willing to pay him even more for a repeat performance.
Strong’s contract extension included several performance-based incentives, including a bonus of
$308,333 for reaching a postseason bowl; $25,000 for winning the conference championship; up to
$50,000 for a top-10 ranking; $100,000 for reaching a BCS bowl; and another $100,000 if Louisville
wins the BCS championship (Associated Press, 2013).
Strong is far from the only FBS coach whose contract includes incentive bonuses on top of base
salary. A 2011 study of 84 FBS head coaching contracts found that in 2006 almost 93% of contracts
included some form of incentive (Wilson, Schrager, Burke, Hawkins, & Gauntt, 2011). The most common form of bonus rewarded on-field performance with an average incentive value of $313,187.
More than half of contracts also included an incentive for the team’s academic performance, at an
Examples of recent incentive-based bonuses dot the national map. In the PAC-12, Arizona
State’s Todd Graham earns as much as $150,000 if ASU reaches certain academic standards and up to $750,000 for winning the BCS national championship. Colorado’s Mike MacIntyre can earn $50,000 for winning seven regular games and $25,000 more for an eighth regular-season win. In the Big Ten, Ohio State’s Urban Meyer makes $4 million in guaranteed salary, but also receives $100,000 for meeting APR requirements and up to an extra $400,000 for appearing in the national title game. The incentive clauses don’t appear to benefit only head coaches, though. They can also be a way for schools to hedge their bets during contract negotiations. Clemson President James F. Barker
conceptualized contracts incentives as a way of managing salary commitments as opposed to simply paying more in base salary and hoping for better results (Brady, et. al., 2012).
But do these incentive clauses actually work? Are they truly motivators that prod coaches to achieve otherwise less-likely goals, or do they simply serve as rewards that schools can use to defer additional salary payment until a coach’s potential is realized? Further, might it be possible that, regardless of whether they act as motivators or rewards, monetary incentives may not be the optimal form of compensation for FBS head coaches? In other words, does Urban Meyer truly value an extra $100,000 on top of his annual $4 million salary, or is there a more efficient way that Ohio State could serve Meyer’s interests?
compensation pool for assistants has more than doubled from $1.9 million in 2009 to $4.2 million
thanks in large part to Swinney agreeing to take less in bonuses. Clemson offensive coordinator
Chad Morris, making $1.3 million, is the nation's most highly paid assistant at a public school.
Morris also has an escalator clause in his contract stipulating that he be paid the average of the
nation's two highest-paid offensive coordinators when the Tigers finish in the top five of total
offense, or the average pay of the top three for finishing in the top 10 (Brady, et. al., 2012).
Clemson’s model is one example of reallocating monetary resources in an attempt to
maximize the chances of success. Consciously or not, Clemson athletic director Dan Radakovich has
challenged conventional logic by not focusing on compensating his head coach. Perhaps there are
other similar opportunities for cost-savings and resource efficiency within coach compensation
practices. This study aims to explore that question in regards to incentive clauses by investigating
their correlation with success.
I-2 PURPOSE OF THE STUDY
The purpose of this study is to identify the level of correlation and/or effect between
incentive clauses (both academic and athletic) in FBS head coaching contracts and achievement of
the performance goals those clauses are intended to encourage. In doing so, the study will also
describe and quantify the prevalence and attributes of incentive clauses in FBS head coaching
contracts.
I-3 RESEARCH QUESTIONS
1. What are the most common types of incentives present in head football coaching contracts? 2. What types of athletic or academic performance measures are most highly monetarily
incented by contract incentive clauses?
4. Does the presence of academically related incentive clauses in head coach employment contracts have an effect on the team’s academic performance?
5. Does the size (in real dollars and in comparison to total salary) of athletically related incentive clauses in head coach employment contracts have an effect on the team’s athletic performance?
6. Does the size (in real dollars and in comparison to total salary) of academically related incentive clauses in head coach employment contracts have an effect on the team’s academic performance?
I-4 HYPOTHESES
The overwhelming prevalence of incentive clauses currently present in contracts provides evidence that administrators among FBS schools believe performance-based bonuses positively impact the likelihood of a team achieving success. The research hypothesis in conducting this study was that this positive correlation will be very weak, if at all existent. With so many bonuses currently offered and the great magnitude of annual salaries among successful coaches, it seems unlikely that additional performance-based incentives have a strong impact on a program’s motivation.
I-5 DEFINITION OF TERMS
National Collegiate Athletic Association (NCAA): The major governing body of intercollegiate sport competition
Division I (DI): The most competitive of the NCAA’s three divisions.
Bowl Championship Series (BCS): A selection system relying on a combination of polls and computer selection methods to determine bowl game participants. Employed by FBS football schools and conferences from 1998 until 2014. (The BCS Is…, 2013)
Performance-based incentive (incentive clause): Compensation enumerated within a coach’s employment contract above total salary and perquisites, which comes due only upon the completion of a stated individual or team goal.
Coach: Head football coach of a public National Collegiate Athletic Association Football Bowl Series member institution.
Academic Incentives: Relating to a team’s curricular educational matriculation, graduation, and performance.
Athletic Incentives: Related to a team’s or coach’s on-field football performance (win/loss, standings, statistics, postseason bowl) or renown derived from football performance (awards or rankings).
Guaranteed Compensation: All compensation due to a coach under the terms of the contract during the contract year, but excluding one-time bonuses and deferred compensation. This figure does not include any contingent compensation such as amounts paid for completion of incentive bonuses.
Agency Theory: Theoretical model that attempts to explain the relationship between agents and principals. Concerned with resolving problems arising when principal are unable to monitor agents’ efforts and when principals and agents have different attitudes toward risk.
Institutional Isomorphism: A similarity of the processes or structure of one organization to those of another by result of imitation or operating under similar conditions.
Codebook: The basic document for content analysis; a record of all variables and the amount of times in an article a variable is coded.
Winning percentage: The fraction of games a team has won. It is defined as wins divided by wins plus losses. Historical winning percentages will be retrieved from the NCAA FBS database.
Academic Progress Rate (APR): A term-by-term measure of eligibility and retention for Division I student-athletes that was developed as an early indicator of eventual graduation rates. (NCAA, 2013)
Graduation Success Rate (GSR): NCAA developed measure designed to show the proportion of student-athletes on any given team who earn a college degree or end their enrollment in good academic standing. (What is the Graduation Success Rate?, 2014)
Associated Press Poll: A weekly ranking of college football teams by a panel of 60 sports writers and broadcasters (Associated Press, 2014)
National Coach of the Year: Recognition by any or all of five prominent voting memberships (Bryant, Robinson, AFCA, Dodd, Camp), tasked with determining the nation’s best collegiate football coach each season.
I-6 RESEARCH LIMITATIONS
This study considers only monetary incentives based on performance captured or able to be completed within a single football season. The study considers only incentives that pay a distinct dollar amount and does not include incentives that specify for a coach’s compensation to increase to a particular point (i.e. top three in the nation.) This study is limited to on-field athletic performance measures and academic performance measures. Though they exist, this study does not include other program-related performance incentives such as ticket sales and game attendance.
I-7 RESEARCH DELIMITATIONS
This study will account only for coaches at public schools with the NCAA’s Football Bowl Series. Because coaches’ contracts from private institutions are not publically available, their terms are not included within this study. Because public and private institutions both compete within the market for coaches, it is likely that trends reported in this study may be exhibited by private institutions as well.
This study will investigate an eleven-season span, 2002-2012. While more time would allow for a more complete analysis of trends, eleven years may be adequate to discover the most pertinent recent developments.
I-8 RESEARCH ASSUMPTIONS
The terms disclosed in the written contracts obtained from institutions through public records requests are complete and accurate representations of the agreements between coaches and institutions. Historical athletic and academic performance data reported by the NCAA will be complete and accurate.
I-9 SIGNIFICANCE OF STUDY
to fulfill numerous and varied goals (i.e. winning games, educating students, creating participation opportunities), administrators are forced to make decisions about how money and other resources will be assigned. This study will be useful in its ability to quantify the utility of contract incentive clauses. By gaining a fuller understanding of the return athletic departments can expect from their
contractual guarantees, schools may be better positioned to invest resources more efficiently and
effectively.
Assuming the level of correlation between money assigned to potential incentives and the likelihood of realizing positive results can be identified, schools will be better able to account for risk. This study will have significance for at least five types of actors. First, a school contracting with a coach for services is the primary actor targeted by this research, which has the potential to inform decision-making. Likewise, coaches will be impacted because this research will result in information that can be utilized in contract negotiations. Tangentially, any additional parties working to broker the contract (attorneys or agents) may be affected as this research could impact the terms of the agreement. Fourth, schools and teams competing with the contracting school will be affected. If an athletic department is able to make more efficient use of its resources, that net benefit will spread to all aspects of its operation and theoretically result in more competitive teams. Finally, all NCAA member institutions could be affected directly and/or indirectly by this research. Schools will either internalize these results and revise their decision-making or they will experience the market effects of others’ changes. Regardless of how the change comes about, this research would have the potential to shift the economics of intercollegiate coaching contracts.
CHAPTER II: LITERATURE REVIEW
II-1 PRIOR COACHING COMPENSATION ANALYSIS
Research during the past decade has found a trend of increased revenues and expenditures within high-level intercollegiate athletics (Denhart & Vedder, 2010). Empirical evidence has demonstrated institutional propensity for devoting greater resources toward attracting and maintaining qualified and successful coaches in revenue-producing sports, such as football and basketball (Farmer & Pecorino, 2010). The shift in resource allocation is highly evident in the terms of coaching employment contracts (Berkowitz, Upton, & Schnaars, 2013). Either caused by or coinciding with greater coaching salaries, research regarding coaching contracts has also grown during the past few decades. Studies in the area of collegiate coach compensation have become increasingly more complex.
coaches, such as fundraising and public relations, and increased rates of turnover in the profession to justify increases in compensation that were already evident in the early 1990s. Ultimately, Greenberg’s work was instructional as a guide to various types of clauses that coaches and schools were employing to hedge financial risk and plan for unsavory contingencies (Greenberg, 1992). Later, Maddux took a reverse-engineering approach to contract analysis by focusing on the contract clauses that best protected each party and caused the most eventual conflict between contracting parties (Maddux, 2010). Maddux found that, rather than becoming more simplified thanks to 20 years of experience since Greenberg’s seminal work, coaches and schools were drafting still more complex agreements and positioning themselves for eventual termination even before relationships were formalized (Maddux, 2010). More specifically, Maddux found that the most common sources of litigation stemming from contracts between coaches and schools were liquidated damages clauses and disputes over termination with or without cause (Maddux, 2010). Both of these types of
provisions speak to the interests of risk reduction served by contract as well as both parties’
understanding that coaching relationships can often resemble business transactions. Finally in 2012, Reynolds, implemented a quantitative content analysis to examine the components of 91 head football coaches at FBS schools. The analysis coded for 31 distinct contract components, such as duties, terms of employments, and rollover provisions. Reynolds found that 12 of the 31 provisions used in the study were present in most every contract. The primary contractual components
A second brand of studies has also emerged in which researchers sought to quantify coaching salaries and benefits. Instead of simply charting the landscape of contract language, these studies typically charted the growth of coaches’ income by comparing contemporary figures to historical amounts or by comparing coaching salaries in one field to those in another (Wilson, Schrager, Burke, Hawkins, & Gauntt, 2011). By and large, these types of studies found that the amount of resources devoted to coach employment was steadily increasing, especially as the responsibilities and stakes placed on coaches grew. In 2013, Wilson and Burke studied NCAA division I men’s basketball coaching contracts and found that coaches in non-automatic qualifying conferences received an 87.5% increase in average annual pay from 2009 to 2012. Wilson and Burke concluded that the same coaches were eligible for more than 1000% as much money in academic incentive payments (2013). In 2007, Martin Greenberg continued his contributions to the field by studying NCAA Division I assistant basketball coach contracts and found “an increased recognition of the important of good assistant coaches” which has resulted in rising assistant coach
compensation (Greenberg, 2007, p. 27). Greenberg found a compensation disparity between larger and smaller athletic programs. He also discovered a compensation disparity between football and basketball assistant coaches with Division I football coaches' compensation rising fastest. Popular media also regularly contributes studies charting the growth in college football coaching
compensation. USA Today has provided near-annual updates to their salary database with fresh batches of stories regarding skyrocketing salaries (Berkowitz, 2013). It was reported in 2013, that NCAA head football coaches were earning more than 10% more than in 2012 and 90% more than in 2006 (Grasgreen, 2013).
NCAA FBS head football coaches, and found that the level of total compensation can be greatly explained by both institutional characteristics such as organizational size and coaches’ characteristics like coaching experience. Then, in 2010, Inoue used success criteria previous identified in literature (Putler & Wolfe, 1999) — academic performance, on-field performance, behavior of student athletes, and revenue performance — to evaluate compensation determinants. Inoue’s analyses showed that two organizational characteristics, BCS membership and athletic revenues, had a significant positive effect on both on-field performance incentives and total incentives (Inoue, 2010). The analysis also investigated incentive clauses and found that 78 of the 84 contracts (92.9%) contained some type of incentives with the average total incentive of $343,747. With respect to the extent of each category used, on-field performance was the most frequently used category, appearing in all 78 contracts (92.9%), followed by academic performance with 45 contracts (53.6%), revenue performance with 23 (27.4%), and student athlete behavior with 3 (3.6%). On-field performance was also the most highly valued category for incentive payments with a mean value of $313,187,
compared to $22,673 for academic performance, $18,500 for revenue performance, and $2,417 for student-athlete behaviors (Inoue, et. al., 2011).
market about future performance. Likewise, Humphrey found significant differences between the coach’s winning percentage in his current position, career winning percentage, number of career wins, and average attendance, between high compensation contracts and low compensation contracts (Humphrey, 2011).
The area where these past studies have yet to investigate is where this current study intends to explore. The object of this study is to quantify the effectiveness of incentive clauses in FBS head football coach contracts. Whereas previous contract analyses have considered external factors such as athletic and academic performance in attempting to explain compensation magnitude and/or frequency, this study will employ the opposite approach and treat compensation levels, more specifically incentive offers, as independent variables. By analyzing incentive offers alongside documented performance, this study aims to determine effectiveness of incentive clauses. This approach will empower decision-makers with useful knowledge that can be utilized when allocated limited resources.
II-2 THEORETICAL BASES
The research will be guided by the use of three distinct research theories: unilateral contract
theory, agency theory, and institutional isomorphism. Unilateral contract theory will explain the
benefits schools gain by making promises to coaches that can be fulfilled only by action, rather than
a reciprocal promise. Agency theory will be used to explore the tension that exists in relationships
between principals and agents and how both parties can work to minimize risk. Finally, the theory of
institutional isomorphism will potentially explain why incentive clauses have become so common in
collegiate sport, regardless of their objectively-measured worth.
i. UNILATERAL CONTRACT THEORY
in which one contracting party makes an enforceable promise in exchange for another party’s future action. The theory underlying these exchanges posits that situations arise in which a contracting party places far less value on a reciprocal promise than they do on future performance (Ames, 1899). “When an act is wanted in return for a promise, a unilateral contract is created when the act is done” (Wormser, 1916, p. 136). Like a traditional bilateral contract, which is created by two or more parties exchanging promises, unilateral contracts are enforceable in court. They are the preferable form of contract for an incentive clause, for instance, because the school’s obligation to pay an incentive bonus will come due only when the coach has performed the desire action that is specified by the contract. The coach is never bound to perform the action and, until performance is rendered, the school is not obligated to pay. While this is not a conceptually difficult or controversial application of the theory of unilateral contract, the existence of binding unilateral contracts allows for incentive payment schemes to be employed and legally enforced. It is unlikely that an incentive clause, or a bonus clause of any type to go even further, would take the form of a traditional bilateral contract. Simply stated, a coach’s promise to apply his or her best efforts is of little value to a school beyond the salary that the coach will already be paid. Further, it is questionable under contract theory whether a coach’s mere promise is sufficient to entitle him or her to incentive payment, as best effort is already a condition of the underlying contract and not a new burden. Therefore, unilateral contract formation appears the only conceivable route for effective incentive clause formation.
ii. AGENCY THEORY
but research has also suggested that incentive arrangements have the potential to reduce these harms.
The seminal research in this field is widely considered to be that of Jensen and Meckling (1976) who suggested that the chief goal of compensation agreements is to create incentives that motivate agents to align their goals with principals. Jensen, Murphy and Wruck (2004) later hedged this advice by warning that compensation can be a solution to agency problems, but improper compensation may also increase agency problems. The fear, as the authors found, is that
ill-conceived incentives can actually motivate unproductive behavior or agents may behave unethically in order to complete incented goals. Humphrey explains:
A compensation agreement providing the agent with guaranteed compensation may lead to inefficiencies and overall poor performance, to the detriment of the principal. On the other hand, a compensation agreement providing only performance incentives may entice the principal to manipulate earnings, revenues, or any other performance measure upon which the agent’s compensation is based” (Humphrey, 2011, p. 8).
In fact, Healy (1985) indicates that bonus incentives are only effective in aligning managers’
interests with the interests of shareholders when they are close to meeting bonus criteria. If a goal is too far from being achieved, it may not be viewed as feasible and will not affect productivity. In response to the threat of unethical behavior on the part of agents, Jensen, Murphy, and Wruck (2004) suggest that increased governance, oversight, or enforcement systems are necessary.
as agency-principal incentives. A greater understanding of the agreements’ true purpose for both parties may be achieved by studying the rate of fulfillment and return on the promises.
iii. INSTITUTIONAL ISOMORPHISM
Finally, the theory of institutional isomorphism will be used to help explain why similarly situated actors in an industry behave similarly. Generally, the theory has posited that actors
occasionally may forsake their own objective best interests in order to follow established institutional logic and mirror the actions of their peers (DiMaggio & Powell, 1983). Rather than risk untested, potentially beneficial behavior, actors will behave in established ways as a means of exuding legitimacy and avoiding criticism.
The theory will be tested as a means of resolving a simple question: Why do so many schools so consistently offer incentive bonuses to head football coaches? As mentioned above, more than 90% of current contracts appear to contain at least one incentive clause. Is it because these clauses are effective at producing desired results? Perhaps they are bargaining mechanisms that allocate risk and cost more appropriately between the parties? Or maybe incentive clauses are simply a popular, established, and yet untested institutional logic. In other words, maybe schools and coaches are seizing on such clauses because other schools and coaches, presumably for legitimate reasons, adopted them as well.
In terms of coercive pressure, schools and coaches may view such clauses as a means to make their agreements appear legitimate and worthwhile. A coach with incentive clauses can feel he’s struck a bargain at least as worthy as other coaches with such clauses. Likewise, a school that structures powerful incentives might be signaling itself as a prime contender in the market. Taking the logic a step further, schools and coaches can compare themselves to their peers on the basis of their incentive clauses. Arguably, the coach with the most to gain in maximum incentive payments would feel he has reached the best deal.
The case for incentive clauses as a type of mimetic isomorphism might be conceived as schools and coaches being unsure of the type or magnitude of terms to be included in an agreement. Experience suggests there are no longer FBS coaches whose contracts stipulate merely salary and term. The stakes of high-level college football have become too great and each side of the transaction has too much to lose to simply shake hands and hope for the best. Therefore, it is in both parties’ best interest to hedge its bet and protect against the worst case, but how? Incentive clauses may present a tried and true method of risk allocation. While it’s possible that schools and coaches are plugging in ready-made clause constructions that may not be optimal for their situations, they are probably better than having no such clauses or starting from scratch. Therefore, in an attempt to hedge risk and lower transaction cost, actors are more likely to mimic what already exists.
Finally, on a related note, incentive clauses may be an attempt to organize the complex chaos that is FBS coaching. Just as the clauses can bring order to contract negotiation by providing a starting block, each party might view the clauses as a method of structuring their operations similarly to their peers. Modern FBS coaching is a vast job with potential competing goals and ample
coach and school. By memorializing both parties’ understanding of an agreement, the contract hints at how much priority should be placed on various tasks. Borrowing the contract mechanisms of peers allows schools and coaches to normalize their business operations.
CHAPTER III: METHODOLOGY III-1 SURVEY INSTRUMENTS
The main research methodology for this study was contract and historical record review. By reviewing and analyzing the contracts of FBS head coaches, the study identified each coach’s guaranteed compensation, the types of incentive clauses present in each contract, the criteria for completing each incentive condition, and the incentive’s respective size. Thereafter, a series of historical records related to athletic and academic performance (ex., winning percentage, bowl appearances, APR) were collected for the school where each coach was employed during each contract year of the study. By analyzing the contract variables (compensation, incentive type and size) against the performed athletic and academic outcomes, correlation levels and sample means could be identified.
This study employed quantitative statistical techniques to assess the level of correlation between variables and the statistical significance of differences in sample means. Although the study did not require traditional surveying or interviewing methods common to qualitative studies, it did involve surveying software to improve the efficiency and accuracy of content analysis data
collection.
As each contract was reviewed, Qualtrics presented appropriate questions to be answered regarding the contract using logic-based display and then stored the results. This process minimized the risk of human error in data entry, organization, or storage. Also, Qualtrics’ logic-based question
presentation created more efficient analysis by eliminating redundancy. For instance, when the coder responded that a contract does not include clauses related to post-season play, the software bypassed additional questions about such clauses. This algorithm improved accuracy by minimizing the risk of incorrect entry and significantly reduced the time spent in coding.
III-2 DRAWING THE SAMPLE
The creation of the sample began by creating a list of each public institution that competed in the NCAA FBS for during the 11-year period of 2002-2012. This list is comprised of 104
III-3 ACQUIRING CONTRACTS
Once the pertinent employment contracts were identified, open records requests were submitted to each of the FBS public schools. The requests specified which contracts were desired by listing the name of the coach(es) and years during which they served as head football coach. For instance, if an institution employed four coaches between the years of 2002 and 2012, the public records request would name all four of the coaches and call for all employment contracts between each of the coaches and the institution during the 11-year period. The request also specifies during which season each coach was employed in an attempt to aid the request recipient and expedite the retrieval process. All requests were initially sent to the University Counsel’s office at each institution, unless the office’s website specified a different custodian of records. In cases where the University Counsel’s office was not the custodian of records or overseer of public record requests, additional requests were forwarded or rerouted to a more appropriate recipient.
In addition to receiving employment contracts through open records requests, the sample was also drawn, as appropriate, from the publically available database of USA Today. For both the 2006 and 2009 football seasons, USA Today compiled databases of football head coach
compensation figures and PDF copies of the coaches’ most recent contracts. These databases were utilized to supplement the open record requests and verify request responses. In total, contracts for at least seven of the 11 specified seasons were received from 78 (75%) of the 104 potential schools. A total of 747 contract seasons comprised the final acquired, useable sample.
III-4 CONTRACT REVIEW
incentive clause types was created. Because the parties to each contract create incentive clauses individually, the clauses are inherently diverse and can be tied to almost any conceivable outcome. Therefore, in order to ensure sufficiently large sets of grouping variable and promote useful analysis, it was necessary to limit the types of incentives that would be included in the study. From the list of all observed incentive types, the final survey and contract review process included only 30 types of incentives. The included incentives are as follow:
1. Overall season winning percentage
2. Conference championship game participation OR division championship 3. Conference championship game victory OR conference championship 4. Single-season Academic Progress Rate
5. Graduation Success Rate 6. Non-BCS Bowl participation 7. Non-BCS Bowl victory 8. BCS Bowl participation 9. BCS Bowl victory
10. National championship game participation 11. National championship game victory 12. National Coach of the Year award 13. Conference Coach of the Year award 14. 7-win season
15. 8-win season 16. 9-win season 17. 10-win season 18. 11-win season 19. 12-win season 20. 13-win season 21. 14-win season
22. Final ranking in Top 25 23. Final ranking in Top 5 24. Final ranking in Top 10 25. Final ranking in Top 15 26. Final ranking in Top 20 27. 5 conference wins 28. 6 conferences wins 29. 7 conference wins 30. 8 conference wins
Each contract was coded for the type(s) of clause it contained, any thresholds necessary for completion of incentives, and the monetary size of each clause. By dividing the size of each
incentive by the coach’s total guaranteed compensation for each contract year, each incentive size was also recorded as a proportion of total guaranteed compensation.
III-5 HISTORICAL RECORD REVIEW
After compiling the list of incentive clause types to be included in the study, the
performance variables relevant to this study were identified. Performance variables data (ex: winning %, bowl game appearances, conference titles, team APR), were collected from the NCAA’s
publically-available statistical database to identify the variable values for each coach during each contract year. These performance figures were also entered into the survey instrument for each contract year. Winning percentage figures were calculated by comparing the team’s overall wins for a season, including post-season competition, to the number of total games played. For any season in which wins have been vacated as part of NCAA sanctions or for any other reason, win totals were recorded as though the wins had not be vacated. This method allowed for a more accurate
representation of history as it occurred. Coaching accolades were construed liberally, as school’s rarely specified which “Coach of the Year” vote was to be utilized in determining success.
Therefore, if the coach was awarded National Coach of the Year by any of the five most prominent organizations (Bryant, Robinson, AFCA, Dodd, Camp), a successful result was recorded. Similarly, recognition through either a conference’s coaches’ or media vote sufficed for a Conference Coach of the Year success. Final ranking data was collected from the Associated Press Top 25 polls only.
III-6 STATISTICAL ANALYSIS
Descriptive statistics such as frequency, mean, median, maximum, and minimum were used to analyze the size, frequency, and range of incentives. Such counts and calculations were performed to determine the total number of incentives present during the study, overall occurrence of each incentive type, the completion rate of each incentive, and the size of each incentive on average.
T-tests and ANOVAs were employed to compare sample means both to access the effect of incentive size and the change in average incentive size across conferences and seasons. Each mean comparison was analyzed using an α level of .05 and post hoc tests were performed following each significant omnibus ANOVA test.
Chi-square tests allowed frequencies to be compared across conferences and seasons as well as testing for any effect due to the presence of each incentive type on the rate of performance success.
CHAPTER IV: RESULTS 1. Incentive Clause Frequency and Size
A total of 747 contract years from a selection of 78 public FBS schools were sampled across 11 seasons from 2002-2012. Among these 747 contract years, 702 (94%) contained at least one incentive clause that was of a type included in this study. Table 1 below displays the frequency and completion rate of each type of incentive across the duration of all 11 seasons. The most frequent clauses present among all the contract years incented participation in BCS bowl games (627) and Non-BCS bowl games (635). For the sake of coding, National Championship game appearances, victories, and incentives were treated separately from BCS bowl appearances, victories, and incentives. Therefore, if a contract specified that it incented a National Championship game appearance or victory, that clause would not be coded as a BCS bowl game incentive, although the National Championship game is customarily considered within the Bowl Championship Series. Similarly, a National Championship appearance or victory was not coded as a BCS Bowl appearance or victory. One other important factor to consider in assessing incentive clause frequency is that the Academic Progress Rate regime was first introduced in 2004 and Graduation Success Rates were first calculated in 2005. Although clauses incenting graduation prior to GSR were coded as
The overall completion percentage of each incentive type is also displayed in Table 1. These percentages were arrived upon by dividing the total number of each incentive that was offered into the number of contract years in which the incentive was successfully accomplished.
Table 1.
Incentive Frequency and Completion Rate
Incentive Type Frequency Completion Rate Non-BCS Bowl
Participation 635 49.9%
BCS Bowl Participation 627 7.3% Conference
Championship Victory 589 12.9% Conference Coach of the
Year 362 12.4%
National Coach of the
Year 322 1.9%
Conference Championship
Participation 313 19.5%
National Championship
Victory 305 0.98%
Graduation Rate 236 41.7%
National Championship
Participation 233 6.4%
Top 25 219 17.3%
Academic Progress Rate 172 54.1%
Top-10 168 19.0%
9-win Season 142 26.1%
10-win Season 140 15.7%
8-win Season 133 39.1%
11-win Season 123 5.7%
Second Graduation Rate 117 15.4% Non-BCS Bowl Victory 114 12.3%
BCS Bowl Victory 114 1.7%
12-win Season 105 6.7%
Third Graduation Rate 97 4.1%
7-win Season 84 45.2%
Second APR 75 36.0%
Fourth Graduation Rate 52 7.0%
Top-20 49 22.4%
Third APR 47 40.4%
Top-5 46 13.0%
Top-15 43 7.0%
6 Conference wins 29 17.2%
Fifth Graduation Rate 24 7.0%
7 Conference wins 22 4.6%
8 Conference wins 22 3.0%
Winning Percentage 16 62.5%
Fourth APR 9 33.3%
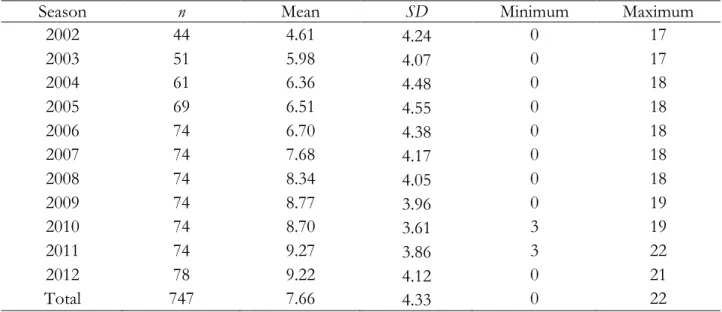
On average, each contract year contained more than seven and a half incentive clauses (M = 7.66, SD = 4.33) with a median value of 8 incentive clauses per contract year and a study-high 22 incentive clauses present in Steve Sarkisian’s contract with the University of Washington for the 2011 season. Table 2 presents the average number of incentives offered in each contract year by season. The means show an obvious upward trend each year as incentives became more
standardized. An omnibus between subjects ANOVA concluded that the difference in means between seasons was significant F(10, 736) = 8.21, p < .001. Appendix F features the post-hoc tests from this ANOVA, which show statistically significant differences in the total number of incentives offered on average between the earlier and later seasons in the study.
Table 2
Incentive Frequency by Year
Season n Mean SD Minimum Maximum
2002 44 4.61 4.24 0 17
2003 51 5.98 4.07 0 17
2004 61 6.36 4.48 0 18
2005 69 6.51 4.55 0 18
2006 74 6.70 4.38 0 18
2007 74 7.68 4.17 0 18
2008 74 8.34 4.05 0 18
2009 74 8.77 3.96 0 19
2010 74 8.70 3.61 3 19
2011 74 9.27 3.86 3 22
2012 78 9.22 4.12 0 21
Total 747 7.66 4.33 0 22
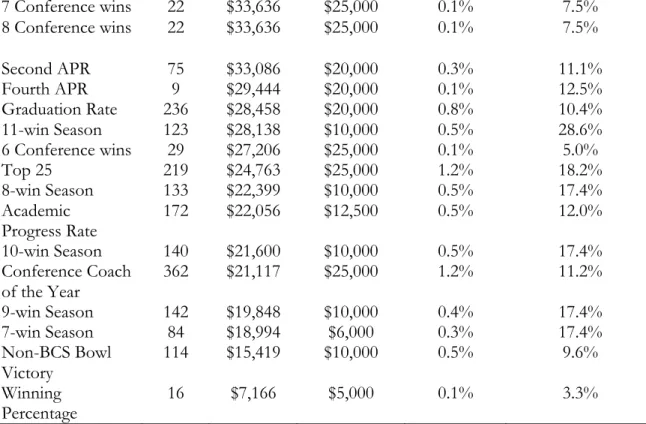
across the study’s 11 season. As the table is sorted by average value, National Championship game appearances and victories were the mostly highly incented activities by dollar value. BCS bowl appearances and conference championship wins were, on average, worth a higher percentage of a coach’s total guaranteed compensation within the contract years during which these incentives appeared.
Table 3
Incentive Size by Type
Incentives n Mean ($) Median ($) Mean (%) Maximum (%) National
Championship Victory
305 $229,587 $200,000 8.1% 235.3%
National Championship Participation
233 $178,893 $150,000 4.2% 75.0%
Top-5 46 $152,173 $150,000 0.5% 22.9%
Top-15 43 $86,232 $100,000 0.3% 12.5%
BCS Bowl
Participation 627 $85,283 $75,000 9.0% 83.3%
Top-20 49 $68,367 $50,000 0.4% 20.5%
Top-10 168 $68,069 $50,000 1.4% 18.8%
Conference Championship Victory
589 $66,784 $40,000 5.4% 58.7%
Fifth Graduation
Rate 24 $61,416 $45,000 0.2% 27.3%
Third Graduation
Rate 97 $59,559 $45,000 0.8% 32.3%
Fourth
Graduation Rate 52 $53,358 $40,000 0.4% 25.0%
Third APR 47 $50,155 $30,000 0.3% 11.4%
Conference Championship Participation
313 $45,361 $25,000 1.8% 35.2%
National Coach of
the Year 322 $42,068 $50,000 1.9% 15.4%
BCS Bowl Victory 114 $41,435 $25,000 0.9% 36.4% 5 Conference wins 33 $38,757 $25,000 0.1% 7.8% Second
Graduation Rate 117 $37,548 $30,000 0.6% 16.1% 12-win Season 105 $34,265 $10,000 0.5% 17.4% Non-BCS Bowl
7 Conference wins 22 $33,636 $25,000 0.1% 7.5% 8 Conference wins 22 $33,636 $25,000 0.1% 7.5%
Second APR 75 $33,086 $20,000 0.3% 11.1%
Fourth APR 9 $29,444 $20,000 0.1% 12.5%
Graduation Rate 236 $28,458 $20,000 0.8% 10.4% 11-win Season 123 $28,138 $10,000 0.5% 28.6% 6 Conference wins 29 $27,206 $25,000 0.1% 5.0%
Top 25 219 $24,763 $25,000 1.2% 18.2%
8-win Season 133 $22,399 $10,000 0.5% 17.4% Academic
Progress Rate 172 $22,056 $12,500 0.5% 12.0% 10-win Season 140 $21,600 $10,000 0.5% 17.4% Conference Coach
of the Year 362 $21,117 $25,000 1.2% 11.2%
9-win Season 142 $19,848 $10,000 0.4% 17.4%
7-win Season 84 $18,994 $6,000 0.3% 17.4%
Non-BCS Bowl
Victory 114 $15,419 $10,000 0.5% 9.6%
Winning
Percentage 16 $7,166 $5,000 0.1% 3.3%
Similar to Table 2, which showed incentive frequency by season, Table 4 displays the average overall dollar amounts that schools offered through incentive clauses and the average size of all incentives compared to total compensation during each season. Again, a clear and statistically significant F(10, 736) = 8.57, p < .001 trend of increased spending on incentives exists from an average of $185,623 in 2002 to $712,190 in 2012. Appendix F contains the post-hoc tests for total incentive dollars offered and it displays statistically significant increases in mean spending across the progression of seasons within the study.
Just as in the previous tests, Table 4 displays a trend of increased incentive clause value from 30.8% of total compensation in 2002 to a height of 53.7% in 2011. Appendix F, which contains the post hoc tests for this analysis, shows significant increases in incentive spending relative to total compensation as the seasons progress from 2002 through 2012.
Table 4
Total Incentive Offerings in Dollars and Relative to Total Compensation
Season n Mean ($) Min. ($) Max. ($) Mean (%) Min. (%) Max.(%)
2002 44 185,623 0 957,000 30.9 .00 156.45
2003 51 268,728 0 2,222,666 42.0 .00 261.49
2004 61 300,879 0 2,222,666 42.2 .00 261.49
2005 69 338,697 0 1,950,000 42.5 .00 162.50
2006 74 364,962 0 1,950,000 42.8 .00 133.00
2007 74 429,915 0 1,950,000 48.9 .00 199.41
2008 74 506,192 0 1,950,000 52.3 .00 262.50
2009 74 564,348 0 1,950,000 53.4 .00 131.25
2010 74 578,673 33,500 2,900,000 53.7 6.71 183.87 2011 74 678,301 33,500 2,900,000 53.0 5.86 180.65
2012 78 712,190 0 3,025,000 49.7 .00 180.65
Total 747 468,814 0 3,025,000 47.4 .00 262.50
2. Effect of Incentive Clause Presence
The second function of this study is to analyze the effect of incentive clause presence on a team’s likelihood of attaining the performance that the incentive is designed to motivate. These analyses were performed using chi-square tests to compare the frequency of outcomes among teams that did and did not incent particular athletic or academic performance outcomes. The chi-square tests allowed the observed frequency of each outcome to the expected frequencies. For instance, 313 of the 747 contract years surveyed contained an incentive for conference championship game
participation and 416 did not. These results, which demonstrate a statistically significant increase in attainment among incented contract years χ2 (1, N = 747,) = 45.26, p < .001 are displayed fully in Table 5, along with all other significant chi square tests.
Table 5
Effect of Incentive Presence
Performance Outcome Attained? χ2 Conference Championship Participation
Incentive Present? No Yes
Yes 416 18 45.256
(1.4) (-4.1)
No 252 61
(-1.7) (4.8) Non-BCS Bowl Participation Incentive
Present?
Yes 318 317 13.320
(-1.0) (1.0)
No 77 35
(2.3) (-2.4)
National Championship Participation Incentive Present?
Yes 218 15 23.365
(-.6) (4.0)
No 511 3
(.4) (-2.7)
Conference Coach of the Year Incentive Present?
Yes 317 45 5.016
(-.5) (1.5)
No 356 29
(.5) (-1.5)
Top-5 Incentive Present?
Yes 40 6 5.718
(.1) (-.6)
No 667 34
(-.5) (2.3)
Top-10 Incentive Present?
Yes 136 32 18.675
(-1.2) (3.6)
(.7) (-1.9) Non-BCS Bowl Victory Incentive
Present?
Yes 100 14 7.008
(1.1) (-2.2)
No 485 148
(-.5) (.9)
11-win Season Incentive Present?
Yes 116 7 5.434
(.7) (-2.0)
No 542 82
(-.3) (.9)
Top 25 Incentive Present?
Yes 183 36 5.502
(.9) (-1.7)
No 400 128
(-.6) (1.1)
Note. All results in this Table are significant at p-value < .05. Adjusted standardized residuals appear
in parentheses below group frequencies.
Chi-square tests were performed to analyze the effect of incentive presence for all 30 incentive types identified in this study. In addition to conference championship game participation, significantly higher rates of performance outcome attainment were found in contract years which incented the following outcomes: Non-BCS bowl participation χ2 (1, N = 747,) = 13.32, p < .001; National Championship game participation χ2 (1, N = 747,) = 23.37, p < .001; Conference Coach of the Year χ2 (1, N = 747,) = 5.02, p =.025; Top-5 ranking χ2 (1, N = 747,) = 5.72, p =.017; and Top-10 ranking χ2 (1, N = 747,) = 18.68, p < .001.
The full tables displaying the observed frequencies, adjusted standardized residuals, and χ2 values for these performance outcomes can be found in Appendix A.
Three other incentives did lead to statistically significant differences between expected and observed outcome frequencies. These differences, however, were in the opposite direction as incented contract years were less likely to attain the desired outcome and non-incented contract years attained the outcome more often than expected. For example, Table 5 displays the chi-square test outcome for the condition of Non-BCS bowl victory incentive presence χ2 (1, N = 747,) = 7.01,
p =.008. In this scenario, one would have expected between 24 and 25 of the 114 contract years to result in non-BCS bowl wins, but only 14 did. Conversely, 148 of the 633 non-incented contract years resulted in non-BCS bowl victories compared to the expected count of approximately 137. Similar significant results in an inverse direction were found for the presence of 11-win season χ2 (1,
N = 747,) = 5.43, p =.020) and top-25 ranking incentives χ2 (1, N = 747,) = 5.502, p =.019. These results are also summarized in Table 5 above.
difference t(370) = 0.49, (p=0.624). The t-test results for GSR presence can also be found in Table 6.
Table 6
Effect of APR Incentive Presence
Incentive Present?
Yes No t df
APR Score 951.67
(26.44) (27.48) 942.41 3.492 623
GSR Score 63.42
(11.91)
62.94 (10.93)
0.49 370
The final series of tests investigating the effect of incentive presence focused on incentives related to season win totals, both in conference and overall. Again, t-tests were utilized for these analyses as wins are continuous variables and can be compared via averages. Although tests were conducted comparing means from 10 pairs of treatment groups, none of the t-tests resulted in statistically significant differences in average number of wins at an α level of .05. Table 7 displays the
p-values for the difference in mean between treatment groups of each win outcome incentive. Complete tables of these t-test results can be found in Appendix B.
Table 7
Non Significant Incentive Presence
Incentive type t df p
5 conference wins -1.885 745 .060
6 conference wins -1.628 745 .104
7-win season -1.584 745 .114
7 conference wins -1.422 745 .156
8 conference wins -1.422 745 .156
11-win season -1.047 745 .295
9-win season .725 745 .469
12-win season .589 745 .556
10-win season .340 745 .734
8-win season .215 745 .830
3. Effect of Incentive Clause Size
based upon incentive presence, treatment groups were created based upon incentive
accomplishment. All contract years that provided an incentive for a particular outcome and during which that outcome was attained were compared to all contract years during which an outcome was incented but not attained. By comparing the difference in size between incentive clauses of those contract years when an incented outcome was and was not attained, the relative impact of incentive size was determined. These techniques were employed to investigate the effect of incentive size both in actual dollar amount and as a proportion of total guaranteed compensation.
Of all the incentive sizes that were tested, only three treatments yielded significantly (α = .05) higher average incentive sizes in contract years when incentives were accomplished. All three of these treatments assessed incentives in terms of dollars, as opposed to proportions of total
compensation. These three incentive types, which varied significantly with size, were season winning percentage t(14) = 2.570, p= .008, Non-BCS bowl participation t(633) = 2.229 , p=.026, and 12-win season t(103) = 2.833, p=.006. A fourth treatment, Top-25 ranking t(212) = 1.704, p=.090, is worth mention as it was statistically significant at an α level of .10. Table 8 displays information related to these significant mean comparisons.
A sizeable number of incentive types produced significant differences in mean showing smaller incentives sizes producing successful performance outcomes. The significantly smaller incentive sizes among successful contract years were present when comparing incentive size in dollars and relative incentive size. In total, two incentive types, Top-5 ranking t(42) = -5.58, p < .001) and 5 conference wins t(30) = -2.32, p=.027), displayed significantly (α = .05) more
Four incentive types resulted in successful seasons among significantly smaller incentives when considered as a proportion of total guaranteed salary. Briefly, the incentive types that produce significant results with smaller relative incentive sizes were Conference Championship participation
t(310) = -2.491, p=.013; Non-BCS bowl participation t(562) = -2.847, p=.005; Top-5 Ranking t(42) = -6.287, p< .001); and 5 conference wins t(30) = -2.370, p=.024. Table 8 contains complete statistical information regarding these tests.
Table 8
Significant Incentive Size t-tests
Incentive Accomplished?
Yes No t df
Winning Percentage Incentive Size $8,466 ($3,257)
$5,000 ($0)
2.570* 14
Non-BCS Bowl Participation Incentive Size $36,567
($25,196) ($29,059) $31,754 2.229* 633 12-win Season Incentive Size $83341.29
($86,859) ($43,855) $30,760 2.833* 103
Top 25 Incentive Size $31164.95
($26,629) ($22,515) $23,997 1.704 212 8-win Season Incentive Size?-In Dollars $17,627
($17,526) ($33,447) $25,462 -1.765 126.71 Top-5 Incentive Size?-In Dollars $58,333
($20,412) ($110,440) $166,250 -5.577* 41.85 5 Conference win Incentive Size?-In Dollars $18,900
($14,379) ($40,330) $49,545 -2.319* 30 Relative Size of Conference Championship
Participation Incentive (2.74%) 3.33% (3.60%) 4.56% -2.491* 310 Relative Size of Conference Championship
Victory Incentive (3.61%) 6.14% (5.92%) 7.0% -1.753 143.43 Relative Size of Non-BCS Bowl
Participation Incentive (2.47%) 3.83% (3.58%) 4.53% -2.847* 562.77 Relative Size of BCS Bowl Participation
Incentive (10.31%) 8.51% (9.28%) 10.92% -1.682 625
Relative Size of Top 5 Incentive 2.64%
(0.63%) (6.95%) 9.74% -6.287* 42.39 Relative Size of Top 10 Incentive 4.89%
(4.69%) (4.28%) 6.44% -1.803 166 Relative Size of 5 Conference Win Incentive 2.08%
(1.00%) .037483 (2.11%) -2.370* 30
Note. * denotes t value significant at p < .05. Standard Deviations appear in parentheses below group
Finally, a much greater number of incentives did not produce successful outcomes at significantly higher monetary offerings, either in dollars or in proportion to total compensation. Eighteen incentive types resulted in no significant difference in actual dollar offerings between successful and unsuccessful outcomes. Likewise, eighteen incentives did not produce significant differences in relation to proportion of total guaranteed compensation that was offered as an outcome incentive. The non-significant p-scores for the t-tests performed across these incentive types are presented in Tables 9 (Incentive size in dollars) and 9 (Incentive size as proportion of total compensation). Complete outcomes of these statistical tests, including means, standard deviations, and t scores can be found in Appendix D.
Table 9
Non Significant Incentive Size in Dollars
Incentive Size in Dollars t df p
Conference Championship Participation 0.23 310 0.819 Conference Championship Victory -1.29 157 0.2
Non-BCS Bowl Victory 1.14 112 0.255
BCS Bowl Participation 1.13 65 0.265
BCS Bowl Victory 1 112 0.321
National Championship Participation 0.46 231 0.643 National Championship Victory -0.24 303 0.809
National Coach of the Year -0.04 319 0.972
Conference Coach of the Year -0.58 360 0.561
7-win Season -1.36 63 0.18
9-win Season -1.01 140 0.315
10-win Season 0.23 138 0.819
11-win Season -0.4 121 0.688
Top-10 -1.24 57 0.221
Top-15 0.45 41 0.653
Top-20 -0.02 47 0.988
6 Conference win -1.29 27 0.21
Table 10
Non Significant Relative Incentive Size Incentive Size as Proportion of Total
Compensation t df p
National Championship Participation -1.76 231 0.079
8-win Season -1.68 131 0.095
Non-BCS Bowl Victory -1.58 112 .116
12-win Season 1.47 103 0.146
7-win Season -1.40 82 0.165
Winning Percentage -1.45 14 0.169
9-win Season -1.25 140 0.212
10-win Season -0.10 138 0.212
11-win Season -1.14 121 0.212
National Coach of the Year -0.82 319 0.411
7 Conference wins -0.78 20 0.444
National Championship Victory -0.59 303 0.556
Top 25 -0.58 48 0.563
Top-20 -0.56 47 0.576
Top-15 0.46 2 0.687
6 Conference win -0.04 27 0.687
BCS Bowl Victory -0.31 112 0.759
Conference Coach of the Year 0.09 360 0.929
between increases in incentive size and levels of APR or GSR. The Pearson Correlation coefficient for GSR and APR were r(204) = .051, p =.798 and r(133) = .022, p =.467, respectively, which both represent very low levels of non-significant correlation. Graphical representations of these
correlation tests can be found in Appendix C. Table 11
Academic Incentive Size in Dollars
Academic Outcome N
Pearson Correlation coefficient (r)
Academic Incentive Size (Dollars) GSR .051 206
APR .022 135
4. Supplemental Results
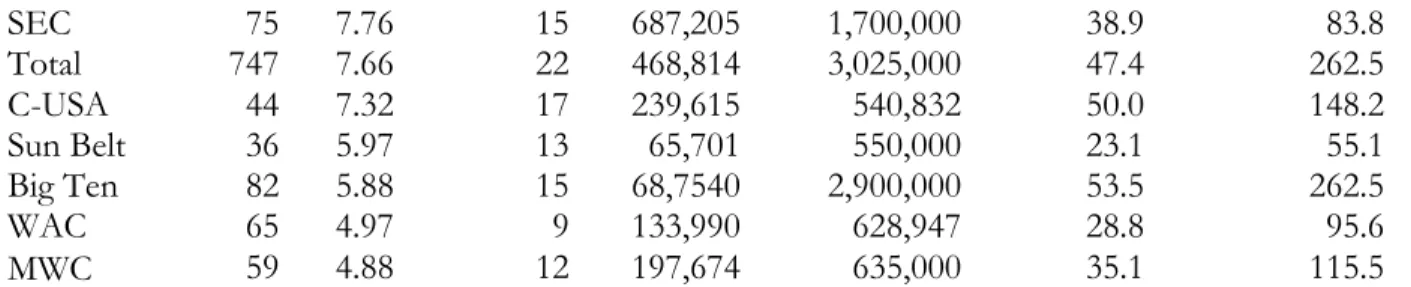
Table 12 displays rankings of each conference in the average number of incentives that schools within that conference offered each season, the average number of total dollars that schools within the conference offered in incentives in each season, and the average proportion of total compensation that schools within each conference offered in incentives during each season. The column “n” in each table represents the total number of schools from the conference that was surveyed during the study. The “Maximum” figure represents the highest value of a given variable for each conference during the entirety of the study.
Table 12
Average Incentive Frequency and Size by Conference
Conference n Mean Maximum Mean ($) Maximum ($) Mean (%) Maximum (%)
PAC-12 72 12.38 22 818,578 3,025,000 81.0 180.7
Big 12 102 9 18 711,382 2,222,666 54.8 261.5
Big East 42 8.69 18 481,497 1,425,000 48.0 129.1
ACC 67 7.93 14 660,878 1,725,000 43.4 110.6
SEC 75 7.76 15 687,205 1,700,000 38.9 83.8
Total 747 7.66 22 468,814 3,025,000 47.4 262.5
C-USA 44 7.32 17 239,615 540,832 50.0 148.2
Sun Belt 36 5.97 13 65,701 550,000 23.1 55.1
Big Ten 82 5.88 15 68,7540 2,900,000 53.5 262.5
WAC 65 4.97 9 133,990 628,947 28.8 95.6
MWC 59 4.88 12 197,674 635,000 35.1 115.5
Chi-Square tests were performed to determine whether the presence of each incentive type varied significantly across seasons and conferences. Table 13 displays the list of the incentive types that had significant chi-square results (α = .05) for conference and season variance. In all, twelve incentive types varied significantly in frequency across seasons and all twelve increased in frequency in later seasons. Twenty eight incentive types varied significantly in frequency across conferences. Table 13 displays the conferences in which each incentive type was more and least likely to appear during the study. The forth and fifth columns in Table 13 display the seasons during which each incentive type was most and least likely to occur across all FBS schools sampled. Conferences and seasons are displayed only for incentive types that varied significantly.
Table 13
Incentive Frequency by Conference and Season
Incentive Type Most Likely Conference Least Likely Conference Most Likely Season Least Likely Season
Non-BCS Bowl Participation SEC WAC 2011 2002
BCS Bowl Participation PAC-12 WAC 2011 2002
Conference Championship Victory
WAC MWC 2011 2002
Conference Coach of the Year MAC BIG 10 2012 2002 National Coach of the Year PAC-12 C-USA 2012 2002 Conference Championship
Participation SEC WAC 2012 2002
National Championship
Victory BIG 10 MAC X X
Graduation Rate PAC-12 WAC X X
National Championship
Participation SEC MAC X X
Top 25 MWC SEC X X
Academic Progress Rate PAC-12 BIG 12 2012 2004
Top-10 PAC-12 MAC X X
10-win Season PAC-12 SEC X X
8-win Season PAC-12 BIG 10 X X
11-win Season PAC-12 BIG 10 X X
Non-BCS Bowl Victory MAC BIG 10 2012 2002
BCS Bowl Victory MAC BIG 10 2012 2002
12-win Season PAC-12 BIG 10 X X
7-win Season PAC-12 BIG 10 X X
Top-20 ACC MAC X X
Top-5 ACC MAC X X
Top-15 ACC MAC X X
5 Conference wins ACC PAC-12 X X
6 Conference wins ACC PAC-12 X X
7 Conference wins ACC MAC X X
8 Conference wins ACC MAC X X
Winning Percentage C-USA BIG 12 X X
Second APR X X 2012 2004
Third APR X X 2011 2006
Fourth APR X X 2012 2006
Total Compensation v. Incentive Presence, Size, and Proportion
Bivariate correlation analysis was used to determine the level of correlation between total compensation and incentive frequency and size within contract years. Table 14 shows the results of these correlation tests. A significant correlation r(745) = .657, p <.001 was found between total compensation and the total amount an institution offered in incentives during a contract year. A graphical display of this correlation is featured in Graph 1. Statistically significant correlation was also found r(745) = .256, p < .001 between total guaranteed compensation and the total number of incentives that an institution offered during a contract year, as is displayed in Graph 2. The
Table 14
Incentive Attributes vs. Total Compensation
Total Compensation N
Incentive Attribute
Total Incentives Offered
.256 747
Percent total compensation offered
-.005 747
Total Incentive
$ offered .657 747
Graph 1
Graph 2
Regression: Total Compensation vs. Total Incentives Offered
Graph 3
Total Compensation vs. Win Percentage
The data collected in this study lent itself to one final test not related to incentive clauses; a correlation analysis of total compensation and season winning percentage for each of the 747
contract years surveyed. This analysis revealed a significant, albeit weak, positive correlation r(745) = .358, p < .001 between compensation and winning percentage as is displayed in Table 15 and Graph 4.
Table 15
Season Winning Percentage v. Total Compensation Total
Compensation N Season Winning Percentage .358** 747
Graph 4
CHAPTER V: DISCUSSION 1. Summary
The results of this study are intended to provide insight related to four critical dimensions of incentive clauses within FBS head coach contracts. First, descriptive statistics illuminate the overall frequency and size of each incentive clause type during the course of 11 seasons. Next, chi-square analysis was used to determine whether and how the frequency of incentive types varied over time and between athletic conferences. More centrally to the purpose of this study, contractual content analysis was then used to compare incentive clause attributes to attained athletic and academic performance outcomes during 747 contract years. By comparing performance achievement levels across contract years, among athletic conferences, and through time, this study then analyzed the effect of incentive clause presence and size on the likelihood of achieving desired performance outcomes. The following section will interpret the results of these calculations and tests to provide useful conclusions regarding each of these investigated topics.
2. Incentive Clause Attributes Incentive Prevalence