INVESTIGATION
argyle: An
R
Package for Analysis of Illumina
Genotyping Arrays
Andrew P. Morgan1Department of Genetics, University of North Carolina, Chapel Hill, North Carolina 27599-7264 ORCID ID: 0000-0003-1942-4543 (A.P.M.)
ABSTRACT Genotyping microarrays are an important and widely-used tool in genetics. I present argyle, an R package for analysis of genotyping array data tailored to Illumina arrays. The goal of the argyle package is to provide simple, expressive tools for nonexpert users to perform quality checks and exploratory analyses of genotyping data. To these ends, the package consists of a suite of quality-control functions, normalization procedures, and utilities for visually and statistically summarizing such data. Format-conversion tools allow interoperability with popular software packages for analysis of genetic data including PLINK, R/qtl and DOQTL. Detailed vignettes demonstrating common use cases are included as supporting information. argyle bridges the gap between the low-level tasks of quality control and high-level tasks of genetic analysis. It is freely available athttps://github.com/andrewparkermorgan/argyleand has been sub-mitted to Bioconductor.
KEYWORDS
SNP microarrays genotyping software
High-throughput genotyping of tens of thousands of single nucleotide polymorphisms (SNPs) using microarrays is common practice in both laboratory and population genetics. Genotypes at a dense panel of biallelic markers with a low rate of missing data are a valuable resource for breeding, marker-assisted selection, genetic mapping, and analyses of population structure. The Illumina Infinium system is one popular and cost-effective (approximately $100/sample) platform. Custom Illumina arrays are avail-able for many organisms of research, agricultural, or ecological interest including mouse (Morganet al.2015, this issue), dog, cat (Willet and Haase 2014), chicken, cow, pig, horse, sheep (Kijaset al.2009), salmon (Johnstonet al.2013), and cotton (Hulse-Kempet al.2015).
Infinium arrays consist of many thousands of short invariant oligonucleotide probes conjugated to silica beads. Sample DNA is hybridized to the probes and a single-base, hybridization-dependent extension reaction is performed at the target SNP. Alternate alleles (herein denoted A and B) are labeled with different fluorophores (Steemerset al.2006). Rawfluorescence intensity from the two color channels is processed into a discrete genotype call at each SNP, and
both the total intensity from both channels, and the relative intensity in one channelvs.the other, are informative for copy number.
Many tools, both open-source and proprietary, already exist for post-processing of rawhybridization intensity data. R packages include beadarray (Dunninget al.2007), lumi (Duet al.2008), and crlmm (Ritchieet al. 2009) among others. Illumina’s proprietary BeadStudio software is widely used by commercial laboratories and core facilities. BeadStudio applies a six-step “affine normalization”(Peiffer 2006), which pools data across many probes and many arrays. Intensities from the two color channels (herein denotedxandy) are transformed to lie in the standard coordinate plane, with homozygous genotypes near thexandyaxes, heterozygous genotypes approximately on the x¼y diagonal, and R¼xþy1. Biallelic genotypes are then called by clustering in this space.
Fewer tools exist for downstream quality control, exploratory analysis and interpretation of genotype calls jointly with underlying hybridization intensity data. Tofill this gap, I present argyle, a package for the R statistical computing environment. The purpose of argyle is to provide simple and
flexible tools for programmatic access to data from SNP arrays, with an emphasis on visualization. Although some functionality is tailored to Illumina arrays, many of the features are general enough to accommodate any dataset that can be expressed as a matrix of genotypes at biallelic markers. The main text of this paper outlines the key features of argyle; detailed code vignettes are provided as supplementary material.
METHODS
The design of argyle is inspired by the PLINK software [https://www. cog-genomics.org/plink2/; Purcellet al.(2007)]. A PLINKfileset has three parts: a genotype matrix, a marker map, and a“pedigree”(sample Copyright © 2016 Morgan
doi: 10.1534/g3.115.023739
Manuscript received October 16, 2015; accepted for publication December 17, 2015; published Early Online December 18, 2015.
This is an open-access article distributed under the terms of the Creative Commons Attribution 4.0 International License (http://creativecommons.org/ licenses/by/4.0/), which permits unrestricted use, distribution, and reproduction in any medium, provided the original work is properly cited.
Supporting information is available online atwww.g3journal.org/lookup/suppl/ doi:10.1534/g3.115.023739/-/DC1
and family metadata)file. Likewise, the central data structure in argyle (the genotypes object) stores a matrix of genotype calls, and hybridization-intensity data when available, in parallel with a marker map and sample metadata. A genotypes object is therefore a self-contained and largely self-describing representation of a genotyping dataset. Installa-tion of the package is described in Supporting InformaInstalla-tion,File S1, and the genotypes object is described in further detail inFile S2.
This package explicitly favorssimplicityandreadabilityof code over raw efficiency. It is appropriate for the“medium-sized”data—tens of thousands of markers and hundreds of individuals—regularly encoun-tered in experimental contexts. Users with larger datasets such as those routinely collected in human genetics—millions of markers and thou-sands of individuals—that do notfit comfortably in memory should explore more sophisticated R packages (such as the GenABEL suite: http://www.genabel.org/).
Data availability
Source code for argyle and example datasets used to generate thefi g-ures in this manuscript are available on GitHub:https://github.com/ andrewparkermorgan/argyle.
QUALITY CONTROL
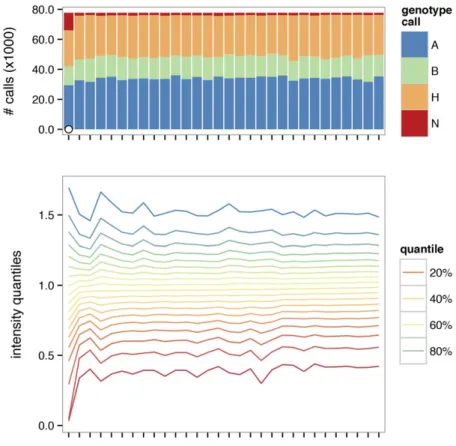
Removal of poorly-performing markers and poor-quality samples is an important precursor to genetic analysis. Failed arrays are characterized by aberrant intensity distributions, excess of missing and heterozygous calls, or both. A summary plot (Figure 1) facilitates the identification of low-quality samples. Concordance between biological sex and sex inferred from calls on the sex chromosomes is also useful for identifying contaminated or swapped samples. Failed arrays can beflagged and removed using global or subgroup-specific thresholds. SeeFile S3for a worked example.
Figure 1 Quality-control summary plot. Distribution of genotype calls is shown in upper panel, and a contour plot of intensity distributions across samples is shown in lower panel. Samples failing quality thresholds are marked with an open dot in the upper panel.
In addition to global summaries, argyle provides easy access to hybrid-ization intensity data from individual probes. Inspection of“cluster plots” for individual probes is useful for confirming the accuracy of genotype calls and diagnosing poorly-performing markers (Figure 2). A dotplot (Figure 3) permits direct inspection of genotype calls at multiple markers over small genomic regions.
ARRAY NORMALIZATION
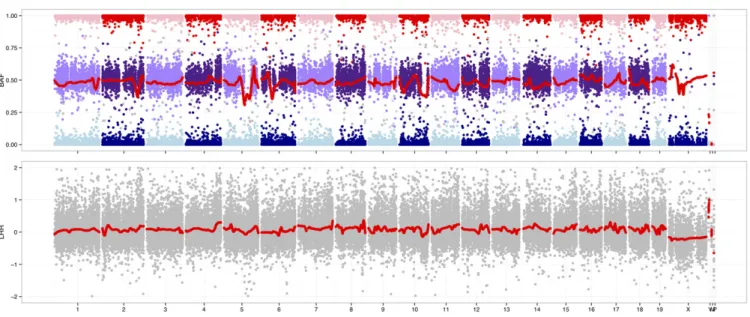
Illumina BeadStudio uses an“affine normalization”algorithm to perform within- and between-array adjustments tox- andy-hybridization inten-sities before calling genotypes. However, further normalization is helpful for analyses of sample contamination and copy number. Two standard metrics are the log2R=R0ratio (LRR), which captures total hybridization intensity (R) relative to a reference level (R0); and B-allele frequency (BAF), which captures the relative signal from the A and B alleles (Peiffer 2006). For an uncontaminated euploid sample, the expected value of LRR is 0, and the expected value of BAF is 0.5 at heterozygous markers.
The argyle package implements the thresholded quantile normali-zation (tQN) approach described in Staafet al.(2008) and Didionet al. (2014). Briefly, tQN performs within-array quantile normalization of thexchannel against theychannel to account for dye biases specific to the Infinium chemistry, but places an upper bound on the difference between normalized and unnormalized intensity values. LRR and BAF are then computed using known cluster positions computed from a set of reference samples. The tQN procedure may optionally be preceded by preliminary between-array quantile normalization using routines implemented in the preprocessCore package (Bolstadet al.2003). A joint plot of BAF and LRR (Figure 4) is valuable for assessing hetero-zygosity, ploidy, sample purity, and sex-chromosome karyotype.
Copy-number inference from Illumina arrays is a well-studied problem for which good solutions already exist—for instance, the standalone software PennCNV (Wanget al.2007), or the R package genoCN (Sunet al.2009). Most of these packages take BAF and LRR values as input and so are easily integrated downstream of argyle.
Systematic batch effects on intensity distributions are possible when analyzing samples processed that were not processed concurrently. The reliability of discrete genotype calls may be unchanged between batches, but downstream analyses that make use of hybridization intensities [e.g., copy-number analyses, or hidden Markov models (HMM) for haplotype in-ference in multiparental populations (Fuet al.2012; Gattiet al.2014)] may benefit from a further batch correction. One possibility, givenk nonover-lapping batches, is quantile normalization of batches 1;. . .;k21 against thekth batch. Although between-batch normalization is not yet imple-mented in argyle, it is slated for inclusion in future releases.
GENETICS TOOLS
Utilities are provided for efficient calculation of allele frequencies, heterozygosity and missingness by sample and by marker. When genotypes of both parents and offspring are available, pedigree rela-tionships can be confirmed via checks for Mendelian inconsistencies. Separate datasets can be concatenated or merged using functions that ensure consistency of allele encoding and detect strand swaps [e.g., an (A/G)vs.a (T/C) SNP].
Figure 3 Dotplot representation of genotypes among nine wild-caught mice on proximal chromosome 19 (from Yang et al. 2011). Genotype calls are coded as counts of the reference allele, and points are colored according to genotype call. Blank spaces indicate missing calls. Markers are plotted with constant spacing in the main panel; gray lines indicate physical position along the chromosome in megabases (Mbp).
To facilitate analysis of genotypes from experimental crosses, argyle provides functions for recoding alleles with respect to parental lines. A general-purpose HMM allows for reconstruction of haplotype mosaics, given a panel of reference samples and a genetic map—although users are cautioned that more sophisti-cated implementations are available for some special cases (Bromanet al.2003; Fuet al.2012; Gattiet al.2014). Mature tools for genetic mapping in the R environment already exist (e.g., R/qtl; Broman et al. 2003). Genotypes processed with argyle can be readily converted to R/qtl format to create a unified pipeline for quantitative-trait locus (QTL) mapping. One- and two-locus “mosaic plots” allow joint visualization of allele frequencies and phenotype at candidate QTL (Figure 5). A worked example is provided inFile S4.
Genome-wide patterns of relatedness can be explored using built-in functions for efficient kinship estimation (Figure 6) and principal com-ponents analysis (Figure 7). SeeFile S5for more detailed demonstration of functions useful for population-genetic analysis.
DATA EXPORT
The argyle package provides functions to convert genotypes objects to other formats either within the R session (for R/qtl and DOQTL) or on disk. Currently argyle supports export to either PLINK binary format (.fam/.bim/.bed) or Stanford HGDP format. PLINK pro-vides command-line utilities to convert its file format to many others, including VCF, LINKAGE (.map/.ped), Haploview, STRUCTURE, and fastPHASE. In addition, since genotypes objects are regular R matrices, users can adapt them to bespoke input for-mats required by other tools for genetic analysis.
PERFORMANCE
dataset, including hybridization intensities and sample and marker metadata, occupies 202.4 Mb; without hybridization intensities, the size drops to 77.9 Mb. Memory usage scales approximately linearly with either the number of samples or the number of markers (Figure 8A). The most computationally-intensive component of argyle is the tQN procedure, and is implemented in C++. Its running time is compared to the quantile normalization routine from the preprocessCore package in Figure 8B. These resource requirements are well within the range of a typical laptop or desktop computer.
R’s internal limit of 23121 entries for any matrix or vector places an upper bound on the dimensions of a genotypes object. For arrays with between 10;000 and 150;000 markers, this translates to a limit of between 14;000 and 21;000 samples.
Tests were performed in R 3.1.2 (64-bit) on a MacBook Air, with a
single 1.7 Ghz Intel Core i7 processor, and 8 Gb RAM. ACKNOWLEDGMENTS
The author thanks John Didion for advice on design and quality-control methods; John Didion, Dan Gatti, Marty Ferris, and Sofia Grize for valuable feedback on early versions of this software; and Robert Corty, Will Valdar, and Fernando Pardo-Manuel de Villena for helpful comments on this manuscript. This work was supported in part by NIH grants F30MH103925 (APM), U19AI100625 (FPMV), U42OD010924 (Terry Magnuson), and the UNC Bioinformatics and Computational Biology Training Grant (T32GM067553).
Note added in proof:See Morganet al. 2015 (pp. 263–279) in this issue, for a related work.
LITERATURE CITED
Bolstad, B., R. Irizarry, M. Astrand, and T. Speed, 2003 A comparison of normalization methods for high density oligonucleotide array data based on variance and bias. Bioinformatics 19: 185–193.
Broman, K. W., H. Wu, S. Sen, and G. A. Churchill, 2003 R/qtl: QTL mapping in experimental crosses. Bioinformatics 19: 889–890. Figure 6 Heatmap representation of matrix of pairwise genetic
distances between 28 wild-caught mice from three different sub-species using data from the Mouse Diversity Array (Yanget al.2011). Genetic distance is defined here as the proportion of alleles shared identical by state between two individuals. The matrix is hierarchically clustered to that more closely-related samples are adjacent to each other. The heatmap is useful for visualizing population structure; here it reveals obvious genetic differentiation between mouse subspecies.
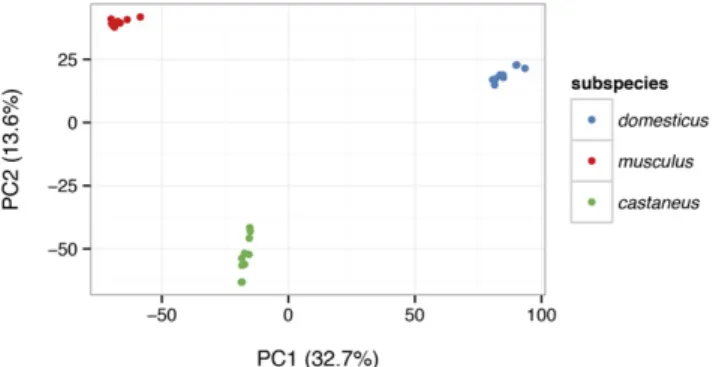
Figure 7 Projection of the same 28 samples from Figure 6 onto the top two principal components (PCs) of the genotypes matrix. The block structure of the kinship matrix corresponds to the three clusters revealed by principal component analysis (PCA), which in turn corre-spond to three distinct subspecies.
Didion, J. P., R. J. Buus, Z. Naghashfar, D. W. Threadgill, H. C. Morseet al., 2014 SNP array profiling of mouse cell lines identifies their strains of origin and reveals cross-contamination and widespread aneuploidy. BMC Genomics 15: 847. Du, P., W. A. Kibbe, and S. M. Lin, 2008 lumi: a pipeline for processing
illumina microarray. Bioinformatics 24: 1547–1548.
Dunning, M. J., M. L. Smith, M. E. Ritchie, and S. Tavare, 2007 beadarray: R classes and methods for illumina bead-based data. Bioinformatics 23: 2183–2184. Eddelbuettel, D., 2013 Seamless R and C++ Integration with Rcpp,
Springer, New York.
Fu, C.-P., C. E. Welsh, F. P.-M. de Villena, and L. McMillan, 2012 Inferring ancestry in admixed populations using microarray probe intensities, pp. 105–112 inProceedings of the ACM Conference on Bioinformatics,
Computational Biology and Biomedicine - BCB912, Association for Computing Machinery (ACM). New York, NY.
Gatti, D. M., K. L. Svenson, A. Shabalin, L.-Y. Wu, W. Valdaret al., 2014 Quantitative trait locus mapping methods for diversity outbred mice. G3 (Bethesda) 4: 1623–1633.
Hulse-Kemp, A. M., J. Lemm, J. Plieske, H. Ashrafi, R. Buyyarapuet al., 2015 Development of a 63k SNP array for cotton and high-density mapping of intraspecific and interspecific populations of gossypium spp. G3 (Bethesda) 5: 1187–1209.
Johnston, S. E., M. Lindqvist, E. Niemelä, P. Orell, J. Erkinaroet al., 2013 Fish scales and SNP chips: SNP genotyping and allele frequency estimation in individual and pooled DNA from historical samples of atlantic salmon (salmo salar). BMC Genomics 14: 439.
Kijas, J. W., D. Townley, B. P. Dalrymple, M. P. Heaton, J. F. Maddoxet al., 2009 A genome wide survey of SNP variation reveals the genetic structure of sheep breeds. PLoS One 4: e4668.
Morgan, A.P., C.-P. Fu, C.-Y. Kao, C. E. Welsh, J.P. Didionet al., 2015 The mouse universal genotyping array: from substrains to subspecies. G3 (Bethesda) 6: 263–279.
Peiffer, D. A., 2006 High-resolution genomic profiling of chromosomal aberrations using infinium whole-genome genotyping. Genome Res. 16: 1136–1148.
Purcell, S., B. Neale, K. Todd-Brown, L. Thomas, M. A. Ferreiraet al., 2007 PLINK: A tool set for whole-genome association and population-based linkage analyses. Am. J. Hum. Genet. 81: 559–575.
Ritchie, M. E., B. S. Carvalho, K. N. Hetrick, S. Tavare, and R. A. Irizarry, 2009 R/bioconductor software for Illumina’s Infinium whole-genome genotyping BeadChips. Bioinformatics 25: 2621–2623.
Staaf, J., J. Vallon-Christersson, D. Lindgren, G. Juliusson, R. Rosenquist
et al., 2008 Normalization of Illumina Infinium whole-genome SNP data improves copy number estimates and allelic intensity ratios. BMC Bioinformatics 9: 409.
Steemers, F. J., W. Chang, G. Lee, D. L. Barker, R. Shenet al., 2006 Whole-genome genotyping with the single-base extension assay. Nat. Methods 3: 31–33.
Sun, W., F. A. Wright, Z. Tang, S. H. Nordgard, P. V. Looet al., 2009 Integrated study of copy number states and genotype calls using high-density SNP arrays. Nucleic Acids Res. 37: 5365–5377.
Wang, K., M. Li, D. Hadley, R. Liu, J. Glessneret al., 2007 PennCNV: an integrated hidden markov model designed for high-resolution copy number variation detection in whole-genome SNP genotyping data. Genome Res. 17: 1665–1674.
Willet, C. E., and B. Haase, 2014 An updated felCat5 SNP manifest for the illumina feline 63k SNP genotyping array. Anim. Genet. 45: 614– 615.
Yang, H., J. R. Wang, J. P. Didion, R. J. Buus, T. A. Bellet al., 2011 Subspecific origin and haplotype diversity in the laboratory mouse. Nat. Genet. 43: 648–655.