Socioeconomic status in childhood and C-reactive protein in
adulthood: a systematic review and meta-analysis
Richard S. Liu1,2, Allison E. Aiello3, Fiona K. Mensah1,2,4, Constantine E. Gasser1,2, Kuna Rueb1, Billie Cordell1, Markus Juonala5,6, Melissa Wake1,2,4, and David P. Burgner1,2,7
1Murdoch Childrens Research Institute, Parkville, Victoria, Australia 2Department of Paediatrics,
The University of Melbourne, Parkville, Victoria, Australia 3Department of Epidemiology,
University of North Carolina at Chapel Hill, Chapel Hill, North Carolina, USA 4The Royal
Children’s Hospital, Parkville, Victoria, Australia 5Department of Medicine, University of Turku 6Division of Medicine, Turku University Hospital, Turku, Finland 7Department of Paediatrics,
Monash University, Clayton, Victoria, Australia
Abstract
Background—Inflammation plays a central role in cardio-metabolic disease and may represent a mechanism linking low socioeconomic status (SES) in early life and adverse cardio-metabolic health outcomes in later life. Accumulating evidence suggests an association between childhood SES and adult inflammation, but findings have been inconsistent.
Methods—We conducted a systematic review and meta-analysis of observational studies to quantify the association between childhood (age <18 years) SES and the inflammatory marker C-reactive protein (CRP) in adulthood. Studies were identified in Medline and Embase databases, and by reviewing the bibliographies of articles published from 1946 through to December 2015. Study-specific estimates were combined into meta-analyses using random-effects models.
Results—Fifteen of 21 eligible studies (n = 43,629) were ultimately included in two separate meta-analyses. Compared with those from the most advantaged families, participants from the
Licence for Publication: The Corresponding Author has the right to grant on behalf of all authors and does grant on behalf of all authors, an exclusive licence (or non-exclusive for government employees) on a worldwide basis to the BMJ Publishing Group Ltd to permit this article (if accepted) to be published in JECH and any other BMJPGL products and sublicences such use and exploit all subsidiary rights, as set out in our licence (http://group.bmj.com/products/journals/instructions-for-authors/licence-forms). Address for correspondence: Professor David Burgner, Murdoch Childrens Research Institute, Royal Children’s Hospital, 50 Flemington Road, Parkville, Victoria 3052, Australia, Tel: +61399366730, Fax: +61393481391, [email protected] (reprints are not available).
Statement about authors contributions
Drs Richard S. Liu and David P. Burgner contributed to study conception and design, directed the study implementation, acquisition, analysis and interpretation of data, and drafted the initial manuscript and approved the final manuscript submitted.
Drs Allison E. Aiello and Fiona K. Mensah contributed to study design, analysis and interpretation of data, and critically revised the initial manuscript and further drafts for important intellectual content, and approved the final manuscript submitted.
Billie Cordell, Kuna Rueb and Constantine E. Gasser contributed to acquisition and analysis of data, drafting and reviewing the manuscript and further drafts, and approved the final manuscript as submitted.
Drs Markus Juonala and Melissa Wake contributed to the analysis and interpretation of the data, critically revising drafts for important intellectual content, and approved the final manuscript as submitted.
HHS Public Access
Author manuscript
J Epidemiol Community Health
. Author manuscript; available in PMC 2018 March 08.Published in final edited form as:
J Epidemiol Community Health. 2017 August ; 71(8): 817–826. doi:10.1136/jech-2016-208646.
A
uthor Man
uscr
ipt
A
uthor Man
uscr
ipt
A
uthor Man
uscr
ipt
A
uthor Man
uscr
least advantaged families had 25% higher CRP levels (ratio change in geometric mean CRP: 1.25; 95% confidence interval: 1.19, 1.32) in minimally adjusted analyses. This finding was attenuated by the inclusion of adult body mass index (BMI) in adjusted models, suggesting BMI has a strong mediating role on CRP levels.
Conclusions—We observed an inverse association between childhood SES and adulthood CRP, potentially mediated through BMI. Investigating how childhood SES is associated with childhood BMI and CRP would provide insight into the effective timing of social and clinical interventions to prevent cardio-metabolic disease.
Keywords
Social and life-course epidemiology; obesity; cardiovascular disease; social inequalities
INTRODUCTION
Socioeconomic status (SES) is an important determinant of adult health outcomes.[1, 2] Early life SES in particular has been shown to predict risk factors and manifest disease in later life.[3–6] Of the many health outcomes linked with early life SES, cardio-metabolic conditions, including cardiovascular disease (CVD),[7–9] diabetes[10, 11] and obesity,[12] have shown the most consistent associations.
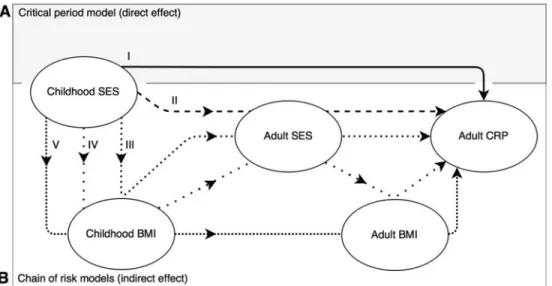
Chronic inflammation, indicative of prolonged low-grade activation of the immune system, is a suggested general pathophysiological mechanism underlying the development of diverse non-communicable diseases,[13] and especially of cardio-metabolic health outcomes.[14– 16] Life course models[17–21] posit that exposure to higher levels of inflammation, either during a critical period early in life or as an accumulation of a chain of risk factors over time, increase the likelihood of cardio-metabolic disease later in life. In Figure 1, we propose potential pathways through which low SES may act to increase inflammation, broadly corresponding to these alternate models. If SES in early life sets the stage for life-long inflammation, then examining how intermediate variables alter associations between early life SES and adult inflammation may help delineate and quantify the direct and indirect pathways through which SES influences cardio-metabolic health.
The cross-sectional association between SES and markers of inflammation in adulthood is well documented for a number of inflammatory biomarkers, including C-reactive protein (CRP),[19, 22–24] fibrinogen[23, 25, 26] and interleukin-6.[19, 24, 27] C-reactive protein is the most commonly assessed marker as it is stable in stored samples and easy and
inexpensive to measure; CRP has also been consistently associated with cardio-metabolic outcomes in observational studies,[14] but its role as a causal determinant of CVD is contested.[28]
Causal inferences have been challenging when examining the association between SES and CRP. Elevated levels of CRP may indicate an acute infection or injury in addition to chronic inflammation.[29] Furthermore, measured and unmeasured confounding might bias cross-sectional analyses of SES and CRP. Finally, CRP may be a surrogate marker of poor health, [13] which itself is responsible for lower adulthood SES, an example of reverse causation.
A
uthor Man
uscr
ipt
A
uthor Man
uscr
ipt
A
uthor Man
uscr
ipt
A
uthor Man
uscr
Investigating temporally separate childhood SES and its relation to adult CRP provides evidence for the direction of a causal relationship between SES and CRP, if one exists.
Several studies have examined the impact of childhood SES on CRP and other inflammatory markers in adulthood.[19, 20, 22] To our knowledge, no previous systematic review has synthesised the available evidence examining childhood SES and later life CRP. We therefore performed a systematic review and meta-analysis of the association between early life SES and subsequent adult markers of inflammation, with a focus on CRP, the most widely measured marker.
METHODS
Protocol Registration and Information Sources
The protocol was prospectively registered with the International Prospective Register of
Systematic Reviews (PROSPERO, CRD42016038683)[30] on 4th May 2016. Searches of
Ovid Medline and Embase databases were undertaken in December 2015 for studies reporting socioeconomic measures in childhood as exposures and blood biomarkers in adulthood as outcomes. The review was planned, conducted, and reported in adherence to the standards of quality for reporting Meta-analyses of Observational Studies in
Epidemiology (MOOSE).[31]
Literature Search
The search strategy, developed together by a clinician and institution librarian, used subject headings and free text terms derived from previously identified relevant papers in authors’ personal libraries.[16, 22] Keywords, MeSH terms and search limits for three topic areas - inflammation, SES and childhood – were combined in each database (Supplementary table S1).
Study Selection
Two investigators (KR, CG) independently screened abstracts and titles. Two investigators (RL, KR) further independently screened full texts according to inclusion criteria.
Discrepancies were resolved through third party adjudication (DB). Studies were included only if all of the following criteria were met: (1) they were observational studies of a general population, (2) child SES was reported as an exposure variable, and (3) adult inflammatory markers were reported as an outcome variable. We defined the exposure ‘child SES’ as a measure of parental or family occupational level, education, income or some other measure of SES, measured before 18 years of age. We defined ‘adult inflammatory marker’ as any blood-derived biomarker, measured after 18 years of age, associated with the inflammatory immune response. We specifically searched for studies containing the terms ‘C-reactive protein’, ‘interleukin’ and ‘fibrinogen’ in our search strategy.
All publication years from 1946 through to 10th December 2015 were included. There was
no minimum study size or follow-up duration, and no language restrictions. Bibliographies of eligible studies and previously published reviews were hand searched for additional relevant publications.
A
uthor Man
uscr
ipt
A
uthor Man
uscr
ipt
A
uthor Man
uscr
ipt
A
uthor Man
uscr
Data Extraction
We narrowed our focus to CRP alone, as this marker was the most widely investigated. There were insufficient studies for other biomarkers to summarise the data meaningfully in meta-analyses. Two investigators (RL, BC) independently extracted two copies of the following data from the full texts: first author, year of publication, study population, sample size, age of participants at outcome, study duration, exposure and outcome methods, statistical analysis used, main estimates, standard errors and confidence interval estimates of the association between exposure and outcome, with covariates and stratification if
applicable. We preferentially selected estimates that compared CRP between extreme categories of SES. In order to avoid over-adjustment by potential intermediate variables between exposure and outcome, we preferentially extracted age-, sex-adjusted or minimally-adjusted analyses. Where necessary, study authors were contacted for additional details.
Data Synthesis and Meta-analysis
In order to visualize overall trends, a summary table of results (positive association, no association, negative association) from age- and sex-adjusted analyses was compiled. Due to heterogeneity in the reported analyses, only studies that reported beta coefficients (or transformable variants) or odds/risk ratios were brought forward into meta-analyses (n = 15). In studies that used CRP as a continuous variable, if possible, we converted analyses to a single type of statistic to ease comparison (n = 9). Log-transformed beta coefficients from linear regression became the baseline statistic into which all other analyses were transformed (Supplementary tables S3–6). In studies where CRP was treated as a binary variable (n = 5), odds/risk ratios, comparing the odds for “high risk” CRP in the low SES category with the high SES category were extracted. Reciprocals of the odds ratios were calculated with the referent category as low SES. The random-effects model was used for all meta-analyses due to the high heterogeneity of the SES variables. When studies performed multiple relevant analyses we included the most reliable measure, in the following order: education preferably, and if not, occupation, and if not, income, and if not, miscellaneous exposures. This was to avoid overweighting studies that repeated measures on the same participants.
Risk of publication bias across studies was examined visually by funnel plots. A broadly symmetric plot indicated a lower risk of bias against the publication of negative results. We formally tested for asymmetry using Egger’s Test when more than ten estimates were included in a single analysis.
Additional Analyses
Post-hoc stratified analysis of subgroups were undertaken to assess whether the association depended on a) the study design and b) the type of exposure. Further post-hoc meta-analyses were undertaken a) excluding single studies with large weight. We additionally examined the influence of adult SES and adult BMI given their widely-accepted relationships with adult inflammatory markers.
All statistical analyses were performed using Stata 14.1 (StataCorp LP, TX, USA) using meta-analyses commands such as metan, metafunnel, and metabias.
A
uthor Man
uscr
ipt
A
uthor Man
uscr
ipt
A
uthor Man
uscr
ipt
A
uthor Man
uscr
RESULTS
Study Selection and Characteristics
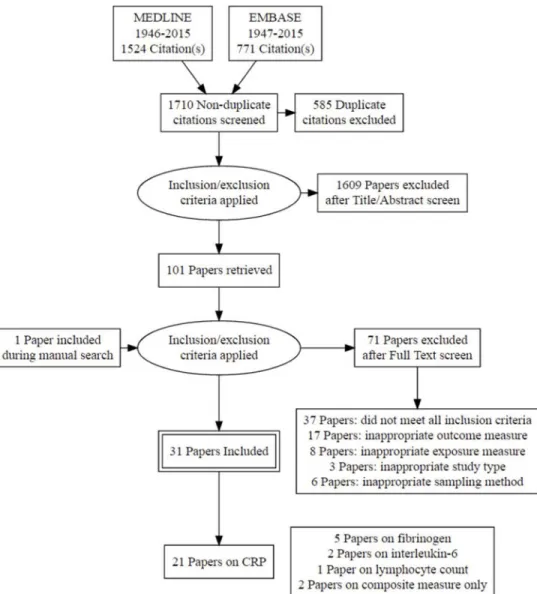
We screened the abstracts and titles of 1,710 non-duplicate citations, excluding 1,609 studies (Figure 2). Of 101 studies that were potentially eligible on screening, 30 articles met all inclusion criteria. One additional study was included through a hand search of bibliographies of selected studies. We narrowed our focus to CRP alone, as other markers did not provide consistent evidence, and presenting such data may provide misleading conclusions. We excluded 10 studies and extracted data on childhood SES and adult CRP associations from 21 studies. Table 1 and Supplementary table S2 present the characteristics of each included study.
Nine studies were performed in the United States, five in the United Kingdom, three in Nordic countries, one in New Zealand, and three in low to middle income countries (Brazil and the Philippines). Five studies were cross-sectional[34, 38, 43, 44, 46] and 16 were cohort studies with variable periods of follow-up ranging from one to five decades. Exposures included measures of parental occupational status (n = 10), education (n = 13), family income (n = 3), and some measure of early life adversity (n = 5). Seven studies excluded high CRP measurements (>10mg/L), while Shanahan et al. defined >10mg/L as the cut off point for “very high CRP”.[29]
Synthesis of Results
Differences in analytical methods made direct comparison difficult, so we grouped the 21 studies examining CRP by the statistical methodology used in reporting associations (Table 2).
The majority of reported associations were inverse associations (participants with lower childhood SES had an increased CRP relative to those with a higher childhood SES). Three studies[36, 42, 45] reported no significant associations between any measure of childhood SES and adult CRP, while a further four studies[23, 32, 41, 44] reported at least one non-significant association. The remaining studies (n = 14) reported non-significant associations between all measures of childhood SES and adult CRP.[16, 19, 20, 29, 33–35, 37–40, 43, 46, 47]
Meta-analysis—Fifteen studies had sufficient data for inclusion of study-specific estimates into two separate meta-analyses. Eight studies[19, 20, 23, 39, 41, 43, 45, 46] reported linear regression analyses of log- transformed CRP (Figure 3). Two further studies[34, 36] reported geometric means. Beta-coefficients estimating the difference between extreme groups in an unadjusted analysis were derived from the Carmelo study[34] (Supplementary table S5). The data presented in Gimeno et al.[36] were discarded as the estimates were from the same study as Kivimaki et al.[23] Thus, the first meta-analysis comprised nine studies of 24,934 participants (Figure 3). Repeated analyses of the same population were excluded, in order of preference: income data excluded if occupation data were available, and occupation data excluded if education data were available. A sensitivity
A
uthor Man
uscr
ipt
A
uthor Man
uscr
ipt
A
uthor Man
uscr
ipt
A
uthor Man
uscr
analysis excluding childhood adversity study-specific estimates was not substantially different (Supplementary figure S1).
Overall, there was a 25% increase (ratio change in CRP: 1.25, 95% CI: 1.19, 1.32) in adult geometric mean CRP in the lowest childhood SES group compared with the highest, measured by either parental education or occupational status, in a random-effects model. Sensitivity analyses restricted to either education or occupation sub-groups did not yield substantially different summary estimates (Supplementary figure S1).
Five further studies[16, 29, 35, 37, 42] were grouped into a second meta-analysis of odds/ risk ratios (n=18,695) (Supplementary figure S2). The odds or risk for a high-risk CRP compared to a low-risk CRP was 23% higher in the low SES category compared with the high SES category (1.23; 95% CI: 1.11, 1.37). Post hoc sensitivity analysis excluding high-weighted estimates from the Shanahan study[29] did not substantially alter the results (data not shown).
Publication bias was assessed via funnel plots separately for each meta-analysis. Visual inspection of the linear regression estimates funnel plot did not indicate the presence of study effects, and Egger’s regression asymmetry test did not suggest significant small-study effects (P = 0.3) (Supplementary figure 3A). Visual inspection of the second meta-analysis funnel plot should be interpreted with caution given the limited number of studies included (n = 5), but it did not demonstrate obvious bias (Supplementary figure 3B).
Explanatory Factors
Sex differences in C-reactive protein—C-reactive protein, when examined by sex, was higher in women than in men. Two studies reported significant sex differences[20, 41] in initial analyses and stratified by sex in reported analyses. In particular, Nazmi et al.[41] observed differing trends with SES and CRP for men and women, likely related to cultural- and sex-specific SES-BMI relationships in Brazil.[48]
Body mass index—In four studies,[19, 23, 41, 45] the addition of adult BMI into the analysis as a mediator variable fully attenuated the association between childhood SES and adult CRP. Post hoc meta-analysis of BMI-adjusted associations between childhood SES and adult CRP yielded an estimate close to one (1.04, 95% CI: 0.93, 1.13) (Supplementary figure S4). In separate logistic regression analysis, Gustafsson et al.[37] (Umeå University,
personal written communication 2016) demonstrated an attenuation of the odds ratio towards the null hypothesis once adult BMI was included in the model. Path analysis in two further studies[38, 47] demonstrated strong associations between childhood SES and adult BMI, which in turn predicted adult CRP.
Adult socioeconomic status—We additionally examined whether childhood SES had an association with adult CRP independent of adult SES in a post hoc meta-analysis (Supplementary figure S5). The logCRP ratio between highest and lowest SES groups was 1.13 (95% CI: 1.04, 1.23), suggesting that other residual confounding factors not accounted for by adult SES may also mediate this association.
A
uthor Man
uscr
ipt
A
uthor Man
uscr
ipt
A
uthor Man
uscr
ipt
A
uthor Man
uscr
DISCUSSION
This meta-analysis of nine population-based cohort and cross-sectional studies showed that low childhood SES, predominantly quantified by parental education and occupation in minimally-adjusted linear regression models, was associated with a moderately increased CRP level in adulthood. The geometric mean CRP level was 25% higher in those with the lowest SES in childhood, compared with the referent group of high SES. This finding was supported by a second meta-analysis of five additional studies which reported a moderate (23%) increase in the odds for ‘high risk’ CRP levels in those with low SES in childhood, compared with the referent highest SES category.
To our knowledge, our systematic review is the first to report an association between childhood SES and adulthood CRP. One previous systematic review[22] of observational studies, published through to 2006, reported cross-sectional associations between adult SES and CRP, but inconsistent evidence of an association between childhood SES and adult CRP. We report a more consistent relationship between childhood SES and adulthood CRP, likely reflecting inclusion of published studies in the last decade.
The clinical significance of our finding is imperfectly estimated by drawing parallels to the effect of statin therapy on adult CRP. An overall 25% decrease in CRP level between high and low SES groups found in our meta-analysis broadly corresponds to the expected anti-inflammatory effects from statin therapy, which is mainly used to lower LDL cholesterol but also lowers CRP by around 17-43% in healthy adults.[49–51] However, we should interpret this finding cautiously, as the causal role of CRP in CVD pathogenesis is contested.[28] Consistent observational data demonstrates a strong association,[52] but Mendelian randomisation studies suggest CRP is consequence of confounding factors such as obesity, rather than a causal factor in CVD pathogenesis.[28]
Evidence for Life-course Models
Our results support the chain of risk (indirect effects) model (pathway B3 or B4, Figure 1), where childhood SES influences BMI to increase CRP in adulthood. The most compelling evidence for this is reported by Nazmi et al.,[41] a cohort study of Brazilian young adults. They demonstrate differing social gradients in CRP between men and women, dependent on the measure of SES. Higher family income was associated with higher CRP in men, but not in women. In contrast, higher maternal education was associated with lower CRP, in women, but not men. They concluded that the social patterning of obesity influenced the association between childhood SES and adult CRP.[41] Two further studies[38, 47] support this by using path analysis to demonstrate a significant role for BMI in the pathway between childhood SES and adult CRP. Comparison of the original meta-analysis of minimally adjusted associations between childhood SES and adult CRP (Figure 3) with a post hoc meta-analysis of BMI-adjusted associations (Supplementary figure S4), led to an attenuation the summary estimate. This suggests that adult BMI is a likely mediator of the association between childhood SES and adult CRP. Furthermore, analysis of the US National Health and Nutrition Examination Survey (NHANES) suggests that the inverse association between parental measures of SES and CRP in childhood is partly mediated by childhood BMI.[53] This is in keeping with our proposed model where low SES affects childhood BMI and
A
uthor Man
uscr
ipt
A
uthor Man
uscr
ipt
A
uthor Man
uscr
ipt
A
uthor Man
uscr
hence adult BMI, leading to increased adult CRP (pathway B4, Figure 1). Few studies had additional childhood BMI data, precluding comment on the contribution of childhood or lifetime trajectories of BMI to adult BMI and inflammatory outcomes.
Alternative hypotheses may include a pathway through adult SES, in which one would expect attenuation of an association when analyses include adult SES as a covariate. We did not find evidence for this in the limited meta-analysis of adult SES-adjusted linear regression models (Supplementary figure S5).
Plausible Biological Mechanisms
C-reactive protein is strongly associated with obesity and the relationship is complex. Mendelian randomisation studies have suggested that genetic variants associated with BMI are determinants of CRP levels,[54, 55] rather than the converse. This implies obesity leads to higher CRP, and cytokines from adipose tissue plausibly contribute to chronic
inflammation.[56] Conversely, ex vivo immunological data suggest lower childhood SES is associated with greater immune dysregulation,[57] which may prime for heightened inflammatory responses to subsequent stimuli, such as infection.[58] Epidemiological evidence suggests childhood infections are associated with increased BMI and other cardio-metabolic outcomes, but only in those with low family incomes.[59, 60] A dysregulated host inflammatory response to infection may contribute to pathology in a number of key stages in atherosclerotic disease[61] and lipid metabolism.[62] The causal relationship between obesity and inflammation is unlikely to be unidirectional, and the mechanisms suggested are not mutually exclusive.
Strengths and Limitations
Strengths of the current review are the consistency of results across two methodologies, over multiple exposure measures, and in a number of different populations. Most studies (18/21) found an association between childhood SES and adult CRP. Only one study from those reporting any association found an inverse association between childhood SES and adult CRP.
Residual confounding is a concern in meta-analyses of observational studies. The strength of this review in examining childhood exposures and adult outcomes means most traditional ‘confounders’ will lie temporally between the exposure and outcome as intermediate variables. Adjustment for such variables in this situation is typically considered over-adjustment and will increase bias towards the null hypothesis,[63] but residual confounding through grandparental factors, for example, may still bias our result in an unpredictable manner.
Heterogeneity in study-specific analyses prevented inclusion of all studies into a meta-analysis, introducing a potential source of selection bias where only favourable studies with easily extractable analyses were included. We addressed this in two ways – firstly by contacting authors for further data where possible, and secondly by examining asymmetry in funnel plots and performing tests for publication bias where appropriate, although the small number of studies means that publication bias is difficult to assess. Replication of our findings in other cohorts is warranted.
A
uthor Man
uscr
ipt
A
uthor Man
uscr
ipt
A
uthor Man
uscr
ipt
A
uthor Man
uscr
Future Directions
Understanding the determinants and effects of each component of childhood SES, including parental education, income and occupation, may provide novel targets for interventions. We report that both parental occupation status and education were associated with adult CRP. Parental education, a widely used measure of SES, reflects a family’s ability to improve health literacy[64] and is reflected in rates of adverse health behaviours such as smoking, alcohol consumption and sedentary behaviour, all risk factors for cardio-metabolic disease. Parental occupation directly impacts on material resources to the family, but also represents relative social standing, social networks, and work-related stresses and autonomy.[64] Differences in social health behaviours may provide a strong explanatory factor in socioeconomic health disparities, but should be interpreted within the appropriate cultural context – the social patterning of smoking for example, is not as strong in France compared to the UK, and consequently contributes less to the social gradient in all-cause mortality.[3]
In conclusion, we report strong evidence of an association between low childhood social circumstances and increased CRP in adulthood. There is support for a chain of risk (indirect effects) model where the association between childhood SES and adult CRP is mediated through adult BMI. Extending this model to other socially-patterned health behaviours may increase understanding of the underlying mechanisms and focus research into novel interventions at an earlier age when they may reduce cumulative exposure to low lifetime SES, or break the chains of risk originating from childhood.
Supplementary Material
Refer to Web version on PubMed Central for supplementary material.
Acknowledgments
The study authors would like to acknowledge Ms Poh Chua for her assistance with Ovid Medline and Embase databases in helping to devise literature searches for this systematic review.
Funding statement
This work was supported by the Australian National Health and Medical Research Council (Postgraduate Scholarship 1114567 to R. S. L., Senior Research Fellowships 1046518 to M. W. and 1064629 to D. P. B., Early Career Fellowship 1037449 and Career Development Fellowship 1111160 to F. K. M.); by the Center for Integrative Approaches to Health Disparities (P60MD002249 to A. E. A.); NIH National Institute of Diabetes, Digestive, and Kidney Diseases (R01DK087864 to A. E. A.); the Carolina Population Center and its NIH Center grant (P2C HD050924 to A. E. A.); the Australian Government (an Australian Postgraduate Award to C. E. G.); and the Murdoch Childrens Research Institute (Murdoch Childrens Research Institute Top Up Scholarship to C. E. G.). Research at the Murdoch Childrens Research Institute is supported by the Victorian Government’s Operational Infrastructure Program. The funding bodies did not play any role in the study.
References
1. Marmot M. The health gap: the challenge of an unequal world. Lancet. 2015; 386:2442–4. [PubMed: 26364261]
2. Marmot MG, Kogevinas M, Elston MA. Social/economic status and disease. Annu Rev Public Health. 1987; 8:111–35. [PubMed: 3555518]
3. Stringhini S, Dugravot A, Kivimaki M, et al. Do different measures of early life socioeconomic circumstances predict adult mortality? Evidence from the British Whitehall II and French GAZEL studies. J Epidemiol Community Health. 2011; 65:1097–103. [PubMed: 20675701]
A
uthor Man
uscr
ipt
A
uthor Man
uscr
ipt
A
uthor Man
uscr
ipt
A
uthor Man
uscr
4. Power C, Atherton K, Strachan DP, et al. Life-course influences on health in British adults: effects of socio-economic position in childhood and adulthood. Int J Epidemiol. 2007; 36:532–9. [PubMed: 17255345]
5. Galobardes B, Lynch JW, Smith GD. Is the association between childhood socioeconomic
circumstances and cause-specific mortality established? Update of a systematic review. J Epidemiol Community Health. 2008; 62:387–90. [PubMed: 18413449]
6. Galobardes B, Lynch JW, Davey Smith G. Childhood socioeconomic circumstances and cause-specific mortality in adulthood: systematic review and interpretation. Epidemiol Rev. 2004; 26:7– 21. [PubMed: 15234944]
7. Gliksman MD, Kawachi I, Hunter D, et al. Childhood socioeconomic status and risk of cardiovascular disease in middle aged US women: a prospective study. J Epidemiol Community Health. 1995; 49:10–5. [PubMed: 7706992]
8. Roberts CB, Couper DJ, Chang PP, et al. Influence of life-course socioeconomic position on incident heart failure in blacks and whites: the Atherosclerosis Risk in Communities Study. Am J Epidemiol. 2010; 172:717–27. [PubMed: 20696652]
9. Ramsay SE, Whincup PH, Morris RW, et al. Are childhood socio-economic circumstances related to coronary heart disease risk? Findings from a population-based study of older men. Int J Epidemiol. 2007; 36:560–6. [PubMed: 17440028]
10. Lidfeldt J, Li TY, Hu FB, et al. A prospective study of childhood and adult socioeconomic status and incidence of type 2 diabetes in women. Am J Epidemiol. 2007; 165:882–9. [PubMed: 17284723]
11. Maty SC, Lynch JW, Raghunathan TE, et al. Childhood socioeconomic position, gender, adult body mass index, and incidence of type 2 diabetes mellitus over 34 years in the Alameda County Study. Am J Public Health. 2008; 98:1486–94. [PubMed: 18556612]
12. Parsons TJ, Power C, Logan S, et al. Childhood predictors of adult obesity: a systematic review. Int J Obes Relat Metab Disord. 1999; 23(Suppl 8):S1–107.
13. Emerging Risk Factors C, Kaptoge S, Di Angelantonio E, et al. C-reactive protein concentration and risk of coronary heart disease, stroke, and mortality: an individual participant meta-analysis. Lancet. 2010; 375:132–40. [PubMed: 20031199]
14. Hansson GK. Inflammation, atherosclerosis, and coronary artery disease. N Engl J Med. 2005; 352:1685–95. [PubMed: 15843671]
15. Ridker PM, Cushman M, Stampfer MJ, et al. Inflammation, aspirin, and the risk of cardiovascular disease in apparently healthy men. N Engl J Med. 1997; 336:973–9. [PubMed: 9077376]
16. Stringhini S, Batty GD, Bovet P, et al. Association of lifecourse socioeconomic status with chronic inflammation and type 2 diabetes risk: the Whitehall II prospective cohort study. PLoS Med. 2013; 10:e1001479. [PubMed: 23843750]
17. Kuh D, Ben-Shlomo Y, Lynch J, et al. Life course epidemiology. J Epidemiol Community Health. 2003; 57:778–83. [PubMed: 14573579]
18. Hallqvist J, Lynch J, Bartley M, et al. Can we disentangle life course processes of accumulation, critical period and social mobility? An analysis of disadvantaged socio-economic positions and myocardial infarction in the Stockholm Heart Epidemiology Program. Soc Sci Med. 2004; 58:1555–62. [PubMed: 14759698]
19. Loucks EB, Pilote L, Lynch JW, et al. Life course socioeconomic position is associated with inflammatory markers: the Framingham Offspring Study. Soc Sci Med. 2010; 71:187–95. [PubMed: 20430502]
20. Tabassum F, Kumari M, Rumley A, et al. Effects of socioeconomic position on inflammatory and hemostatic markers: a life-course analysis in the 1958 British birth cohort. Am J Epidemiol. 2008; 167:1332–41. [PubMed: 18367468]
21. Galobardes B, Lynch J, Smith GD. Measuring socioeconomic position in health research. Br Med Bull. 2007; 81–82:21–37.
22. Nazmi A, Victora CG. Socioeconomic and racial/ethnic differentials of C-reactive protein levels: a systematic review of population-based studies. BMC Public Health. 2007; 7:212. [PubMed: 17705867]
A
uthor Man
uscr
ipt
A
uthor Man
uscr
ipt
A
uthor Man
uscr
ipt
A
uthor Man
uscr
23. Kivimaki M, Lawlor DA, Juonala M, et al. Lifecourse socioeconomic position, C-reactive protein, and carotid intima-media thickness in young adults: the cardiovascular risk in Young Finns Study. Arterioscler Thromb Vasc Biol. 2005; 25:2197–202. [PubMed: 16123322]
24. Gruenewald TL, Cohen S, Matthews KA, et al. Association of socioeconomic status with inflammation markers in black and white men and women in the Coronary Artery Risk Development in Young Adults (CARDIA) study. Soc Sci Med. 2009; 69:451–9. [PubMed: 19524346]
25. Steptoe A, Kunz-Ebrecht S, Owen N, et al. Influence of socioeconomic status and job control on plasma fibrinogen responses to acute mental stress. Psychosom Med. 2003; 65:137–44. [PubMed: 12554825]
26. Wilson TW, Kaplan GA, Kauhanen J, et al. Association between Plasma Fibrinogen Concentration and Five Socioeconomic Indices in the Kuopio Ischemic Heart Disease Risk Factor Study. Am J Epidemiol. 1993; 137:292–300. [PubMed: 8452137]
27. Jousilahti P, Salomaa V, Rasi V, et al. Association of markers of systemic inflammation, C reactive protein, serum amyloid A, and fibrinogen, with socioeconomic status. J Epidemiol Community Health. 2003; 57:730–3. [PubMed: 12933781]
28. Collaboration CRPCHDG. Wensley F, Gao P, et al. Association between C reactive protein and coronary heart disease: mendelian randomisation analysis based on individual participant data. BMJ. 2011; 342:d548. [PubMed: 21325005]
29. Shanahan L, Freeman J, Bauldry S. Is very high C-reactive protein in young adults associated with indicators of chronic disease risk? Psychoneuroendocrinology. 2014; 40:76–85. [PubMed: 24485478]
30. Liu RS, Aiello AE, Mensah FK, et al. Socioeconomic position in childhood and inflammatory biomarkers in adulthood: a systematic review and meta-analysis. CRD42016038683. PROSPERO: international prospective register of systematic reviews. 2016
31. Stroup DF, Berlin JA, Morton SC, et al. Meta-analysis of observational studies in epidemiology: a proposal for reporting. Meta-analysis Of Observational Studies in Epidemiology (MOOSE) group. JAMA. 2000; 283:2008–12. [PubMed: 10789670]
32. Appleton AA, Buka SL, McCormick MC, et al. The association between childhood emotional functioning and adulthood inflammation is modified by early-life socioeconomic status. Health Psychol. 2012; 31:413–22. [PubMed: 22329424]
33. Brummett BH, Babyak MA, Singh A, et al. Socioeconomic indices as independent correlates of C-reactive protein in the National Longitudinal Study of Adolescent Health. Psychosom Med. 2013; 75:882–93. [PubMed: 24163384]
34. Camelo LV, Giatti L, Neves JA, et al. Life course socioeconomic position and C-reactive protein: mediating role of health-risk behaviors and metabolic alterations. The Brazilian Longitudinal Study of Adult Health (ELSA-Brasil). PLoS One. 2014; 9:e108426. [PubMed: 25309988] 35. Danese A, Moffitt TE, Harrington H, et al. Adverse childhood experiences and adult risk factors
for age-related disease: depression, inflammation, and clustering of metabolic risk markers. Arch Pediatr Adolesc Med. 2009; 163:1135–43. [PubMed: 19996051]
36. Gimeno D, Ferrie JE, Elovainio M, et al. When do social inequalities in C-reactive protein start? A life course perspective from conception to adulthood in the Cardiovascular Risk in Young Finns Study. Int J Epidemiol. 2008; 37:290–8. [PubMed: 18056120]
37. Gustafsson PE, San Sebastian M, Janlert U, et al. Life-course accumulation of neighborhood disadvantage and allostatic load: empirical integration of three social determinants of health frameworks. Am J Public Health. 2014; 104:904–10. [PubMed: 24625161]
38. Hagger-Johnson G, Mottus R, Craig LC, et al. Pathways from childhood intelligence and socioeconomic status to late-life cardiovascular disease risk. Health Psychol. 2012; 31:403–12. [PubMed: 22309883]
39. Jones R, Hardy R, Sattar N, et al. Novel coronary heart disease risk factors at 60–64 years and life course socioeconomic position: the 1946 British birth cohort. Atherosclerosis. 2015; 238:70–6. [PubMed: 25437893]
A
uthor Man
uscr
ipt
A
uthor Man
uscr
ipt
A
uthor Man
uscr
ipt
A
uthor Man
uscr
40. McDade TW, Hoke M, Borja JB, et al. Do environments in infancy moderate the association between stress and inflammation in adulthood? Initial evidence from a birth cohort in the Philippines. Brain Behav Immun. 2013; 31:23–30. [PubMed: 22960631]
41. Nazmi A, Oliveira IO, Horta BL, et al. Lifecourse socioeconomic trajectories and C-reactive protein levels in young adults: findings from a Brazilian birth cohort. Soc Sci Med. 2010; 70:1229–36. [PubMed: 20137842]
42. Nikulina V, Widom CS. Do race, neglect, and childhood poverty predict physical health in adulthood? A multilevel prospective analysis. Child Abuse Negl. 2014; 38:414–24. [PubMed: 24189205]
43. Packard CJ, Bezlyak V, McLean JS, et al. Early life socioeconomic adversity is associated in adult life with chronic inflammation, carotid atherosclerosis, poorer lung function and decreased cognitive performance: a cross-sectional, population-based study. BMC Public Health. 2011; 11:42. [PubMed: 21241479]
44. Phillips JE, Marsland AL, Flory JD, et al. Parental education is related to C-reactive protein among female middle-aged community volunteers. Brain Behav Immun. 2009; 23:677–83. [PubMed: 19486653]
45. Pollitt RA, Kaufman JS, Rose KM, et al. Early-life and adult socioeconomic status and
inflammatory risk markers in adulthood. Eur J Epidemiol. 2007; 22:55–66. [PubMed: 17225957] 46. Slopen N, Loucks EB, Appleton AA, et al. Early origins of inflammation: An examination of
prenatal and childhood social adversity in a prospective cohort study. Psychoneuroendocrinology. 2015; 51:403–13. [PubMed: 25462912]
47. Taylor SE, Lehman BJ, Kiefe CI, et al. Relationship of early life stress and psychological functioning to adult C-reactive protein in the coronary artery risk development in young adults study. Biol Psychiatry. 2006; 60:819–24. [PubMed: 16712805]
48. Monteiro CA, Conde WL, Popkin BM. Income-specific trends in obesity in Brazil: 1975–2003. Am J Public Health. 2007; 97:1808–12. [PubMed: 17761560]
49. Asher J, Houston M. Statins and C-reactive protein levels. J Clin Hypertens (Greenwich). 2007; 9:622–8. [PubMed: 17673884]
50. Albert MA, Danielson E, Rifai N, et al. Effect of statin therapy on C-reactive protein levels: the pravastatin inflammation/CRP evaluation (PRINCE): a randomized trial and cohort study. JAMA. 2001; 286:64–70. [PubMed: 11434828]
51. Ridker PM, Danielson E, Fonseca FA, et al. Rosuvastatin to prevent vascular events in men and women with elevated C-reactive protein. N Engl J Med. 2008; 359:2195–207. [PubMed: 18997196]
52. Albert MA, Glynn RJ, Ridker PM. Plasma concentration of C-reactive protein and the calculated Framingham Coronary Heart Disease Risk Score. Circulation. 2003; 108:161–5. [PubMed: 12835213]
53. Schmeer KK, Yoon A. Socioeconomic status inequalities in low-grade inflammation during childhood. Arch Dis Child. 2016
54. Timpson NJ, Lawlor DA, Harbord RM, et al. C-reactive protein and its role in metabolic syndrome: mendelian randomisation study. Lancet. 2005; 366:1954–9. [PubMed: 16325697] 55. Timpson NJ, Nordestgaard BG, Harbord RM, et al. C-reactive protein levels and body mass index:
elucidating direction of causation through reciprocal Mendelian randomization. Int J Obes. 2011; 35:300–8.
56. Yudkin JS, Stehouwer CD, Emeis JJ, et al. C-reactive protein in healthy subjects: associations with obesity, insulin resistance, and endothelial dysfunction: a potential role for cytokines originating from adipose tissue? Arterioscler Thromb Vasc Biol. 1999; 19:972–8. [PubMed: 10195925] 57. Dowd JB, Aiello AE. Socioeconomic differentials in immune response. Epidemiology. 2009;
20:902–8. [PubMed: 19797966]
58. Azad MB, Lissitsyn Y, Miller GE, et al. Influence of socioeconomic status trajectories on innate immune responsiveness in children. PLoS One. 2012; 7:e38669. [PubMed: 22685596]
59. Liu RS, Burgner DP, Sabin MA, et al. Childhood Infections, Socioeconomic Status, and Adult Cardiometabolic Risk. Pediatrics. 2016; 137
A
uthor Man
uscr
ipt
A
uthor Man
uscr
ipt
A
uthor Man
uscr
ipt
A
uthor Man
uscr
60. Burgner DP, Sabin MA, Magnussen CG, et al. Infection-Related Hospitalization in Childhood and Adult Metabolic Outcomes. Pediatrics. 2015; 136:e554–62. [PubMed: 26283782]
61. Nieto FJ. Infections and atherosclerosis: new clues from an old hypothesis? Am J Epidemiol. 1998; 148:937–48. [PubMed: 9829865]
62. Lawson JS. Multiple Infectious Agents and the Origins of Atherosclerotic Coronary Artery Disease. Front Cardiovasc Med. 2016; 3:30. [PubMed: 27672638]
63. Schisterman EF, Cole SR, Platt RW. Overadjustment bias and unnecessary adjustment in epidemiologic studies. Epidemiology. 2009; 20:488–95. [PubMed: 19525685]
64. Galobardes B, Shaw M, Lawlor DA, et al. Indicators of socioeconomic position (part 1). J Epidemiol Community Health. 2006; 60:7–12.
A
uthor Man
uscr
ipt
A
uthor Man
uscr
ipt
A
uthor Man
uscr
ipt
A
uthor Man
uscr
What is already known on this subject?
The mechanisms underlying the relationship between socioeconomic status and diverse health outcomes are unclear. Chronic inflammation is implicated in the pathogenesis of multiple non-communicable diseases, many of which are postulated to have their origins in early life. To better understand how socioeconomic status leads to inflammation-related chronic disease, we sought to quantify the association between childhood socioeconomic status and adult C-reactive protein, a marker of chronic inflammation.
What this study adds?
This meta-analysis shows that lower childhood socioeconomic status, when measured by parental occupation or education, is associated with higher adult C-reactive protein. This association is attenuated by obesity, indicating a potential mediating mechanism by which early socioeconomic status may influence later life health outcomes.
A
uthor Man
uscr
ipt
A
uthor Man
uscr
ipt
A
uthor Man
uscr
ipt
A
uthor Man
uscr
Figure 1. Directed Acyclic Graph Outlining Potential Mechanisms Through Which Childhood SES Determines Adult C-Reactive Protein
Mechanisms broadly categorised into 2 life-course models, the critical period model (A) and the chain of risk models (B) [17]. Model A1 (direct effect of childhood SES on adult CRP) posits a critical window early in life where later life CRP is determined. Model B1 (indirect effect via adult SES), Model B2 (indirect effect via childhood BMI, and adult SES), Model B3 (indirect effect via childhood BMI to adult SES to adult BMI) and Model B4 (indirect effect via BMI in childhood and adulthood) posit that a chain of risk factors accumulate throughout life to increase CRP levels in adulthood. SES, socioeconomic status; BMI, body mass index; CRP, C-reactive protein.
A
uthor Man
uscr
ipt
A
uthor Man
uscr
ipt
A
uthor Man
uscr
ipt
A
uthor Man
uscr
Figure 2. Flowchart Detailing Numbers of Studies Screened, Assessed and Included in the Review, with Reasons for Exclusions
A
uthor Man
uscr
ipt
A
uthor Man
uscr
ipt
A
uthor Man
uscr
ipt
A
uthor Man
uscr
Figure 3. Unadjusted or Minimally Adjusted Results from Stratified Meta-Analysis of the Association Between Childhood Socioeconomic Circumstance and Adult Geometric Mean CRP Levels (Random-Effects Model), according to study design
Relative change in CRP comparing the lowest SES category with the highest SES category, according to either parental, maternal or paternal occupational rank, education level or childhood adversity. Solid diamonds represent study-specific point estimates; squares represent study-specific weights in stratified and final meta-analyses; horizontal bars represent 95% confidence intervals, and hollow diamonds represent summary estimates, with the width of the diamond corresponding to the 95% confidence interval of the summary. Income-based estimates were excluded if occupation-based estimates were available from the same study, and occupation estimates excluded if education estimates available, to avoid over weighting papers that conducted multiple analyses on the same population. Meta-analysis stratified according to study design and whether parental SES data was collected longitudinally or retrospectively. CRP, C-reactive protein; SES, socioeconomic status.
A
uthor Man
uscr
ipt
A
uthor Man
uscr
ipt
A
uthor Man
uscr
ipt
A
uthor Man
uscr
A
uthor Man
uscr
ipt
A
uthor Man
uscr
ipt
A
uthor Man
uscr
ipt
A
uthor Man
uscr
ipt
T ab le 1Summary of Included P
aper Characteristics Related to C-Reacti
v e Protein. Citation Country Sample Size Exposur es in v estigated Study period P
articipant Age, in years
a
CRP Limits and Criteria, in mg/L
b
Findings
Appleton, 2012 [
32 ] United States 914 Highest P arental Education Highest P arental Occupation T
otal Annual Income
1959–2005 42 (1.8) >10 e xcluded CRP w as signif
icantly associated with
parental education b
ut not with
household income or parental
occupation. The direction of association
w
as not stated.
Brummett, 2013 [
33 ] United States 11,371 Highest P arental Education Built En vironment Rating 1995–2009 29 [24–32] >10 e xcluded CRP w
as weakly b
ut signif icantly ne g ati v
ely correlated to parental
education in unadjusted analyses.
Camelo, 2014 [
34 ] Brazil 13,371 Maternal Education 2008–2010 52 [35–74]
Age and se
x adjusted geometric mean
CRP w
as lo
wer in those with higher
maternal education le
v
els in both men
and w
omen.
After adjustment for young adulthood
and adulthood SES indicators, childhood
SES did not remain signif
icantly
associated with CRP in an
y se
x.
Danese, 2009 [
35 ] Ne w Zealand 972 Highest P arental Occupation 1972–2005 32
High risk: >3
A
v
erage childhood SES w
as associated
with a 1.59-fold increase (95% CI: 1.00, 2.52) in the risk of high CRP compared with high childhood SES, while lo
w
childhood SES w
as associated with a
1.96-fold increase (95% CI: 1.19, 3.25)
in bi
v
ariate analyses.
Gimeno, 2008 [
36 ] Finland 1,484 Highest P arental Education Highest P arental Occupation 1980–2001 [24–39] >10 e xcluded
In age and se
x-adjusted analyses, no
signif
icant dif
ference in geometric mean
CRP w
as seen between high and lo
w
cate
gories of parental occupational status
or education.
Gustaf
fson, 2014 [
37 ] Sweden 871 Cumulati v e Neighbourhood Disadv antage Score 1981–2008 43
High risk: 3–10
In unadjusted analyses, neighbourhood disadv
antage at age 16 led to a 1.17-fold
increase (95% CI: 1.01, 1.34) in the odds of high risk CRP at age 43 (
P
= 0.03).
After adjustment for BMI and
neighbourhood disadv
antage at age 43,
this association became non-signif
icant
(OR 1.09, 95% CI: 0.94, 1.26).
Hagger
-Johnson, 2012 [
38 ] Scotland 1,091 P arental Occupation 1936–2007 70 [67–71] >10 e xcluded
Structural equation models re
v
ealed
lo
wer SES as a predictor of higher BMI (β
= −0.17), while higher BMI (
β
=
0.23) predicted higher CRP v
alues. The
path from parental SES to o
wn SES then
to BMI w
as also signif
icant (
β
= −0.01,
P
A
uthor Man
uscr
ipt
A
uthor Man
uscr
ipt
A
uthor Man
uscr
ipt
A
uthor Man
uscr
ipt
Citation Country Sample Size Exposur es in v estigated Study period Participant Age, in years
a
CRP Limits and Criteria, in mg/L
b
Findings
Jones, 2015 [
39 ] Britain 2,077 P aternal Occupation 1946–2011 [60–64] CRP w as signif
icantly associated with
SES in childhood in age and se
x-adjusted
analyses. In the childhood and early adulthood-accumulation model, each additional stage in manual vs.
non-manual social class w
as associated with a
16.3% (95% CI: 9.6, 23.0) increase in CRP
. This association decreased after
adjustment for BMI and cig
arette
smoking.
Ki
vimaki, 2005 [
23 ] Finland 2,290 Highest P arental Education Highest P arental Occupation 1980–2001 [24–39]
In age and se
x-adjusted analyses, higher
parental occupational status b
ut not
parental education w
as associated with
lo
wer CRP
. Adjustment for BMI and
w
aist-to-hip ratio attenuated the
association for parental occupational
status.
Loucks, 2010 [
19 ] United States 1,413 P aternal Education 1971–2001 [41–81]
Children with less than a high school le
v
el of paternal education had an
estimated 0.163 (95% CI: 0.023, 0.302)
higher natural log CRP units than children whose f
athers had recei
v
ed
education be
yond high school.
McDade, 2013 [
40
]
Philippines
1,622
Combined Income
Combined Household Assets
1983–2005
[20–22]
No direct association w
as found between
childhood household income and adult CRP (
β
= 0.003, SE = 0.018,
P
= 0.9), or
assets (
β
= 0.005, SE = 0.026,
P
= 0.7) in
bi
v
ariate models.
Nazmi, 2010 [
41
]
Brazil
4,297
Maternal Education F
amily Income
1982–2005
23
In unadjusted analyses, men in the
highest f
amily income group at birth had
42% (95% CI: 21, 56) higher CRP le
v
els
than men in the lo
west group.
Adjustment for race/ethnicity
, age,
family income at birth, and maternal
education strengthened the association.
Higher maternal education w
as
associated with a 43% (95% CI: 12, 81)
decrease in CRP le
v
els in w
omen.
Adjustment for race/ethnicity
, age,
family income at birth, and f
amily
income strengthened the association
(53% (95% CI: 13, 107).
Nikulina, 2014 [
42 ] United States 625 Childhood Ne glect 1967–2005 25.8 (3.5)
High risk: >1
Childhood ne
glect increased the odds of
high CRP by 1.23-fold (95% CI: 0.83,
1.84).
P
ackard, 2011 [
43 ] Scotland 666 P aternal Occupation 2005–2007 [35–64]
Manual paternal occupational cate
gory
,
A
uthor Man
uscr
ipt
A
uthor Man
uscr
ipt
A
uthor Man
uscr
ipt
A
uthor Man
uscr
ipt
Citation Country Sample Size Exposur es in v estigated Study period Participant Age, in years
a
CRP Limits and Criteria, in mg/L
b
Findings
0.118, 0.595) (
P
< 0.001) in
multi
v
ariable models adjusted for age,
se
x, and other childhood SES f
actors.
Phillips, 2009 [
44 ] United States 811 Highest P arental Education 2001–2005 [30–54] >10 e xcluded There w
as no signif
icant association
between parental education and CRP for men. An in
v
erse association between
parental education and CRP w
as seen in
w
omen, with each additional year of
parental education resulting in a 0.153
mg/L decrease in mean CRP
.
Pollitt, 2007 [
45 ] United States 12,681 P aternal Education P
aternal Occupation Area Le
v
el SES
1987–1998
[52–75]
Lo
west paternal education and childhood social class w
as associated with
non-signif
icant increase in CRP compared
with highest paternal education and childhood social class among whites. Findings were less consistent among African-Americans. Associations attenuated after adjustment for adult social class and CVD risk f
actors,
especially BMI, smoking and HDL-C.
Shanahan, 2014 [
29 ] United States 13,257 Highest P arental Education 1994–2008 [24–34]
High risk: >10 Lo
w risk: <3
Unadjusted analyses reported a 0.87-fold (95% CI: 0.82, 0.92) change in the odds of v
ery high CRP in the highest parental
education cate
gory compared to the lowest.
Slopen, 2015 [
46
]
United States
355
Prenatal And Childhood
Adv ersity 2005–2007 42.1 (1.7) High le v
els of childhood adv
ersity were
associated with an increased CRP in
adulthood in bi
v
ariate associations (
β
=
0.43, 95% CI: 0.002, 0.85).
Stringhini, 2013 [
16 ] United Kingdom 6,387 P aternal Occupation Cumulati v
e SES Score
1991–2009
[48–51]
>10 e
xcluded
P
articipants in the lo
west paternal
occupational group were 1.36-fold (95% CI: 1.17, 1.59) more lik
ely to ha
v
e high
CRP compared to the reference, when adjusted for age, se
x, ethnicity
, f
amily
history of diabetes, pre
v
alent conditions,
smoking, ph
ysical acti
vity
, and diet.
T
abassum, 2008 [
20 ] United Kingdom 8,975 P arental Occupation Cumulati v
e SES Score
1958–2004
[44–45]
F
or men: unadjusted association between social class at birth and CRP (
β
= 0.10,
95% CI: 0.06, 0.13,
P
< 0.001 per lo
wer
skilled social class cate
gory), after
adjustment (
β
= 0.07, 95% CI: 0.03,
0.11,
P
< 0.001). F
or w
omen: unadjusted
association between social class at birth and CRP (
β
= 0.10, 95% CI: 0.05, 0.14,
P
< 0.001), after adjustment (
β
= 0.08,
95% CI: 0.03, 0.12,
P
< 0.001).
T
aylor
, 2006 [
47 ] United States 3,248 Mean P arental Education 1985–2001 [32–47] P
ath models sho
wed that higher
childhood SES predicted lo
wer BMI (
A
uthor Man
uscr
ipt
A
uthor Man
uscr
ipt
A
uthor Man
uscr
ipt
A
uthor Man
uscr
ipt
Citation
Country
Sample Size
Exposur
es in
v
estigated
Study period
P
articipant Age, in years
a
CRP Limits and Criteria, in mg/L
b
Findings
= − 0.16), which predicted ele
v
ated CRP
(
β
= 0.45). Higher childhood SES also predicted a less risk
y early f
amily
en
vironment (
β
= −0.13), which
predicted psychosocial functioning (
β
=
−0.53), which ultimately predicted lo
wer
CRP (
β
= −0.04).
BMI, body mass inde
x; CVD, cardio
v
ascular disease; CI, conf
idence interv
al; CRP
, c-reacti
v
e protein; SES, socioeconomic status; OR, odds ratio.
a Age e
xpressed as mean (SD) [range] where data were a
v
ailable.
b Criteria outline study-specif
ic criteria used to def
ine either their study sample (e
xclusions) or the high risk cate
A
uthor Man
uscr
ipt
A
uthor Man
uscr
ipt
A
uthor Man
uscr
ipt
A
uthor Man
uscr
ipt
T ab le 2Summary of Study-Specif
ic Unadjusted Associations Between Childhood Socioeconomic Circumstance and Adult C-reacti
v
e Protein Le
v
els, Grouped by
Statistical Method. Statistical method used
Citation OCC EDU INC O TH
Mean comparison tests
Appleton, 2012 [
32 ] o U o Correlation
Brummett, 2013 [
33
]
−
Cate
gorical outcome based (risk ratios/odds ratios/logistic re
gression)
Danese, 2009 [
35
]
−
Gustaf
fson, 2014 [
37
]
−
Stringhini, 2013 [
16
]
−
Nikulina, 2014 [
42
]
o
Shanahan, 2014 [
29
]
-Geometric mean dif
ferences
Camelo, 2014 [
34
]
−
Gimeno, 2008 [
36
]
o
o
Natural log-transformed linear re
gression models
% dif
ference between lo
west SES, and highest SES
Jones, 2015 [
39
]
−
Nazmi, 2010 [
41 ] Male o + Female − o
Pollitt, 2007 [
45 ] o o Beta coef ficients Ki
vimaki, 2005 [
23
]
−
o
Loucks, 2010 [
19
]
−
P
ackard, 2011 [
43
]
−
T
abassum, 2008 [
20
]
−
Slopen, 2015 [
46
]
−
Structural equation modelling
Hagger
-Johnson, 2012 [
38
]
−
T
aylor
, 2006 [
47
]
−
Reciprocally transformed linear re
gression
Phillips, 2009 [
44 ] Male o Female − T obit re gression model
McDade, 2013 [
40
]
−
The reported associations were classif
ied according to the e
xposure used in analysis. Crosses (+) indicate a signif
icant positi
v
e association, where increasing childhood SES is associated with increasing
adult CRP (
P
< 0.05). Dashes (−) indicate a signif
icant in
v
erse association, where increasing childhood SES is associated with decreasing adult CRP (
P
< 0.05). “U” indicates a signif
A
uthor Man
uscr
ipt
A
uthor Man
uscr
ipt
A
uthor Man
uscr
ipt
A
uthor Man
uscr
ipt
unkno
wn direction (
P
< 0.05). Circles (o) indicate no signif
icant association (
P
> 0.05). OCC, parental occupation; EDU, parental education; INC, parental income; O
TH, other SES measure; SES,
socioeconomic status; CRP
, C-reacti
v