ASSESSMENT OF A COMMUNITY-BASED IMPLEMENTATION OF THE OTAGO EXERCISE PROGRAM
Gabrielle Scronce
A dissertation submitted to the faculty of the University of North Carolina at Chapel Hill in partial fulfillment of the requirements for the degree Doctor of Philosophy in the School of
Medicine (Curriculum in Human Movement Science).
Chapel Hill 2019
ABSTRACT
Gabrielle Scronce: Assessment of a Community-Based Implementation of the Otago Exercise Program
(Under the direction of Vicki Mercer)
Despite evidence that falls can be prevented with specific exercise interventions such as the Otago Exercise Program (OEP), availability of these programs for older adults in the US has been insufficient to address the growing problem of falls, particularly in rural and underserved areas. The Community Health and Mobility Partnership (CHAMP) was developed to address this problem in two communities. In this study, we assessed CHAMP by evaluating changes in physical performance among program participants measured by the Four-stage Balance Test (4SBT), Timed Up and Go test (TUG), and Chair Rise Test (CRT), and in balance confidence measured by the Activities-Specific Balance Confidence scale (ABC).
Participants were adults ≥ 60 years old who completed a CHAMP event from 2009-2017, had increased risk for falls, received the OEP home exercise program through CHAMP, and were recommended to attend CHAMP monthly until falls risk was sufficiently reduced. Statistical models were applied to evaluate change in repeated outcome measures and to relate changes to participant demographic characteristics, number of CHAMP visits attended, time between CHAMP visits, and total duration of participation in the program.
confidence measured by ABC. Improved physical performance varied by each measure but was generally predicted by better baseline physical performance and less frailty.
Among all participants who attended at least one follow-up visit after the initial CHAMP visit, improvement from initial visit to the participant’s final follow-up visit on each of the 3 physical performance measures was associated with shorter duration of time between initial and final visits and better initial visit performance. Better final visit TUG scores were also associated with attending 2 or more follow-up visits.
ACKNOWLEDGEMENTS
TABLE OF CONTENTS
LIST OF TABLES ... x
LIST OF FIGURES ... xi
LIST OF ABBREVIATIONS ... xii
LIST OF RESEARCH VARIABLES ... xiv
Research Variables Collected Only at Initial Visit (IVT) ... xiv
Research Variables Measured Across Visits ... xv
CHAPTER 1: INTRODUCTION ... 1
1.1 Background ... 1
1.2 Statement of the Problem ... 2
1.3 Purpose ... 3
1.4 Aims ... 4
1.5 Significance... 5
1.6 Operational Definitions ... 6
CHAPTER 2: MANUSCRIPT 1 - EFFECTIVENESS OF A NOVEL IMPLEMENTATION OF THE OTAGO EXERCISE PROGRAM IN RURAL APPALACHIA ... 7
2.1 Introduction ... 7
2.2 Methods... 10
2.3 Results ... 17
2.4 Discussion ... 19
2.5 Conclusions ... 23
CHAPTER 3: MANUSCRIPT 2 - CHARACTERISTICS ASSOCIATED WITH IMPROVED PHYSICAL PERFORMANCE AMONG COMMUNITY- DWELLING OLDER ADULTS IN A COMMUNITY-BASED FALLS PREVENTION PROGRAM ... 29
3.1 Introduction ... 29
3.2 Methods... 31
3.2.1 Statistical Analyses ... 34
3.3 Results ... 35
3.4 Discussion ... 37
3.5 Conclusions ... 42
CHAPTER 4: MANUSCRIPT 3 - RELATIONSHIPS BETWEEN NUMBER OF VISITS, LENGTH OF PARTICIPATION, AND OUTCOMES RELATED TO FALLS RISK FOR OLDER ADULTS PARTICIPATING IN A COMMUNITY- BASED FALLS PREVENTION PROGRAM ... 48
4.1 Introduction ... 48
4.2 Methods... 50
4.2.1 Statistical Analysis ... 54
4.3 Results ... 55
4.4 Discussion ... 56
4.5 Conclusions ... 58
5.1: Summary of Results ... 66
5.2 Implications for Clinical Practice and Research ... 70
5.3 Strengths and Weaknesses ... 72
5.4 Future Directions ... 75
APPENDIX A: CHAMP ASSESSMENT SUMMARY FORM ... 77
APPENDIX B: ALGORITHM FOR RISK IDENTIFICATION AND RECOMMENDATIONS FOR CHAMP ... 80
APPENDIX C: CHAMP PARTICIPANT INFORMATION FORM ... 81
APPENDIX D: SCREENING, RISK DETERMINATION, AND FOLLOW-UP VISITS FOR CHAMP PARTICIPANTS ... 84
Risk Level Determination ... 84
Follow-Up ... 84
Enrollment... 84
Screenings ... 84
APPENDIX E: PHYSICAL PERFORMANCE BY FINAL FOLLOW-UP VISIT CATEGORY... 85
APPENDIX F: LITERATURE REVIEW ... 88
Introduction ... 88
Consequences of Falls... 88
Falls Risk Factors ... 88
Measuring Falls ... 90
Physical Performance Measures ... 91
Psychological Measures ... 97
Fall Prevention Interventions ... 98
Multi-component Interventions ... 99
Single Factor Interventions ... 100
Exercise Interventions ... 101
Comparisons of Interventions ... 104
Fall Prevention Program Implementation ... 106
Conclusion ... 107
LIST OF TABLES
Table 1. Comparison of Otago Exercise Program Implementations ... 24
Table 2. Baseline Characteristics of Participants ... 25
Table 3. Mean Scores on 4 Key Outcome Measures at Initial and 2nd Follow-up Visits ... 26
Table 4. Main and Interaction Effects of Group and Visit on 4 Key Outcome Measures ... 26
Table 5. Baseline Characteristics of Participants (N=128) ... 43
Table 6. Mean Changes in Physical Performance Measures ... 44
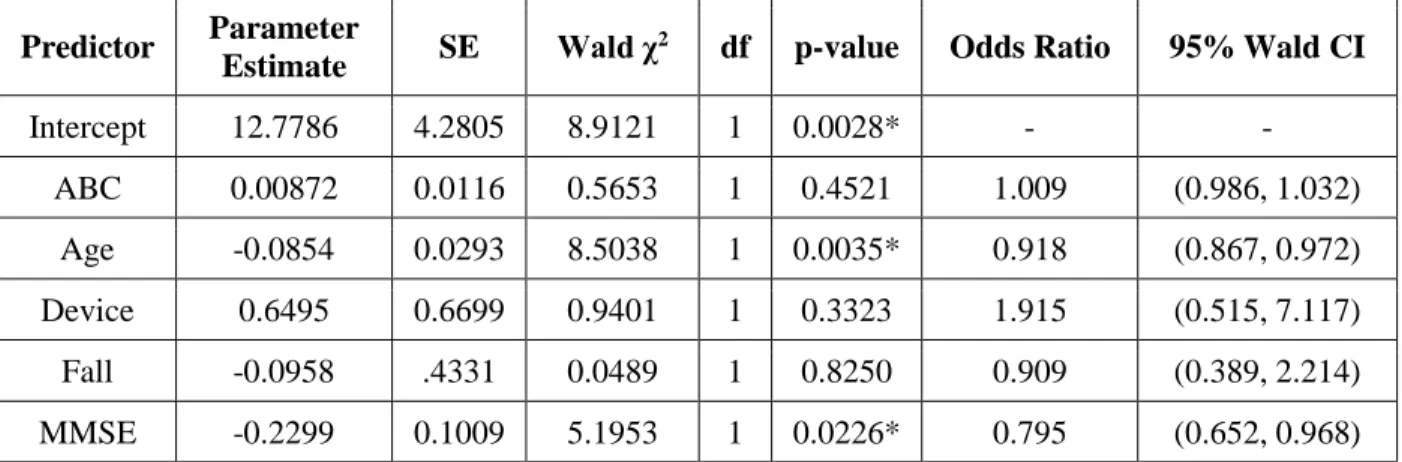
Table 7. Logistic regression analysis of improvement on 4SBT from Initial Visit to Follow-up Visit 2 ... 45
Table 8. Linear regression analysis modeling TUG performance at Follow-up Visit 2 ... 46
Table 9. Logistic regression analysis of improvement on CRT from Initial Visit to Follow-up Visit 2 ... 47
Table 10. Baseline Characteristics of Participants (N=241) ... 60
Table 11. Average Time to Visit and Physical Performance at Each Visit for All Participants ... 61
Table 12. Duration of Participation and Physical Performance at Initial and Final Visits by Final Follow-up Visit Category and for the Total Sample ... 62
LIST OF FIGURES
Figure 1. Screening, Risk Determination, and Follow-up Visits for CHAMP Participants ... 27 Figure 2. Performance on Key Outcome Measures at Initial and 2nd Follow-up Visits
for Total Sample and Each Group ... 27 Figure 3. Scatterplot to describe the 2 predictors and their interaction
LIST OF ABBREVIATIONS
30-s STS 30-second Sit-to-Stand Test 4SBT Four-Stage Balance Test 5xSTS Five Times Sit to Stand Test
ABC Activities-Specific Balance Confidence Scale BBS Berg Balance Scale
BMI body mass index
CDC Centers for Disease Control and Prevention CHAMP Community Health and Mobility Partnership CI Confidence Interval
CRT Chair Rise Test DGI Dynamic Gait Index
EPESE Established Populations for Epidemiologic Studies of the Elderly IVT Initial Visit
F1 1st Follow-up Visit F2 2nd Follow-up Visit
FV Final Visit
FES Falls-Efficacy Scale
FICSIT Frailty and Injuries: Cooperative Studies of Intervention Techniques FRT Functional Reach Test
IRR Incidence Rate Ratio
MOB Matter of Balance
NC North Carolina
OEP Otago Exercise Program
OR Odds Ratio
OT Occupational Therapist
ProFaNE Prevention of Falls Network Europe PT Physical Therapist
ROM Range of Motion SLS Single Limb Stance test
STEADI Stopping Elderly Accidents, Deaths & Injuries TCMBB Tai Chi: Moving for Better Balance
TUG Timed Up and Go Test
LIST OF RESEARCH VARIABLES
Research Variables Collected Only at Initial Visit (IVT) 1. Age was evaluated as an integer beginning at 60 years of age; continuous 2. Gender was female or male; categorical
3. Ethnicity was assessed by a yes or no response to the question, “Do you consider yourself to be Hispanic or Latino?”; categorical
4. Race was reported by selecting one of the following options: American Indian or Alaska Native, Asian, Black or African American, Native Hawaiian or Other Pacific Islander, White, or do not wish to provide in response to the question, “What race do you consider yourself to be?”; categorical
5. Education level was categorized with one of the following responses to the question, “What is the highest level of education you obtained?”: Less than a high school diploma or GED, High school diploma or GED, Associated degree, Bachelor’s degree, Graduate degree; categorical
6. Common chronic conditions were assessed by yes/no responses to the question, “Have you ever had any of the following conditions?” for each of: cardiovascular disease, hypertension, arthritis, diabetes, cancer, osteoporosis, and stroke. Presence or absence of these conditions as well as obesity based on BMI calculation will be summed for a total “number of common chronic conditions” variable with a range of 0-8; continuous 7. BMIwascalculated by self-reported height and measured bodyweight; continuous 8. Number of falls in the past 12 months was entered as an integer in response to the
a. Falls was the number of falls in the past 12 months dichotomized into “yes” for 1 or more falls in the past year, “no” for 0 falls in the past year, categorical
9. Number of falls with injury was an integer response to the question, “How many of these falls resulted in injury?”; continuous
a. Injurious falls was the number of falls with injury in the past 12 months
dichotomized into “yes” for 1 or more injurious falls in the past year, “no” for 0 injurious falls in the past year, categorical
10.Activity limitation was a dichotomous yes/no response to the question, “Do you limit your activities because you are afraid you might fall?”; categorical
11.Mini-mental State Examination (MMSE) was a score (0-30) describing memory and cognition; continuous
Research Variables Measured Across Visits
1. Duration of CHAMP participation was measured as the number of months between the initial CHAMP visit and the participant’s last follow-up visit prior to December 2017; continuous (Aim 3)
2. Number of follow-up visits were measured as the number of follow-up visits after the initial CHAMP visit; continuous (Aim 3)
3. Follow-up visit category represented the variable visits defined as categorical on 3 levels, with “1” indicating attendance at only 1 follow-up visit, “2” at exactly 2 follow-up visits, and “3” at 3 or more follow-up visits; categorical (Aim 3)
a. TUG improvement was calculated first as the change in TUG score from initial visit to 2nd follow-up visit and then dichotomized with 1 indicating any
improvement from IVT to the 2nd follow-up visit (F2) and 0 indicating no change or a worse score at F2 compared to IVT. (Aim 2)
5. Chair Rise Test (CRT) was calculated by the number of stands completed in the number of seconds allowed to complete the test for either the 30-second Sit-to-Stand test or the 5 Times Sit-to-Stand test at any individual CHAMP visit; continuous (Aims 1-3)
a. CRT improvement was calculated first as the change in CRT score from initial visit to 2nd follow-up visit and then dichotomized with 1 indicating any
improvement from IVT to F2 and 0 indicating no change or a worse score at F2 compared to IVT. (Aim 2)
6. Four-Stage Balance Test (4SBT) was the score of the 4SBT in seconds from 0-40 for any individual CHAMP visit; continuous (Aims 1-3)
a. 4SBT improvement was calculated first as the change in 4SBT score from initial visit to 2nd follow-up visit and then dichotomized with 1 indicating any
improvement from IVT to F2 and 0 indicating no change or a worse score at F2 compared to IVT. (Aim 2)
CHAPTER 1: INTRODUCTION 1.1 Background
Falls are the leading cause of fatal and non-fatal injuries among adults 65 years of age and older in the United States (US).1 In 2014, 28.7% of non-institutionalized older adults in the US reported falling at least once in the previous year, totaling around 29 million falls. Of these falls, approximately 7.0 million resulted in injury requiring medical treatment or restricted activity for at least 1 day.2 With the aging of the baby boomer generation, the number of people in the US over age 65 is expected to reach 74 million by 2030. These older adults will have an estimated 49 million falls per year.3,4
The financial cost of falls will also increase over time. In 2015, direct medical costs for fatal and non-fatal falls were $637.5 million and $31.3 billion, respectively.5 Total estimated costs for fatal and non-fatal falls were approximately $50 billion.6 Greatest medical expenditures occur for fall-related injuries that require inpatient treatment in hospitals and skilled nursing facilities, though costs are also high for fall-related visits to emergency departments and outpatient clinics.7
Prolific research has demonstrated that falls among older adults can be significantly reduced by exercise interventions that incorporate balance retraining and lower limb
strengthening exercises.13,14 The Otago Exercise Program (OEP) is an example of an exercise intervention with abundant evidence supporting its efficacy in reducing falls, particularly among people over the age of 80 years and with increased frailty.15
1.2 Statement of the Problem
Despite the well-known efficacy of OEP and other exercise programs, implementation of these programs is inadequate to address the growing problem of falls in the US.16,17 The
availability of evidence-based falls prevention programs for older adults is scarce, particularly in rural, medically underserved areas where there may be limited availability of instructors, space, equipment, funding, transportation, and healthcare providers.18–20 As a result, a critical issue contributing to the problem of falls is the limited delivery of falls prevention programs to older adults.
implementing evidence-based interventions. Li et al19 proposed that effectiveness research of community falls prevention programs is the necessary next step in translating falls prevention interventions into practice.
The Community Health and Mobility Partnership (CHAMP) is a fall prevention program that modifies certain components of the OEP so that it can be delivered in a community setting to individuals who have limited access to financial, educational, and healthcare resources.26
CHAMP is a readily available, low-cost, time-efficient falls-prevention program that may be a solution to the challenge of providing falls prevention interventions to older adults in the community.
1.3 Purpose
1.4 Aims
We tested our central hypothesis with the following aims:
Aim 1A: Determine whether older adults who received an alternative, community-based implementation of the OEP intervention for an initial and two follow-up visits within six months demonstrated improvements in four key outcome measures (4SBT, TUG, CRT, and ABC) from initial visit to the 2nd follow-up visit.
Hypothesis: CHAMP participants would demonstrate improvements on key outcome measures from baseline to 2nd follow-up. Rationale for this hypothesis was based on research
demonstrating improvements on physical performance measures after 8 weeks of participation in the US OEP.27
Aim 1B: Determine whether older adults who received the OEP intervention with 2 follow-up visits to CHAMP within 3 months of the initial visit demonstrated greater
improvements in four key outcome measures (4SBT, TUG, CRT, and ABC) compared to individuals who completed a 2nd follow-up visit 3-6 months after the initial visit.
Aim 2: Identify characteristics of CHAMP participants that predicted improvement on physical performance measures associated with falls risk, including Four Stage Balance Test (4SBT),28 Timed Up and Go test (TUG),29 and Chair Rise Test (CRT).30
Hypothesis: Characteristics of CHAMP participants predicting improvement would be those associated with increased frailty including increased age, female gender, increased number of chronic health conditions, greater number of falls and injurious falls in the previous year, activity limitation because of fear of falling, use of assistive device, decreased balance confidence, and cognitive impairment.15,31,32 Rationale for this hypothesis was based on literature demonstrating that traditional OEP is most effective for older adults over 80 years of age with a previous history of falls, higher falls incidence, and increased frailty.15,31
Exploratory Aim 3: Examine the pattern of changes in key outcome measures over
duration of participation (months) and multiple visits for all individuals with one or more follow-up visits to CHAMP.
Hypothesis: Patterns of change in key outcome measures would be affected by number of months of participation and number of visits, controlling for covariates identified in Aim 2. Support for this hypothesis came from literature indicating that performance on functional outcome measures is: 1) negatively associated with aging33,34 but 2) positively associated with participation in OEP.27
1.5 Significance
significantly expanded upon that research by providing OEP to older adults living in a rural area far from large research centers and/or medical schools where traditional OEP was first
provided.35 Investigating and understanding the effectiveness of research-supported interventions in real-world settings can lead to expanding effective falls prevention interventions to a greater number of sites where they may be used to reduce falls risk, promote wellness, and prolong independence of older adults in rural and underserved areas.
1.6 Operational Definitions 1. Older adult: Adult aged 60 years old or older
2. Fall: unintentionally coming to rest on the ground, floor, or other lower level36,37 3. Key outcome measures: 4-Stage Balance Test (4SBT), Timed Up and Go test (TUG),
Chair Rise Test (CRT), and Activities-Specific Balance Confidence scale (ABC) (Aim 1 only).
4. F1 visit: Follow-Up Visit 1, the first follow-up after the initial baseline visit (a participant’s 2nd overall visit).
5. F2 visit: Follow-Up Visit 2, the second follow-up after the initial baseline visit (a participant’s 3rd overall visit).
6. OEP: Otago Exercise Program, an evidence-based exercise intervention to reduce falls in older adults.
7. CHAMP: Community Health and Mobility Partnership, a community-based
CHAPTER 2: MANUSCRIPT 1 - EFFECTIVENESS OF A NOVEL IMPLEMENTATION OF THE OTAGO EXERCISE PROGRAM IN RURAL
APPALACHIA 2.1 Introduction
Falls are a well-known threat to the health and independence of community-dwelling older adults.2 Numerous randomized controlled trials have been conducted to investigate
interventions for combatting the growing problem of falls.38 Although targeting risk factors such as psychotropic medication use, uncontrolled chronic health conditions, inappropriate footwear, or home safety hazards can be helpful in reducing falls,38 research supports the key role of exercise in fall prevention efforts. The overwhelming conclusion from the literature is that falls can be reduced with specific interventions that include balance-challenging exercises at a dose of at least 3 hours per week.13,14
Given the evidence to support specific exercise interventions to reduce falls among older adults, public health authorities including the Centers for Disease Control and Prevention (CDC), American Geriatrics Society (AGS), and United States Preventive Services Task Force
(USPSTF) have recommended that clinicians and wellness centers promote and provide evidence-based fall prevention interventions for older adults.39–41 The Otago Exercise Program (OEP) is an example of an evidence-based fall prevention intervention recommended for use by the CDC.42,43
therapist or nurse who provides an individualized home exercise program to older adult
participants in their homes. An OEP-trained provider administers assessments to an older adult participant and uses assessment results to select appropriate exercises from the OEP exercise set. The entire OEP exercise set consists of 5 active range of motion “warm-up” exercises, 5 lower extremity strengthening exercises in sitting and standing, and 12 balance exercises of
progressively increasing difficulty.27,48 Participants receive handouts for each exercise and are instructed to perform exercises 3 days per week. At the provider’s discretion, a walking program consisting of walking for a total of 30 minutes is added to the participant’s home program.48 The home exercise program is progressed following re-assessment at subsequent visits, which occur at the 2-, 4-, and 8-week and 6- and 12-month time points. In addition, providers call participants by phone monthly from 3 to 5 months and from 7 to 11 months to promote adherence to the home exercise program.
Results from two meta-analyses of eight trials demonstrated that participation in the New Zealand OEP significantly reduced fall rates, fall-related injuries, and risk of death over 12 months while improving performance on objective measures of balance and functional lower extremity strength among older adults at risk for falls.15,35,36,43–46,49–51 This research found that greatest fall prevention benefits occurred among women over the age of 80 years who reported one or more falls in the previous year.15
referral to OEP from older adults’ primary care providers,52,54 and insufficient accessibility of healthcare resources for older adults who live in rural areas.18,19,55
Shubert et al22 demonstrated successful reach, adoption, and effectiveness of alternative methods of implementing OEP that addressed specific barriers. The US OEP model described by Shubert et al21 offers solutions to implementation challenges by offering the OEP in either the participant’s home or in an outpatient physical therapy clinic, providing follow-up visits by either a physical therapist or a physical therapist assistant, utilizing support personnel to make follow-up phone calls or removing the phone calls altogether, and shortening the intervention to 8 weeks or 6 months instead of offering a 12-month follow-up visit.
Despite these successes, challenges of implementing the OEP and other evidence-based fall prevention programs persist in rural, medically underserved areas. The Community Health and Mobility Partnership (CHAMP) addresses these barriers in a unique, community-based fall prevention program provided at no cost to participants. Utilizing collaborations among academic institutions, local clinicians, and community service organizations to secure space and volunteer providers, CHAMP provides multifactorial falls risk assessment and intervention at easily-accessible sites. The collaborative approach of CHAMP, which includes an educational
understanding and enhancing the effectiveness of CHAMP’s translation of OEP to older adults living in underserved areas is to assess changes in falls-related measures among participants in the program.
The primary objective of this study was to determine the effects of CHAMP on measures of physical performance and balance confidence among older adult participants. Based on research demonstrating improvements on measures of physical performance after 8 weeks of participation in the US OEP,27 we hypothesized that CHAMP participants would demonstrate improvements on key outcome measures from baseline to 2nd follow-up. Given that both the New Zealand and US OEP models recommend that the majority of follow-up occurs in the first 8 weeks after a participant’s initial assessment, we further hypothesized that completing the two recommended follow-up visits closer to this timeline would be associated with greater
improvements. Specifically, our aims for this study were to: 1) determine whether participants who received the CHAMP intervention for an initial and two follow-up visits within a 6-month period demonstrated improvements in physical performance and balance self-confidence; and 2) determine whether participants who completed two follow-up visits within 3 months of the initial visit demonstrated greater improvements in physical performance and balance self-confidence compared to individuals who completed a 2nd follow-up visit 3-6 months after the initial visit.
2.2 Methods
Participants
CHAMP participants from 2009-2017 were community-dwelling older adults from two rural counties in western North Carolina (NC). In 2017, the total populations of these two
counties were 83,029 and 43,069 people, and the population aged 60 years and older was 20,816 for the larger county and 11,491 for the smaller.56 Among the population aged 60 years and older in each county, approximately 55% were women, and the vast majority (93.4% and 95.8%) were white, non-Hispanic.56
Participants included in this analysis were CHAMP participants aged 60 years and older who completed an initial visit to CHAMP, were recommended to return for follow-up to address falls risk factors and who returned for two follow-up visits (F2) within 6 months (Figure 1). Groups were formed retrospectively to distinguish participants whose second follow-up visit occurred within 3 months of the initial visit (Group 1) from those whose second follow-up visit occurred 3-6 months after their initial visit (Group 2).
CHAMP Personnel
CHAMP events were staffed by trained, volunteer clinicians and clinical students from multiple disciplines, including physical therapy, speech and language pathology, nursing, and others. As described by Mercer et al,26 CHAMP incorporated an educational component,
events supervised the administration of physical performance tests, prescribed OEP exercises for home performance, and provided other fall prevention recommendations.57
CHAMP Procedures
All assessments were administered using standardized procedures and instructions. Times were recorded to the nearest tenth of a second with use of a stopwatch. Test results were
documented on paper forms and later transferred to an electronic spreadsheet.
At their first visit to CHAMP, participants provided demographic and health history information on pen and paper forms with assistance from CHAMP providers (Participant Information Form, Appendix C). Personal characteristics collected included age, gender, race, ethnicity, and level of education. Health information collected included self-reported history of falls in the past year; height; presence or absence of cardiovascular disease, hypertension, arthritis, diabetes, cancer, osteoporosis, and stroke; and use and type of assistive device. Body weight was measured using a standard scale, and cognitive impairment was assessed with the Mini-Mental State Examination (MMSE).58 Questionnaires and performance tests were scored by CHAMP providers, and scores were recorded on the participant’s paper form (Appendix A) at the time of their visit. These data collected on pen-and-paper forms were later transferred to a secured, electronic database that identified CHAMP participants by their unique CHAMP ID number only.
Outcome Measures
confidence, the ABC is scored on a scale of 0-100, with higher scores indicating greater balance confidence.59–62 Among older adults with chronic obstructive pulmonary disease, the minimal clinically important difference (MCID) for the ABC was found to be 14.2-18.5.63
Physical performance measures, administered after the ABC, included the Four-Stage Balance Test (4SBT),28 Timed Up and Go test (TUG),29 and the chair rise test (CRT).30 The 3 physical performance measures were selected based on their inclusion in the New Zealand and US implementations of the OEP and their association with incidence of falls among older adults.21,27,48 The 4SBT, a test of static balance when standing with a progressively smaller base of support, was performed following procedures recommended by the New Zealand and US OEP. Participants were asked to attain and then independently hold for 10 seconds each of the following foot positions: feet together, semi-tandem, tandem, and single limb stance (SLS). CHAMP participants who were unable to maintain one stage of the test for the total 10-second time period were allowed to attempt the next stage unless such an attempt was considered unsafe by a supervising physical therapist. The 4SBT used in CHAMP was then scored as the sum of time in seconds that a participant maintained each stage of the test, with a maximum score of 10 seconds for each stage and a maximum score of 40 for the total test score. Based on previous research, participants unable to maintain the SLS position for at least 5 seconds were considered to have increased risk for falls.64 Psychometric properties of the 4SBT as a whole and utilizing these same scoring methods have not been published, but research indicates that a similar test, the Short Physical Performance Battery, is a valid, reliable, and responsive measure of physical performance among community-dwelling older adults.65–67
meters, turn and walk back to the chair, and return to sitting in the chair.29 At CHAMP, participants performed the TUG 3 times (1 practice and 2 test trials), and results of the 2 test trials were averaged. Performance on the TUG is strongly associated with falls, and various cut-off scores have been suggested to maximize the test’s sensitivity and specificity for falls.34,68–70 From 2009-2015, CHAMP providers utilized a TUG cut-off score of 13.5 seconds to identify individuals at increased risk for falls.71 In 2016, CHAMP procedures were updated based on CDC recommendations, and a 12- second score on the TUG became the new cut-off for identifying increased risk for falls.41,70,72–75 Lin et al34 showed that the TUG had excellent intrarater and interrater reliability among community-dwelling older adults, and Wright et al76 reported an MCID of 0.8-1.4 seconds on the TUG for older adults with hip osteoarthritis.
The CRT is a measure of functional lower extremity strength in which a participant is asked to stand up and sit down from a standard-height chair without using his or her upper extremities for support or assistance. CHAMP methods have used two versions of this test. From 2009-2014, the CRT version used at CHAMP was the 5 Times Sit-to-Stand (5xSTS) as
CHAMP Intervention
Initial visits to CHAMP lasted approximately 1-hour and began with administration of the assessments described above. CHAMP providers evaluated assessment results to identify each participant’s risk factors for falls and subsequently provided participants with their results and recommendations. Participants were considered to have an increased risk for falls if they had 1 or more of the following characteristics: ≥ 1 fall in the previous 12 months, activity limitations because of fear of falling, SLS time < 5 seconds, or TUG score indicating increased risk for falls (≥ 13.5 seconds from 2009-2015 and ≥ 12 seconds since 2016).
Participants identified as having health issues that could not be addressed by CHAMP, such as vestibular disorders or uncontrolled hypertension, were referred to other providers or programs. CHAMP participants considered to be at low risk for falls were encouraged to maintain healthy behaviors and to return to CHAMP if concerns about balance arose.
at home on their own 3 days per week for strengthening exercises and daily for balance exercises.
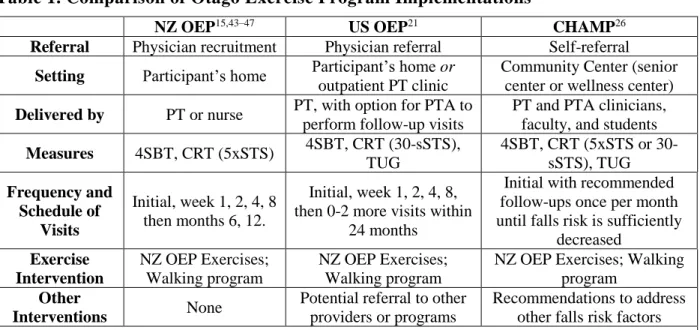
CHAMP participants with increased risk for falls who received OEP exercises were advised to return for monthly follow-up visits from March-November. At follow-up visits, physical performance measures and the ABC were reassessed, and the falls risk algorithm was re-applied. Similar to the initial visit, participants who remained in the “increased risk for falls” category received individualized falls prevention recommendations. Participants’ OEP home exercises were reviewed and progressed or updated by a PT. Participants were advised to continue to return to CHAMP each month until their performance on falls-risk measures had improved sufficiently to indicate low risk for falls. As shown in Table 1, the OEP provided by CHAMP differed from the NZ and US OEP in that clinician involvement occurred only in the community setting (not in the individual’s home or as part of a clinic visit) and follow-up visits with a clinician occurred only once per month and on an ongoing basis.
Statistical Analysis
G*Power80 was used to calculate sample size needed to detect a medium effect (.6) of the CHAMP intervention on TUG results with 80% power at significance level 0.05 in a two-tailed, between-group comparison. A sample size of 96 participants consisting of groups of 37 and 59 participants was determined to be sufficient. The TUG was the measure used for this calculation because the TUG score was the most sensitive measure used in terms of variability, as it was measured as a continuous variable with values to the 10th of a second with no
subsequent data reduction.
baseline were calculated for continuous variables using independents samples t-tests and for categorical variables using chi-square or Fisher’s exact test for cell sizes less than 5. Within group change was first assessed using repeated measures t-tests for each key outcome measure at initial and F2 visits for the total sample (n=130) as well as for each of the 2 groups formed from this sample. Then, repeated measures two-way analyses of variance (ANOVAs) with repeated measures were used to test for main and interaction effects of group and visit for each of the 4 key outcome measures. As per our research aim, we were interested in the distinct contributions of each of these four outcome measures; thus, we were less concerned about creating
combination of these four measures. Therefore, we chose to use ANOVA, as multivariate analyses would not be informative in this regard.
These relationships were also examined using ANCOVAs with covariates of age and number of falls reported at initial visit. Effect sizes were calculated using Cohen’s d, and common conventions were used to classify values.81 Clinical meaning of results was calculated using frequencies of change in performance on outcome measures exceeding the test’s MCID as well as frequencies of change in performance from one risk category to another. Missing values were excluded case wise, and frequencies and percentages were reported for non-missing data only. Data were analyzed using IBM SPSS Statistics for Windows, Version 25.0 (IBM Corp., Armonk, NY) with significance level of 0.05 for all analyses.
2.3 Results
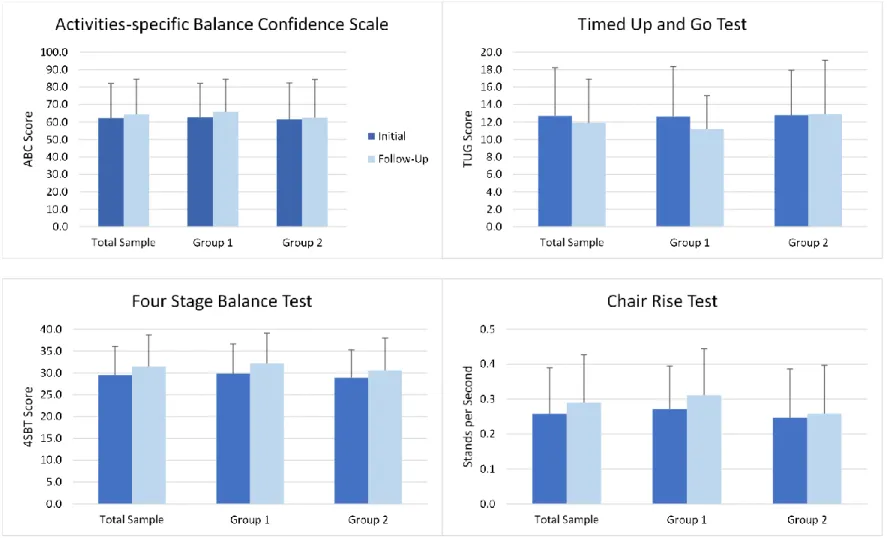
differences between groups for any demographic or health characteristics or for initial visit performance on key outcome measures (Figure 2).
Figure 2 shows performance on outcome measures at initial and F2 visits for the entire sample and each group. Results of paired sample t-tests and associated effect size from the initial visit to F2 for the total sample and each group are listed in Table 3. The total sample
demonstrated statistically significant improvement from the initial visit to F2 in all three physical performance measures: (mean 4SBT: IVT 29.5s, F2 31.5s, p=.001), (mean TUG: IVT 12.7s, F2 11.9s, p=.021), (mean CRT: IVT .258 stands/s, F2 .290 stands/s, p=.002). Change in balance confidence was not significant (mean ABC: IVT 62.2, F2 64.4, p=.154).
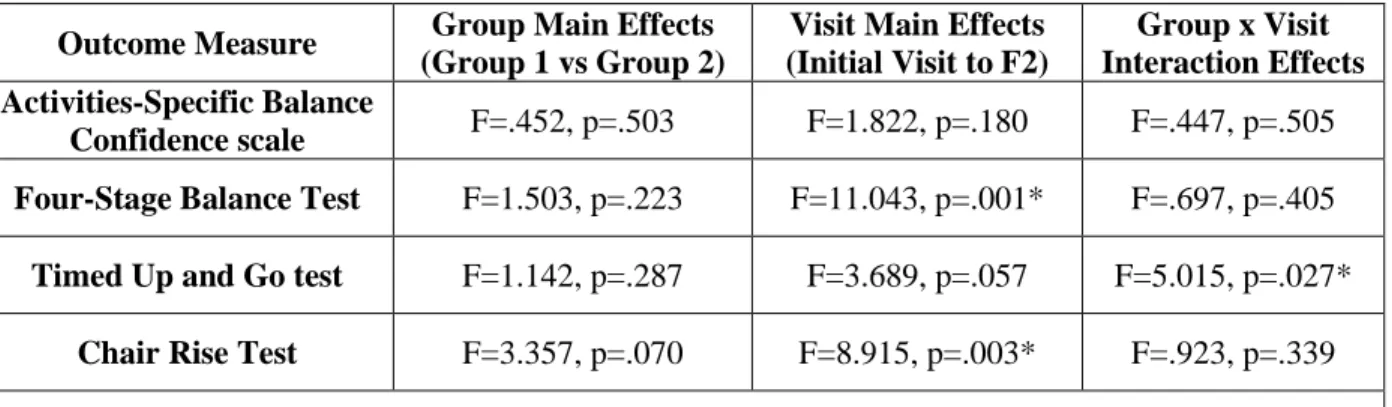
As shown in Table 4, the two-way ANOVA results for scores on the ABC indicated no statistically significant effects of group, visit, or their interaction for balance confidence. Significant main effects of visit were present for both 4SBT, F(1, 125) = 11.04, p = .001 and CRT, F(1, 112) = 8.92, p = .003. No significant main effects of group or group by visit
interaction effects were present for the 4SBT or the CRT. However, a significant interaction was observed for the TUG, F(1, 126) = 5.02, p = .027. While TUG scores for Group 1 participants improved from 12.6 ± 5.7 seconds at the initial visit to 11.2 ± 3.8 seconds at F2, scores for Group 2 remained essentially unchanged (12.8 ± 5.1 seconds at initial visit, 12.9 ± 6.2 seconds at F2). Repeated-measures ANCOVAs, with age and number of falls reported at initial visit as
covariates, produced the same findings as ANOVAs with respect to significance of main and interaction effects for all 4 outcomes.
Initially, 93 (72.1%) of the 129 participants with initial visit 4SBT scores were at
decrease in their risk for falls. Nine of the 36 participants with initial SLS score greater than 5 seconds had a decline in SLS performance at F2 placing them in the increased risk category based on F2 SLS score less than 5 seconds.
In the total sample of 128 participants with both IVT and F2 TUG scores, 58 (45.3%) demonstrated improvement in TUG that exceeded the MCID of 0.8 seconds.76 Twenty-eight participants (21.9%) had a decline in TUG performance from IVT to F2 that exceeded the MCID. At the initial visit, 52 participants performed the TUG in greater than 12 seconds, a cut-off score used to identify individuals at increased risk for falls. Of these 52 participants, 14 (26.9%) improved TUG performance to less than 12 seconds, indicating that these individuals were no longer at increased risk. Comparatively, of the 78 participants whose initial TUG score was less than 12 seconds, 6 (7.7%) had a TUG score greater than 12 seconds at F2.
For the CRT, 58 participants completed the 5xSTS at the initial and F2 visits. Twenty-four (41.4%) improved by more than the 2.3-second MCID.77 Five individuals (8.6%) worsened by at least 2.3 seconds, and 29 (50.0%) did not change by as much as 2.3 seconds. Of the 43 participants who completed the 30-second Sit-to-Stand test at the initial and F2 visits, 7 (16.3%) demonstrated improved performance at F2 based on improvement greater than the 2.6 stands MCID.76 Thirty-one (72.1%) individuals did not change by as much as the MCID in either direction, and 5 (11.6%) demonstrated a decrease in score from initial visit to F2 that exceeded the MCID.
2.4 Discussion
visits within 3 versus 6 months of their initial visit. Participants demonstrated statistically and clinically significant improvements on physical performance measures (4SBT, TUG, CRT) from initial visit to F2. Improvement in balance confidence measured by the ABC was not significant. These results are to be expected for an intervention that targets physical performance but not balance confidence. OEP exercises prescribed to participants as part of the CHAMP intervention were intended to improve participants’ strength and balance, and the success of these exercises was reflected in the significant improvement in the 4SBT, TUG, and CRT.
In addition to the fact that CHAMP interventions did not specifically target balance confidence, the lack of improvement in this construct as measured by the ABC may have
reflected participants’ heightened awareness of their risk of falls. CHAMP provided participants with information about their balance that could have lowered confidence levels for some
participants. Participants who had increased risk for falls were informed about this result and received an intervention to reduce their falls risk. Receiving this finding at the initial visit could have decreased participants’ balance confidence, and this reduced confidence may have been captured by the ABC completed at F2. In fact, the ABC test was always administered
immediately upon a participant’s arrival to CHAMP. This timing of the ABC prior to physical performance tests meant that participants did not have knowledge of any improvements that may have occurred in their physical performance until after completing the ABC.
Not only was improvement on the 3 physical performance measures statistically
significant, effect sizes were comparable to those found by Shubert et al27 in a study with a much larger sample size. This finding supports that similar outcomes can be expected with CHAMP participation compared to participation in other OEP interventions. Furthermore, many
Nearly half (45.3%) of the total participants in this study had an improvement on the TUG that exceeded the MCID. More than a quarter (26.9%) of participants initially with increased risk for falls based on TUG score had improvement in TUG sufficient to change to the “not at increased risk” category for this measure. This clinically significant improvement for TUG occurred within a 6-month period and with a total of only 3 CHAMP visits. An important next step is to identify characteristics of those CHAMP participants who made this change in risk category so that we can determine which subgroup(s) to target for this community-based falls prevention program.
Functional lower extremity strength and power are expected to decrease with aging. However, the majority of CHAMP participants included in these analyses improved or
maintained their functional lower extremity strength from initial to F2 visits. Among CHAMP participants whose functional lower extremity strength was measured at the initial and F2 visits using the 5xSTS, 41.4% had improvement that exceeded the MCID of 2.3s, 50.0% maintained their baseline performance, and only 8.6% demonstrated a clinically significant decline in performance. Among participants whose functional lower extremity strength was measured by the 30-s STS test, 16.3% had clinically significant improvement, 72.1% maintained their initial strength, and 11.6% had lower scores at F2. The greater percentage of individuals showing clinically significant improvement in the 5xSTS compared to the 30-s STS is likely a result of the difference in methods between the two tests and their similarities to the chair stand exercise from the OEP. The chair stand exercise is commonly prescribed for home exercise in the
Standing within a narrow base of support is often challenging for older adults, and performance of SLS is expected to decline with age.33 CHAMP participants had statistically significant improvement in the 4SBT. It is likely that participants were able to improve their performance of static balance within a narrow base of support because of the use of OEP
exercises in the CHAMP intervention. CHAMP participants were frequently prescribed the SLS and tandem stance OEP exercises, which likely provided the opportunity to practice these challenging stance positions that participants might otherwise have avoided.
We expected the timing of CHAMP participants’ return for F2 to significantly influence change in all 4 key outcome measures. Contrary to our hypothesis, improvement in only one measure, the TUG, had a statistically significant group by visit interaction, with groups formed based on F2 within 3 months as compared to 3-6 months after initial visit. A possible reason for the significant effect of the time to return for F2 on TUG could be simply that individuals who returned sooner for F2 were “getting up and going” to CHAMP visits at a greater frequency and therefore getting more practice in a shorter period of time. Additionally, the TUG, compared to 4SBT or CRT, measures an individual’s performance not only in an activity that could be prescribed for home exercise from the OEP but in a more complex combination of actions requiring functional lower extremity strength and dynamic balance. Improvement in this more comprehensive measure may require more frequent follow-up with less time between visits than is necessary for improvement in static standing balance or repeated chair rises.
Limitations
clinical and self-report measures. Participants were self-selected from two rural communities that have minimal diversity of race, ethnicity, and education, particularly among adults over the age of 60.56 The lack of diversity in the sample for this study limits generalizability to other
populations. Furthermore, this analysis could be performed only for individuals who were identified as having increased risk for falls at an initial visit and then returned for 2 additional follow-up visits, adding an additional layer to self-selection bias inherent in community-based interventions. Insights into why participants did or did not return as well as the degree to which returning participants adhered to program recommendations would be helpful for future projects to assess the CHAMP program.
Though several of these limitations are unavoidable for community-based research, future studies could include outreach to individuals who did not return to CHAMP, evaluating effectiveness of CHAMP offered in different areas with different populations, and including a measurement of actual falls in addition to measures of falls risk. In fact, the finding of
statistically and clinically significant improvement in 3 physical performance measures despite these limitations supports the need for additional research to understand the effects of CHAMP participation on falls and falls-related measures among older adults at risk for falls.
2.5 Conclusions
Individuals who participated in an interprofessional, community-based implementation of OEP had significant improvement in physical measures related to falls from an initial visit to a second follow-up visit within 6 months. Describing characteristics of individuals most likely to benefit from CHAMP will be important in maximizing the benefits of this approach to
Table 1. Comparison of Otago Exercise Program Implementations
NZ OEP15,43–47 US OEP21 CHAMP26
Referral Physician recruitment Physician referral Self-referral
Setting Participant’s home Participant’s home or
outpatient PT clinic
Community Center (senior center or wellness center)
Delivered by PT or nurse PT, with option for PTA to perform follow-up visits
PT and PTA clinicians, faculty, and students
Measures 4SBT, CRT (5xSTS) 4SBT, CRT (30-sSTS),
TUG
4SBT, CRT (5xSTS or 30-sSTS), TUG
Frequency and Schedule of
Visits
Initial, week 1, 2, 4, 8 then months 6, 12.
Initial, week 1, 2, 4, 8, then 0-2 more visits within
24 months
Initial with recommended follow-ups once per month until falls risk is sufficiently
decreased
Exercise Intervention
NZ OEP Exercises; Walking program
NZ OEP Exercises; Walking program
NZ OEP Exercises; Walking program
Other
Interventions None
Potential referral to other providers or programs
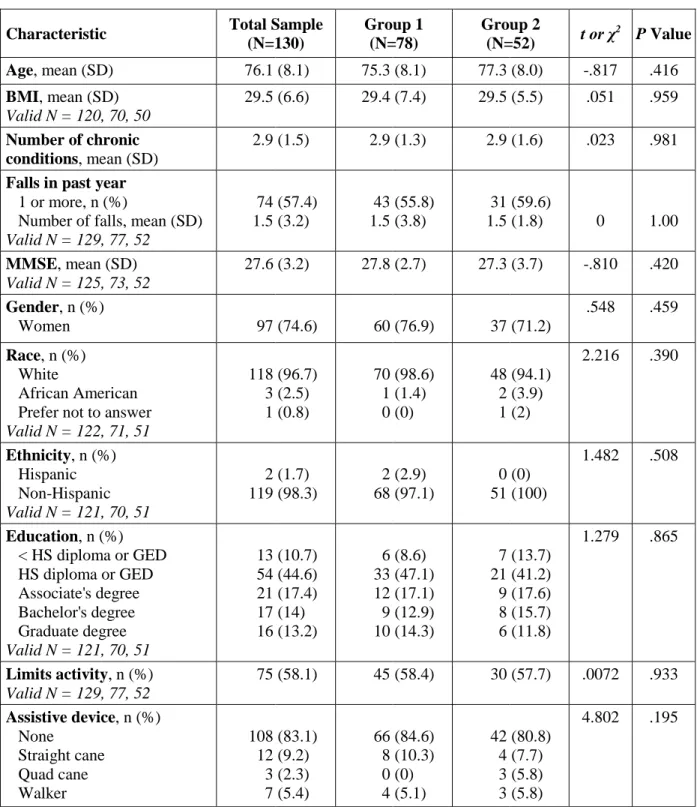
Table 2. Baseline Characteristics of Participants
Characteristic Total Sample
(N=130)
Group 1 (N=78)
Group 2
(N=52) t or χ
2
P Value
Age, mean (SD) 76.1 (8.1) 75.3 (8.1) 77.3 (8.0) -.817 .416
BMI, mean (SD) Valid N = 120, 70, 50
29.5 (6.6) 29.4 (7.4) 29.5 (5.5) .051 .959
Number of chronic conditions, mean (SD)
2.9 (1.5) 2.9 (1.3) 2.9 (1.6) .023 .981
Falls in past year
1 or more, n (%)
Number of falls, mean (SD) Valid N = 129, 77, 52
74 1.5 (57.4) (3.2) 43 1.5 (55.8) (3.8) 31 1.5 (59.6)
(1.8) 0 1.00
MMSE, mean (SD) Valid N = 125, 73, 52
27.6 (3.2) 27.8 (2.7) 27.3 (3.7) -.810 .420
Gender, n (%)
Women 97 (74.6) 60 (76.9) 37 (71.2)
.548 .459
Race, n (%) White
African American Prefer not to answer Valid N = 122, 71, 51
118 3 1 (96.7) (2.5) (0.8) 70 1 0 (98.6) (1.4) (0) 48 2 1 (94.1) (3.9) (2)
2.216 .390
Ethnicity, n (%) Hispanic Non-Hispanic Valid N = 121, 70, 51
2 119 (1.7) (98.3) 2 68 (2.9) (97.1) 0 51 (0) (100)
1.482 .508
Education, n (%) < HS diploma or GED HS diploma or GED Associate's degree Bachelor's degree Graduate degree Valid N = 121, 70, 51
13 54 21 17 16 (10.7) (44.6) (17.4) (14) (13.2) 6 33 12 9 10 (8.6) (47.1) (17.1) (12.9) (14.3) 7 21 9 8 6 (13.7) (41.2) (17.6) (15.7) (11.8)
1.279 .865
Limits activity, n (%) Valid N = 129, 77, 52
75 (58.1) 45 (58.4) 30 (57.7) .0072 .933
Assistive device, n (%) None Straight cane Quad cane Walker 108 12 3 7 (83.1) (9.2) (2.3) (5.4) 66 8 0 4 (84.6) (10.3) (0) (5.1) 42 4 3 3 (80.8) (7.7) (5.8) (5.8)
4.802 .195
Table 3. Mean Scores on 4 Key Outcome Measures at Initial and 2nd Follow-up Visits
Measure Group IVT Score
Mean±SD
F2 Score
Mean±SD n t p-value Cohen's d
ABC Total Sample Group 1 Group 2 62.2±19.9 62.7±19.3 61.5±20.8 64.4±20.1 65.9±18.6 62.5±21.8 117 65 52 -1.436 -1.471 -0.475 0.154 0.146 0.637 0.11 0.17 0.047 4SBT Total Sample Group 1 Group 2 29.5±6.6 29.8±6.8 28.9±6.4 31.5±7.2 32.2±6.9 30.6±7.4 127 75 52 -3.537 -3.737 -1.391 0.001 <.001 0.17 0.291 0.353 0.248 TUG Total Sample Group 1 Group 2 12.7±5.5 12.6±5.7 12.8±5.1 11.9±5.0 11.2±3.8 12.9±6.2 128 76 52 2.346 3.278 -0.206 0.021 0.002 0.838 0.153 .291 0.018 CRT Total Sample Group 1 Group 2 0.258±0.132 0.271±0.123 0.238±0.143 0.290±0.137 0.311±0.134 0.258±0.138 114 68 46 -3.233 -3.204 -1.256 0.002 0.002 .216 0.239 0.313 0.144
Table 4. Main and Interaction Effects of Group and Visit on 4 Key Outcome Measures
Outcome Measure Group Main Effects
(Group 1 vs Group 2)
Visit Main Effects (Initial Visit to F2)
Group x Visit Interaction Effects Activities-Specific Balance
Confidence scale F=.452, p=.503 F=1.822, p=.180 F=.447, p=.505
Four-Stage Balance Test F=1.503, p=.223 F=11.043, p=.001* F=.697, p=.405
Timed Up and Go test F=1.142, p=.287 F=3.689, p=.057 F=5.015, p=.027*
Chair Rise Test F=3.357, p=.070 F=8.915, p=.003* F=.923, p=.339
Figure 1. Screening, Risk Determination, and Follow-up Visits for CHAMP Participants
Figure 2. Performance on Key Outcome Measures at Initial and 2nd Follow -up Visits for Total Sample and Each Group
CHAPTER 3: MANUSCRIPT 2 - CHARACTERISTICS ASSOCIATED WITH IMPROVED PHYSICAL PERFORMANCE AMONG COMMUNITY-DWELLING OLDER ADULTS IN A COMMUNITY-BASED FALLS PREVENTION PROGRAM
3.1 Introduction
Despite the benefit, cost effectiveness, and support for OEP, adoption of the program by clinicians in the US has been limited.22 As a result, alternative implementation strategies have been developed to increase OEP availability for older adults meeting certain characteristics and in specific geographic locations.24,26,90 The Community Health and Mobility Partnership
(CHAMP) was designed to offer OEP to communities with limited resources and/or underserved demographics, particularly those in rural areas without access to preventive care initiatives.18,91 CHAMP is a creative, collaborative partnership, made up of academics, clinicians, health professions students and community members who coordinate and deliver OEP in a central community location once per month from March-November. CHAMP provides individuals living in rural areas the opportunity to self-identify a concern about falls, receive assessment and intervention, and subsequently return for follow-up without undue access burden.
performance measures associated with falls risk, including Four Stage Balance Test (4SBT),28 Timed Up and Go test (TUG),29 and Chair Rise Test (CRT).30
Results from OEP delivered in New Zealand demonstrated that while all participants demonstrated improved strength and balance and a decreased number of falls, a subgroup of individuals aged at least 80 years old and with at least one fall in the previous year received the greatest benefit from participation based on estimated falls prevented.15 Researchers concluded that the subgroup of older, frailer participants may benefit most from balance and strength gains provided by OEP to reduce falls risk, whereas younger individuals with better balance and strength at baseline have smaller gains.15 Similar results and conclusions were found in implementations of OEP in the US.22 Based on these findings, we hypothesized that
characteristics of CHAMP participants predicting improvement would be those associated with increased frailty including increased age, female gender, increased number of chronic health conditions, greater number of falls and injurious falls in the previous year, activity limitation because of fear of falling, use of an assistive device, decreased balance confidence, and cognitive impairment.15,31,32
3.2 Methods Study Design and Participants
CHAMP
CHAMP participants were members of the community and surrounding areas who expressed interest in receiving free assessment of and intervention to reduce falls risk. At the participant’s first visit, volunteer providers administered a multifactorial falls risk assessment that included tests used in OEP.27,43,48 Based on test performance and other criteria described below, participants were determined to have either increased or low risk for falls. Those identified as having increased risk for falls were provided with a falls prevention intervention that included the OEP as well as other evidence-based recommendations to prevent falls.
Participants were then advised to return for repeated monthly visits from March-November each year until their performance on falls-risk measures improved sufficiently to indicate low risk for falls. At follow-up visits, falls-risk measures were re-assessed, OEP exercises were reviewed and progressed, and additional falls-risk factors were addressed as needed. For this study, we
examined changes in performance on these measures from IVT to second follow-up visit (F2) to ensure participants had sufficient time to practice OEP home exercises provided by CHAMP. Variables
Baseline Participant Characteristics
Demographic and health history information was collected at participants’ initial CHAMP visits. Participant information pertinent to this analysis included: age, gender, race, education level, number and type of common chronic conditions, use of assistive device for walking, number of falls and injurious falls in previous year, and a yes or no response to the question, “Do you limit your activities because you are afraid you might fall?” Balance
balance during selected activities on an 11-point scale from 0 to 100.59 Items were averaged to determine overall percent confidence with higher scores indicating greater balance confidence.59 Cognition was measured by the Mini-Mental State Examination (MMSE), a brief assessment of orientation to time and place, registration and recall of 3 words, attention and calculation, language, and visual construction.58 The MMSE was scored on a scale from 0-30 with a lower score reflecting greater cognitive impairment.58,95 Body mass index (BMI) was calculated using participant’s measured body weight and reported height.
Outcome Measures
Three physical performance measures, 4SBT,28 TUG,29 and CRT,30 were assessed at each CHAMP visit to quantify an individual’s falls risk related to physical performance.48 The 4SBT is a measure of static standing balance in each of four stance positions (feet together, semi-tandem, semi-tandem, and single limb stance) for up to 10 seconds each.41,47,48 The 4SBT score was the sum of the time (up to 10 seconds) that a participant was able to maintain each of the 4 positions without upper extremity support or loss of balance. Possible scores ranged from 0 to 40.0, with higher scores indicating better balance. A score of 35.0 or lower suggested that a participant was unable to maintain the single limb stance position for at least 5 seconds, a finding that has been associated with an increased risk for falls.64
older adults.41,70,73,74 At CHAMP, participants performed 3 trials of the TUG, 1 practice trial and 2 test trials, and results of the 2 test trials were averaged to produce the TUG score.
Functional lower extremity strength was measured using CRT, a test of repeated sit to stand transfers performed independently and without upper extremity support. From 2009-2014, CHAMP providers administered the Chair Rise Test (CRT) as the 5 Times Sit-to-Stand (5xSTS) in accordance with OEP instructions.48 In 2015, CRT methods were changed from 5xSTS to the 30-second Sit-to-Stand test (30-s STS) to match recommendations from the Centers for Disease Control and Prevention.41,79 For this analysis, a common CRT variable was computed by dividing the number of stands by time to produce a value with units of number of stands per second.
3.2.1 Statistical Analyses
Data were analyzed using SAS 9.4 (SAS Institute Inc., Cary, NC). The significance level was set at p <0.05 for all analyses. First, descriptive statistics were calculated for all variables. Frequencies and distributions were assessed for baseline characteristics considered for evaluation as predictor variables based on previous literature. Predictor variables with skewed distributions were dichotomized.
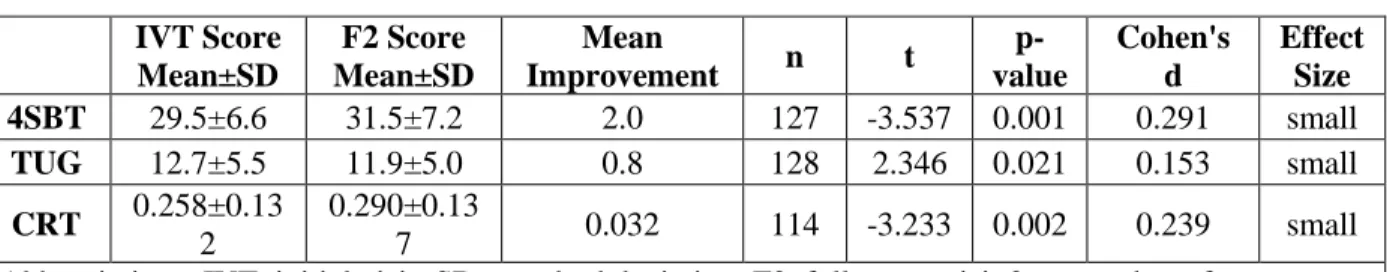
Paired samples t-tests were performed to assess change in scores on physical performance measures 4SBT, TUG, and CRT from IVT to F2. Effect sizes were calculated using Cohen’s d with common conventions used to classify values.81 Categorical variables depicting
assessed to determine the use of either logistic or linear regression to examine the relationship between relevant participant characteristics and performance on the measure.
Initial univariate analyses with baseline characteristics selected as predictor variables were carried out by logistic regression modeling improvement compared to no improvement or linear regression modeling F2 score as the dependent variable. Predictor variables were selected for inclusion in final multivariable linear or logistic regression models based on the suitability of their distributions, significant prediction of dependent variables in univariable analyses at a level of p<0.1, and low likelihood for collinearity with other covariates. Estimates and p-values were calculated for parameters in multiple regression models for each of the 3 physical performance measures.
3.3 Results Participant Characteristics
A total of 483 community-dwelling adults participated in at least one CHAMP event, with 28 excluded from data analysis because of incomplete initial visit or age <60 years. Of these, 353 individuals were recommended to return for CHAMP follow-up, with 117 (33.1%) not returning. Of the 236 participants who received up, 151 returned for two CHAMP follow-up visits. To reduce confounding effects of time on change in performance, this study limited inclusion to 130 individuals whose return to F2 occurred within 6 months of their IVT. Out of these 130 participants, 128 were eligible for inclusion based on return to F2 within 6 months of F2 as well as having IVT and F2 visit scores recorded for 4SBT, TUG, and CRT.
transformed from continuous or multilevel categorical to dichotomous because the majority of observations occurred within two categories and further subdivision resulted in non-normal distributions and skewed frequencies. To avoid collinearity, dichotomous fall history and not dichotomous injurious fall history was used as a predictor variable.
Table 6 provides information about mean changes in 4SBT, TUG, and CRT scores from IVT to F2. When the physical performance measures were each dichotomized to distinguish CHAMP participants who improved (any positive change, regardless of magnitude) on the measure from those who stayed the same or got worse, improvements were seen for 76 (59.8%), 73 (57.0%), and 69 (60.5%) participants on the 4SBT, TUG, and CRT, respectively. Based on the distribution of data for these 3 dependent variables as well as univariable analyses with individual predictor variables, it was determined that logistic regression would be appropriate for the 4SBT and CRT and linear regression would be appropriate for the TUG.
Characteristics Associated with Improvement
4SBT
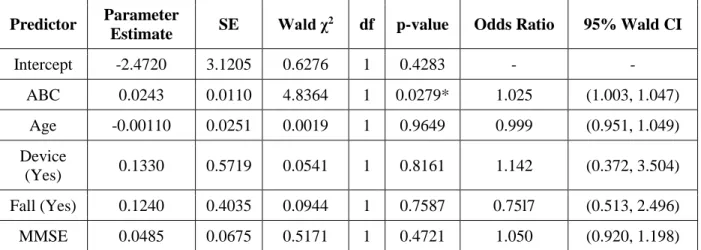
Multiple variable logistic regression showed that the only significant predictor of improvement in 4SBT was greater balance confidence measured by ABC at the initial visit. Variables included in the model that were not significant predictors were age, device, fall, and MMSE. Table 7 shows the results of the logistic regression modeling improvement in 4SBT.
TUG
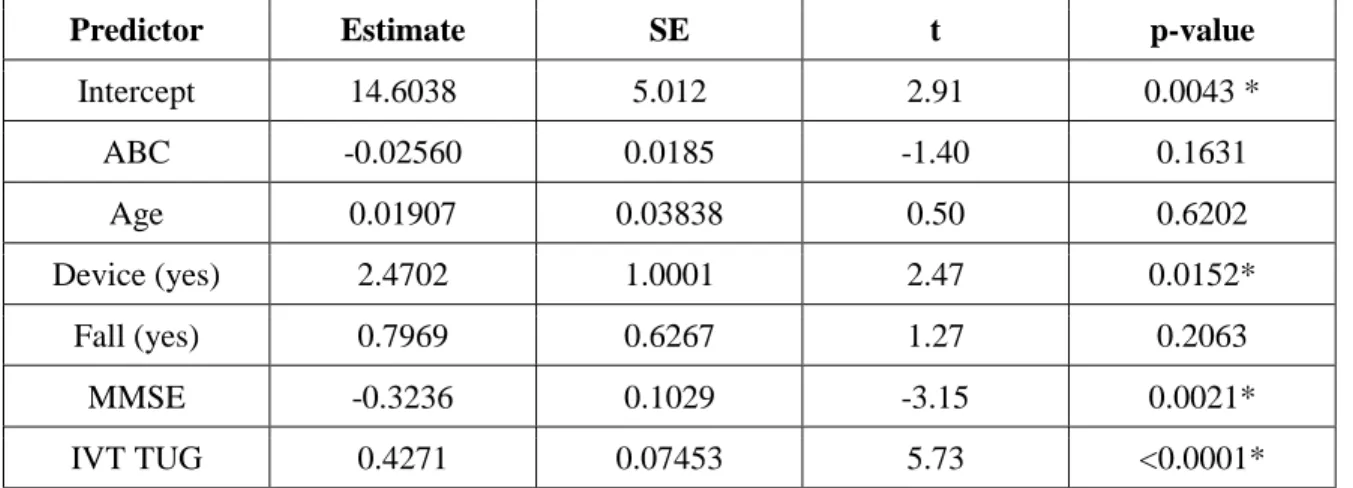
Table 8 shows the results of a multiple variable linear regression modeling F2 TUG. Lower (better) F2 TUG scores were significantly predicted by no use of assistive device, higher scores on MMSE, and lower (better) IVT TUG score. Variables ABC, age, and fall did not significantly contribute to the model.
CRT
Table 9 depicts the results of a logistic regression modeling improvement on CRT. According to the model, improved CRT was predicted by younger age and higher scores on MMSE at IVT. Variables ABC, device, and fall were not significant predictors of improvement in CRT.
3.4 Discussion
Results from this study failed to support our hypothesis that individuals with
among the 3 models was that improvement was greater for individuals without characteristics associated with frailty.
Surprisingly, initial univariable analyses revealed no significant associations of gender, number or type of comorbidities, or activity limitation with 4SBT, TUG, or CRT. The
distribution of variables for gender, number of comorbidities, and presence of individual types of comorbidities was skewed among our sample and therefore may have increased the potential for Type II error. Distribution for the variable “limit,” however, was roughly equal, with 58.3% of participants reporting that they limit their activity out of fear of falling. The lack of significance associated with this variable and positive or negative change in 4SBT, TUG, or CRT may suggest that the single yes/no question related to activity limitation does not sufficiently capture the intricate relationship among psychological factors and physical performance measures. It is possible that a more detailed assessment of activity limitation, such as the Survey of Activities and Fear of Falling in the Elderly (SAFE), could be a stronger predictor of change in physical performance than the question, “Do you limit your activities because you are afraid you might fall?”97–99
Although history of at least 1 fall in the previous year was a significant independent predictor of TUG performance at F2, fall history was not a significant predictor of improvement in 4SBT or CRT or of F2 TUG performance in multivariable models. Though contrary to our hypothesis that positive history of falls would predict improvement, the absence of significant association between fall history and physical performance from IVT to F2 suggests that improvement can occur for participants regardless of fall history.
improvement in 4SBT from initial visit to F2. CHAMP participants with higher baseline balance confidence measured by ABC may have been more likely to practice balance exercises at home as prescribed by CHAMP providers. It is possible that individuals with lower baseline balance confidence chose to practice balance exercises less than the recommended amount or with increased use of upper extremity support because they did not believe they could perform the exercises safely on their own. For CHAMP participants with poor baseline balance confidence measured by ABC, greater encouragement and in-session practice may be needed for participants to have sufficient confidence to perform balance exercises without assistance. CHAMP providers can stress the importance of practicing balance exercises in order for participants to experience actual improvement in balance. Participants with poor balance confidence may also benefit from multiple repetitions of practice of balance exercises during the exercise prescription portion of the CHAMP event. Additional practice performing a balance exercise correctly and safely in the presence of CHAMP providers may help build a participant’s self-efficacy to complete the same exercise on their own at home.
exercises independently at home. Alternatively, the participant may benefit from referral to local providers to address factors such as balance confidence and cognitive impairment.
Improvement in CRT was significantly predicted by younger age and lower MMSE in the multivariable model that also included ABC, use of device, and fall history. That younger CHAMP participants have greater odds of improving on the CRT is consistent with our other findings that characteristics not associated with frailty predict improvement on 4SBT and better scores on F2 TUG. Improvement in CRT for individuals with lower MMSE may be related to the ease of the CRT test and of the chair rise exercise from OEP, which is often prescribed to
CHAMP participants. The chair rise exercise is a straightforward exercise that can be practiced without additional equipment and that participants are typically comfortable performing on their own. Individuals who practice the chair rise exercise are likely to improve their performance on the CRT because the exercise is so similar to the test. Based on the combination of benefits from task-specific practice and the simplicity of the test itself, the CRT may be a better measure of change in physical performance for individuals with cognitive impairment than the TUG or 4SBT.100
Research demonstrates that the original OEP designed in New Zealand and delivered in an older adult’s home is most effective for individuals over 80 years of age and with increased frailty.15 While specific relationships varied by each outcome measure, we found that CHAMP participants most likely to demonstrate improvement were younger and without characteristics commonly associated with frailty. The difference in characteristics predicting improvement may be related to the difference in settings where CHAMP and traditional OEP are provided.
that successful participation in CHAMP requires greater community mobility than traditional OEP. As a result, individuals likely to maintain participation in CHAMP from IVT to F2 and achieve benefits from the program may be younger and less frail than participants who typically experience the greatest benefit from traditional OEP.43,46,101 CHAMP providers can use this information to identify participants with increased age and frailty who require additional support to maximize their level of improvement on physical performance with CHAMP participation. Limitations
Participants included in this analysis were restricted to those who elected and were able to attend a falls screening and intervention in the community, were determined to have an increased risk for falls, and followed recommendations to return for 2 subsequent visits in less than 6 months. While our sample was representative of the older adult population of western North Carolina, the homogeneity of gender and race limits applicability of our findings to other geographical areas. Limited variability of gender and number of chronic conditions may also have increased Type II error rate. Future studies should include a larger study to increase diversity of the sample and variables and to reduce the likelihood of Type II errors.
Measures included in this analysis were limited to those that are quick and easy to implement in a community setting by a variety of different providers with a variety of
3.5 Conclusions
This study found that significant predictors of improvement on physical performance measures vary depending upon the measure but that individuals who benefit from a community-based falls prevention program that includes OEP are generally those with decreased
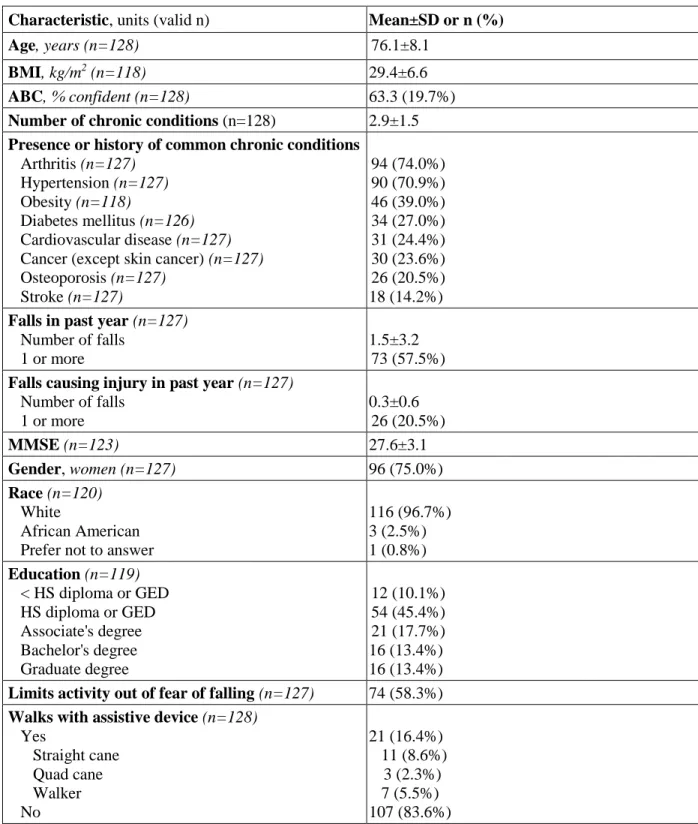
Table 5. Baseline Characteristics of Participants (N=128)
Characteristic, units (valid n) Mean±SD or n (%)
Age, years (n=128) 76.1±8.1
BMI, kg/m2 (n=118) 29.4±6.6
ABC, % confident (n=128) 63.3 (19.7%)
Number of chronic conditions (n=128) 2.9±1.5
Presence or history of common chronic conditions
Arthritis (n=127) Hypertension (n=127) Obesity (n=118)
Diabetes mellitus (n=126) Cardiovascular disease (n=127) Cancer (except skin cancer) (n=127) Osteoporosis (n=127) Stroke (n=127) 94 (74.0%) 90 (70.9%) 46 (39.0%) 34 (27.0%) 31 (24.4%) 30 (23.6%) 26 (20.5%) 18 (14.2%)
Falls in past year (n=127) Number of falls
1 or more
1.5±3.2 73 (57.5%)
Falls causing injury in past year (n=127) Number of falls
1 or more
0.3±0.6 26 (20.5%)
MMSE (n=123) 27.6±3.1
Gender, women (n=127) 96 (75.0%)
Race (n=120)
White
African American Prefer not to answer
116 (96.7%) 3 (2.5%) 1 (0.8%)
Education (n=119)
< HS diploma or GED HS diploma or GED Associate's degree Bachelor's degree Graduate degree 12 (10.1%) 54 (45.4%) 21 (17.7%) 16 (13.4%) 16 (13.4%)
Limits activity out of fear of falling (n=127) 74 (58.3%)
Walks with assistive device (n=128)
Yes Straight cane Quad cane Walker No 21 (16.4%) 11 (8.6%) 3 (2.3%) 7 (5.5%) 107 (83.6%)