OVERWASH DEPOSITION INCREASES BACKBARRIER MARSH RESILIENCY TO SEA LEVEL RISE: INSIGHTS FROM A COUPLED BARRIER ISLAND-MARSH
MODEL
David Walters
A thesis submitted to the faculty of the University of North Carolina at Chapel Hill in partial fulfillment of the requirements for the degree of Master of Science in the Department of
Geological Sciences.
Chapel Hill 2013
ii © 2013 David Walters
iii ABSTRACT
David Walters: Overwash Deposition Increases Backbarrier Marshes Resiliency to Sea Level Rise: Insights from a Coupled Barrier Island-Marsh Model
(Under the direction of Laura Moore)
iv
ACKNOWLEDGMENTS
v
TABLE OF CONTENTS
LIST OF TABLES……….……….………..……..vii
LIST OF FIGURES………viii
LIST OF ABBREVIATIONS AND SYMBOLS………..………….ix
CHAPTER 1: OVERWASH DEPOSITION INCREASES BACKBARRIER MARSH RESILIENCY TO SEA LEVEL RISE: INSIGHTS FROM A COUPLED BARRIER ISILAND-MARSH MODEL………..………..1
1. Introduction……...………..……….……….1
1.1 Background………..……..…..…….1
1.2 Study Area – The Virginia Barrier Islands and Metompkin Island….……….5
2. Modeling a Coupled Barrier Island-Marsh System……….…..6
2.1 Developing GEOMBEST+………....………6
2.2 Model Inputs……….……...…11
2.2.1 Initial Morphology and Stratigraphy………....11
2.2.2 Overwash Parameterization………..…13
2.2.3 Bay Sediment Flux ………..14
2.2.4 Organic Content of Marsh Stratigraphic Unit………..…15
2.2.5 Parameters for Backbarrier Evolution……….….16
2.3 Comparison with Coupled Salt Marsh-Tidal Flat Hydrodynamic Model...…16
3. Model Simulations and Comparison with Observations ..………...…18
vi
3.1.2Comparison of Experimentally-derived Marsh Widths
to Observations from Remote Sensing...………...23
3.2 Impact of Backbarrier Environment on Long-Term Island Migration Rate...26
4. Discussion……..………...……...….28
4.1 Model Limitations.……….….……28
4.2 Impact of Overwash on Backbarrier Marshes……….………31
4.3 Impact of Marsh Morphology and Sedimentology on Island Migration……….………..34
5. Conclusions………..…………36
Figures and Tables…..……….………...……37
vii
LIST OF TABLES Table
1. Parameters used for stratigraphic units………..…..…....40
2. Parameters used for marsh width experiments………...….……43
viii
LIST OF FIGURES Figure
1. Map of Delmarva Peninsula and Metompkin Island………..……….…38
2. Diagram of functional realms in GEOMBEST and GEOMBEST+……..……...…..39
3. Sand% vs. depth marsh sediment cores……….……..41
4. Organic matter% vs. depth for marsh sediment cores………...……..…42
5. Profile of initial morphologies for GEOMBEST+………...………...44
6. Marsh progradation rate vs. RSLRR for the marsh-tidal
flat evolution model compared to GEOMBEST+……….………..…45 7. Frequency distribution of marsh width from model experiments…….…….…..…...46 8. Change in marsh width versus sea level rise for transient narrow marshes……..…..47 9. Marsh width occurrence vs. BSF, RSLRR, and OWF………….………..…...48
10.Marsh width variation in phase space………..49
11.Frequency distribution of backbarrier marsh width
from satellite imagery of Metompkin Island……….………..…50 12.Frequency distribution of backbarrier marsh for the VCR………..…51 13.Map of backbarrier marsh width and DHigh measurements along the VCR…..……...52
14.Narrow marsh width occurrence vs. DHigh……….………..…53
15.Long term island migration rate vs. OWF, for varied backbarrier basins….………...54
16.Shoreline position vs. Time, for empty and narrow-marsh filled basins……….55
ix
LIST OF ABBREVIATIONS AND SYMBOLS
AB Bay accretion rate
BAR Basin Accretion Rate BSF Bay sediment flux
CSS Suspended sediment concentration
d Depth of the bay
DHigh Position and elevation of the most seaward dune crest
dL Low tide line
dR Depth below which wave energy does not cause a net erosion
E Depth dependent erosion rate
Emax Maximum erosion rate for the bay
LB The alongshore dimension of the back barrier bay
LOI Loss on ignition
OC Organic content fraction
OWL Overwash length
OWF Overwash volume
RSLR Relative sea level rise RSLRR Relative sea level rise rate
t Time
T Overwash thickness at a given location T0 Overwash thickness at the dune limit
VBI Virginia Barrier Islands VCR Virginia Coast Reserve
1
CHAPTER 1: OVERWASH DEPOSITION INCREASES BACKBARRIER MARSH RESILIENCY TO SEA LEVEL RISE: INSIGHTS FROM A COUPLED BARRIER
ISLAND-MARSH MODEL 1. Introduction
1.1 Background
As narrow, low-lying landforms—separated from the mainland by shallow (often marsh-filled) bays—barrier islands are, at once, vulnerable to changing environmental conditions and popular landforms on which to live or vacation. In addition to the economic importance of barrier islands themselves [Zhang and Leatherman, 2011], the low-energy basins sheltered by islands are also valuable commodities, as indicated by economic assessment of marsh ecosystem services [Costanza et al., 1997]. As climate change leads to accelerated relative sea level rise (RSLR) [e.g., IPCC, 2007; Vermeer and Rahmstorf, 2009] and the potential for more frequent major hurricanes [e.g., Emanuel, 2005; Knutson et al., 2010], barrier islands and their associated marshes and shallow bays will respond by transgressing landward, such that sandy islands roll over backbarrier marsh, backbarrier marshes prograde into backbarrier bays, and bays flood the mainland.
2
[Masetti et al., 2008; Storms et al., 2002], substrate slope [Moore et al., 2010; Storms et al., 2002; Wolinsky and Murray, 2009] and substrate erodibility [Moore et al., 2010]. Among these, recent work suggests that the sand supply to the island and the RSLRR are the primary drivers for island migration [Moore et al., 2010]. Recent modelling experiments, conducted using the morphological behavior model, GEOMBEST, also demonstrate that barrier islands are sensitive to changes in the substrate slope and sand content of the backbarrier region, where an increase in either leads to a decrease in landward migration rates, and indicates that backbarrier
sedimentation plays an important role in maintaining a steady rate of island transgression into the future [Brenner, 2012].
As sea level rises, tidal salt marshes accrete fine-grained sediment vertically (largely due to frequent flooding by sediment-laden water) thereby maintaining elevation of the marsh platform relative to sea level and keeping marsh plants within the elevation range to which they are adapted [French, 1993]. The rate at which a marsh accretes is dependent on fine-grained sediment input [Kirwan et al., 2011; Mudd, 2011] and bio-physical feedbacks such as an increase in the growth rate and subsequent organic deposition of the salt marsh macrophyte Spartina alterniflora in response to an increase in the depth below high tide [Kirwan et al., 2011; Morris
et al., 2002; Mudd et al., 2010]. Due to these feedbacks, marsh platforms are stable (i.e., able to
3
flat and creating new marsh or eroding into the marsh platform and creating more tidal flat, as a function of the fine-grained sediment supply to the marsh relative to the RSLRR.
Though our understanding of how barrier islands and marshes respond to climate change continues to improve, we know little about the interactions and feedbacks between the two and how the coupled barrier-marsh systems evolves under changing conditions. For example, under rising sea level, a backbarrier marsh will lose an aerial extent equal to the rate at which the barrier island rolls over the marsh platform, unless the marsh progrades into the bay.
Meanwhile, contributions to marsh accretion via overwash deposition of barrier island sediments may enhance the ability of a marsh to keep up with RSLR by decreasing the amount of fine-grained sediment supply necessary to maintain marsh elevation. Alternatively, thick deposits of sand delivered to the marsh via island overwash may damage or kill marsh vegetation, thereby hindering marsh response to increasing RSLRR. As an example of how marshes impact barrier islands, the presence of a marsh platform reduces accommodation space as an island transgresses across the backbarrier region in response to RSLR and therefore can potentially reduce the rate at which the island needs to transgress to maintain its elevation relative to sea level [Stolper et al., 2005]. In addition, as an island transgresses and migrates across the backbarrier, the substrate it encounters will have a composition (i.e., sand percentage) and erodibility determined by the backbarrier environment under which it was deposited. Such cross-shore variations in
4
Because such feedbacks will influence the future evolution of coupled barrier island-marsh systems, it is important to understand their effects. To this end, I use the framework of an existing morphological-behavior model for island transgression GEOMBEST (Geomorphic Model of Barrier, Estuary and Shoreface Translations) [Moore et al., 2010; Stolper et al., 2005] and follow the approach to marsh-tidal flat evolution presented in Mariotti and Fagherazzi [2010] to create a new model that simulates the evolution of coupled barrier island-marsh systems. The new coupled model, GEOMBEST+, is parameterized based on field observations and data collected in Metompkin Island, Virginia, USA, but is formulated to address variable conditions in a way that it is applicable to barrier islands generally. I compare results from the newly developed model to results from Mariotti and Fagherazzi [2010] to demonstrate that the new model produces patterns of marsh progradation (as a function of RSLRR and fine-grained sediment supply) that are similar to results from the established model.
5
1.2 Study Area – The Virginia Barrier Islands and Metompkin Island
The Virginia Barrier Islands (VBI)—a transgressive barrier island chain located on the Delmarva Peninsula on the U.S. mid-Atlantic coast (Figure 1)—includes the Virginia Coast Reserve (VCR) which is owned and managed by The Nature Conservancy. There has been little direct human impact on the islands of the VCR, which makes them an ideal natural laboratory in which to study barrier island and salt marsh processes. Backbarrier environments along the VCR include extensive marsh platforms and shallow bays, with a wide array of ecosystems supported across the landscape. The VCR is located within a hot spot of RSLR [Sallenger et al., 2012] and has been experiencing a RSLRR of 3-4 mm/yr over the past century [Porter et al., 2013].
Climate change is also impacting the VCR through changes in wave climate [Komar and Allan, 2008] and a recorded increase in intense hurricane landfalls along the US mid-Atlantic coast [Bender et al., 2010]. This leads to both an increased probability of intense hurricane paths crossing over the VCR, and the generation of higher-energy waves associated with hurricanes whose paths remain offshore.
6
2. Modeling a Coupled Barrier Island-Marsh System 2.1 Developing GEOMBEST+
To investigate the role of couplings between barrier islands and marshes, I adapted the previously described barrier island model, GEOMBEST [Moore et al., 2010; Stolper et al., 2005] to create a new version of the model that simulates the coupled evolution of a barrier-marsh system. In its original form, GEOMBEST is a two-dimensional morphological behavior model that simulates barrier island evolution in response to changes in sea level and sand supply. GEOMBEST simulates the morphologic and stratigraphic evolution of shoreface, barrier and bay environments over the time scale of decades to millennia. I provide a brief description of model formulation and inputs here. For a more detailed discussion of the model, I refer the reader to Moore et al. [2010].
GEOMBEST is formulated under sand conservation principles, meaning that it accounts for and balances sand supplied from the shoreface erosion and/or alongshore sand transport with sand deposited on the subaerial island and in the backbarrier. The model is also formulated under the assumption that over long time scales, a barrier island and shoreface profile will tend to remain invariant, such that an equilibrium profile shape (i.e., morphology) tends to be maintained. Morphological evolution is driven in the model by differences between a user-specified equilibrium profile that extends from the shoreface to the backbarrier marsh, and the existing island morphology, defined in a 2-dimensional grid of surface morphology and
7
underlying stratigraphy, sand supply, and substrate erodibility can cause the morphology to depart from the equilibrium shape, if the erosion and accretion rates are not sufficient for the island to reach the equilibrium morphology, as the magnitude of the rates decreases linearly to zero at the shoreface depth (i.e. - depth dependent response rate).
8
having to migrate as far as in the case of a substrate with less sand. Similarly, a substrate with low erodibility will not be able to migrate as far within a given time step as a substrate with high erodibility.
The new version of the model—which I call GEOMBEST+—differs from previous versions of GEOMBEST, in that the equilibrium morphology that tends to be maintained under most conditions does not extend to the backbarrier marsh. Past the topographic low located at the high tide line on the landward side of the island, known as the dune limit, the backbarrier evolves dynamically such that the marsh either progrades or erodes into the bay as a function of the rate of sea level rise and fine-grained sediment availability as in Mariotti and Fagherazzi [2010]. I altered the functional realms in GEOMBEST+ such that the marsh is now considered part of the backbarrier realm, which is filled with a combination of bay and marsh (Figure 2B). GEOMBEST+ also includes a new stratigraphic unit representing the marsh, and a new index parameter to describe the stratigraphic layers (in addition to sand content and erodibility), known as the organic content, which gives the volume portion of the sedimentary bed that is occupied by organic matter rather than mineral sediment. I ran all experiments using a cell size of 50m width by 0.1m height, and time steps of 10 years, though the backbarrier processes iterate on a smaller time scale, calculated within the model as the critical time for the bay to reach an equilibrium depth, where the rates of erosion and accretion are equal.
9
high water line and mean sea level), with an autochthonous input of organic sediment and an allochthanous input of fine-grained sediments exported from the bay. An additional supply of sediment for the backbarrier is overwash, which is sand that storms erode from the front side of the island and deposit into the back. Overwash occurs in the model by taking sand from the budget of the shoreface/island and depositing it into the backbarrier over the marsh/bay. Two parameters control overwash deposition in the model: overwash volume flux (OWF) and
overwash thickness (T0). These parameters determine the morphology of the overwash fan as it
is deposited over the backbarrier region for a given time step. Deposition starts at the dune limit with an initial thickness of T0, which is prescribed as an input parameter, and extends landward,
with the thickness of sediment deposited decaying exponentially according to:
T(x) = T0 * exp (-x /Lc) (1)
Lc = OWF / T0 * dt (2)
where T is the thickness of the overwash deposit at a distance x from the dune limit. The length scale Lc controls the distance over which the overwash deposit extends into the backbarrier. For
a given OWF, a greater T0 will result in an initially thicker overwash fan, for which the thickness
quickly decays to near zero. Conversely, a small T0 means the thickness of the overwash deposit
will not decay as quickly, and the overwash fan will have a greater OWL. GEOMBEST+ does
not simulate the deposition of individual storm overwash layers but rather creates an overwash deposit that represents the characteristic thickness from the average effect of all storms that occurred over a given time step.
10
overwash. GEOMBEST+ uses BSF, an indirect sediment input, as opposed to the direct input of suspended sediment content (C) that other marsh models use, because it allows the model
domain to contain the entire backbarrier bay, instead of setting a constant C at the model domain boundary. In previous models of tidal landform evolution, the advection and diffusion of C is simulated to resolve rates of erosion and deposition on a fine time and space scale [Marani et al., 2010; Mariotti and Fagherazzi, 2010]. For the basin-scale view of the effect of sediment
exchange processes that is required for GEOMBEST+, it is more appropriate to resolve processes on larger time and space scales. Therefore, GEOMBEST+ simulates a potential maximum flux of sediment through the system, with some portion deposited, depending on the accommodation space in the basin. It is expected that this will result in a difference between the two approaches in the relationship between fine-grained sediment supply and marsh edge
migration, though the net effect of each is to increase the rate of progradation for the marshes. The BSF value can be set as positive or negative to reflect a net export of sediment from the backbarrier bay, as the system operates under the conservation of mass. In the model, the bay accretion rate per unit width, AB, is determined from the BSF:
AB = BSF / LB (3)
where LB is the cross-shore dimension of the backbarrier bay. The depth dependent erosion rate
(E) is determined as a function of RSLRR:
E = Emax – Emax * (d + RSLRR * dt) / dR (4)
where Emax is the maximum erosion rate for the bay, a parameter determined by the wave energy
potential, d is the depth of the bay below mean sea level at time t, dt is the time step, and dR is
11
tidal flat evolve evolves towards a concave up profile with a marsh or unvegetated terrace developing at the landward boundary of the tidal flat. Once the cell at the bay boundary accretes to the low tide line (dL), vegetative growth augments the accretion rate through the deposition of
organic matter, and the marsh stratigraphic unit at a fixed ratio to the mineral sediment, as a function of the parameter for organic content fraction (OC):
E d > dL (5)
E + E * OC d < dL
where AM, the accretion rate of the cell at the bay boundary is divided by two, since there is a
boundary cell on either end of the two-dimensional bay (Figure 2). The marsh accretes vertically up to the high tide line, and then accretion begins in the next bayward cell thereby leading to marsh progradation. When fine-grained sediment supply is insufficient for the marsh edge to prograde, the marsh boundary remains stationary. The model does not simulate the erosion of the edge of the marsh platform by wave energy, but will erode and resuspend the sediment if the platform falls below sea level.
2.2 Model Inputs
2.2.1 Initial Morphology and Stratigraphy
For the initial conditions for each set of experiments, I used the initial stratigraphy and morphology (extending from the base of the shoreface to the center of the mainland peninsula) which Brenner (2012) previously developed. Brenner averaged 5 cross-shore profiles extracted from LIDAR (NASA: Charts 2005), and bathymetric data (NOAA National Coastal Elevation Model) along multiple transects spaced at 1-km intervals across the southern half of Metompkin Island. I smoothed the average profile to create a simplified initial condition for model
simulations, since the goal of these experiments is to simulate processes as they occur on a general barrier island, and not to model Metompkin Island precisely. I used the resultant profile
{
12
to create an equilibrium profile, extending from the shoreface to the dune limit, following the assumption that shoreface and barrier morphology tend to be invariant through time [Larson, 1991]. I also used a modified version of the stratigraphic units defined by Brenner for the barrier island, bay, and underlying stratigraphic units, which he identified and estimated index values for the sand content and erodibility using core data (Table 1). For simplification purposes, I
combine the underlying stratigraphic units (a sandier late-Pleistocene fluvial deposit and a muddier early-Holocene lagoonal unit) into one, generic underlying stratum, by averaging the sand content and erodibility of the two.
To constrain sand content for the newly added backbarrier marsh stratigraphic unit, I collected and analyzed 9 cores from 6 sites in across- and alongshore transects (using a Russian peat corer), both parallel and perpendicular to a small overwash fan on Metompkin Island
(Figure 1B). Cores extended to a depth of 200 cm unless a non-peat layer was reached sooner. I sampled 1cm segments from the core at 5 cm intervals, and dried the sediment samples overnight at 60° C, to determine the dry weight of each sample. I subsampled the 1cm sections of core in replicate and used a Beckman Coulter Laser Particle Size Analyzer LS 13 320 to determine sand content. I prepared samples by dispersing 0.1-1 g of sediment in 20 mL H2O, with 2 drops of
surfactant Polysorbate 20 to prevent particle flocculation, and then sonicated the solution for 5 minutes, to disaggregate clumped particles of clay. I determined the percent of sand in each core by dividing the volume of particles from the grain size distribution that are greater than 63 μm in
diameter by the total volume of particles.
13
between the different sampling locations shows that sand percent is greatest in the cores near the dune limit (sample sites C, D, E, and F; with average sand percent of 43, 90, 12 and 54,
respectively) and decreases exponentially to the marsh edge (sample sites A and B; with sand percent of 18 and 20, respectively) (Figure 2B). This suggests that proximity to the dune has an effect on the sand content in the marsh platform, most likely due to either aeolian or overwash deposits. Therefore, I consider these sample locations to be a mixture of marsh sediment and barrier island sand, as the barrier rolls over the marsh platform. Cores A and B, from the interior of the marsh platform, show a distinct jump in sand percent at a depth of 32-46 cm (Figure 3A & B), which I associate with a change in depositional environment from bay deposits to intertidal marsh, which is consistent with a decrease in organic content seen at the same depth (Figure 4A & B). From a depth of 0-32cm (excluding the lagoonal deposit), cores A and B have an average sand percent of 9.5 and 10.8, respectively, which values I determine to be representative of the sand content within the marsh. On the basis of these values, I set the sand content for the marsh unit to 0.1, for all experiments (Table 1).
2.2.2 Overwash Parameterization
Between different simulation runs, I vary overwash volume flux (OWF) from 0 to 2 m3/yr
per 1 m in the alongshore direction (Table 2). This falls within the range of values reported from surveys of overwash fans [Fisher et al., 1974; Leatherman, 1987; Leatherman and Williams, 1977], and produces backbarrier deposits that resemble realistic overwash fan morphologies. Since individual storms are not modeled in GEOMBEST+, but the sum of all the storms over the span of a given time step, I do not select values for overwash thickness (T0) to reflect the
14
the OWF value, keeping the aspect ratio (thickness to length ratio) of the overwash fan, and
therefore the average slope of the overwash platform constant. Also, since the deposition of overwash in this model just begins at the backside of the island at the dune limit, this only addresses the shape of part of an overwash fan. The average overwash fan slope, under this parameterization is 0.005, dipping toward the backbarrier, which falls in the range of measured values (0.001-0.02) [Leatherman and Williams, 1977].
2.2.3 Bay Sediment Flux
The bay sediment flux (BSF) values for the marsh width experiments are run for a range of 2 to 20 m3/yr (Table 2). This parameter is not necessarily reflective of actual backbarrier bay sediment budgets, which are difficult to constrain, and involve many complex sources and sinks (ie- inlets, mud flats, tidal creeks, sea grass beds, etc.). Also, the actual BSF is just one control on the sediment budget available to the marsh, not including sediment that comes from overwash deposition. Additional variables that add complexity to the distribution of fine-grained sediment in a real backbarrier bay are basin accommodation space, tidal prism, and wave energy (due to fetch, wind strength and direction, etc.). Rather than attempting to capture all of these
intricacies, I designed the BSF parameter to control the growth of the backbarrier marsh at different rates, and I select the range of values based on the response of the backbarrier
15 2.2.4 Organic Content of Marsh Stratigraphic Unit
I set the organic content (OC) to zero for each of the non-marsh stratigraphic units,
assuming that organic matter has a negligible contribution to accommodation space in the
stratigraphic units. I determined organic matter content following methods of Chmura and Hung [2004], via loss on ignition (LOI) experiments, whereby I placed 1g replicates of each sample in a muffle furnace and slowly increased the temperature to 600° C, where it dwelled for 24-hr, in order to ignite the organic matter. I calculated the percent organic matter as the difference between the sample’s initial dry mass and final combusted mass divided by the initial dry mass, multiplied by 100. If the difference between the calculated percent organic matter of replicates was greater than 10%, I ran additional replicates of the samples to reduce uncertainty. The LOI experiments indicate that the Metompkin Island backbarrier marsh contains ~5% organic matter by mass, on average, with the values ranging from 0-15%, varying with depth and distance from the dune (Figure 4) which compares well with studies of similar aged marshes in other parts of the VCR [Osgood and Zieman, 1993]. Following the same method I used to identify the
representative marsh sediments for sand content, I use the average organic mass content for cores A and B, from a depth of 0-32 cm, which comes to 9.3%. To derive an organic content index (OC), I must convert from the percent organic matter by mass, to a volume percent. According to
Weinstein and Kreeger [2000] organic mass accumulation shows a correlation with accretion that
16 2.2.5 Parameters for Backbarrier Evolution
I set the relative of sea level rise rate (RSLRR) for the marsh width experiments to a range of values from 1 to 10 mm/yr, in increments of 1, which covers the range of relative sea level rise rates experienced across the East Coast of the United States [Sallenger et al., 2012]. The long-term island migration experiments use a RSLRR of 4 mm/yr, as this approximates the average rate of sea level rise seen in the Virginia Coast Reserve over the past century, and gives a conservative projection for the coming centuries. The maximum erosion rate for the bay (Emax)
is set at 10 cm/yr, and the resuspension depth (dR) is set at 0.4 meters (Table 2). These values
constrain the bay to a range of morphological behavior appropriate for a shallow backbarrier bay. These parameters can be calibrated to approximate larger bays that generate larger waves with an increased potential for sediment resuspension.
2.3 Comparison with Coupled Salt Marsh-Tidal Flat Hydrodynamic Model
Mariotti and Fagherazzi [2010] describe a series of model experiments that demonstrate
a linear increase in the progradation rate of marsh boundaries with an increase in suspended sediment concentration (CSS), as a function of the relative sea level rise rate (RSLRR) (Figure
6A). GEOMBEST+’s simplified model of marsh progradation does not simulate the detailed processes of sediment transport, and uses bay sediment flux (BSF) instead of C to set the fine-grained sediment supply to the marsh. To determine if these differences are important, I compare GEOMBEST+ to the results of the hydrodynamic model, by running a series of 70-yr experiments for a range of BSF and RSLRR values, allowing the marsh to prograde freely into the backbarrier bay (Figure 5). Experiments are run for a duration of 70 years, because
17
of barrier island transgression), I prevent island migration by increasing the rate of sand supply to offset the effect of increasing RSLRR and track the rate at which the marsh progrades as sea level rises.
The hydrodynamic model and GEOMBEST+ produce broadly similar results that
indicate the rate of marsh progradation decreases linearly as a function of the RSLRR for a given rate of fine-grained sediment supply (Figure 6), though there are some notable more quantitative differences. Results from the hydrodynamic model suggest that marsh edges always prograde or erode such that a stable boundary (i.e., progradation rate is equal to zero) does not exist (Figure 6A). In contrast, because I did not include wave-induced marsh-edge erosion in GEOMBEST+, at high RSLRR and low rates of fine-grained sediment supply, progradation rates converge to zero (Figure 6B). Because, in these cases, the marsh boundary remains stationary, this effectively serves as a short-term stable state within the model. Over longer time scales
however, as sea level rises above the level of the marsh platform, the marsh becomes submerged and erodes vertically. Though this is a fundamentally different process than the continuous, wave-induced horizontal erosion that occurs in the hydrodynamic model, the effect in the context of the present work is the same. While there can be a stable marsh boundary in GEOMBEST+ over shorter time scales, it does not result in a stable width of the marsh platform, because the barrier island transgresses over top of the marsh platform, and if the marsh does not prograde to keep pace, it will narrow and eventually disappear.
18
C in the hydrodynamic model. In the hydrodynamic model, fine-grained sediment availability to
the marsh from C is independent of basin size. C is freely available to be deposited onto the marsh platform, and there is more accommodation space over the marsh platform as sea level rises, but this approach does not account for increasing accommodation space in the estuary. In contrast, the BSF parameter in GEOMBEST+ accounts for both the increase in accommodation space over the marsh platform as sea level rises and the increase in accommodation space in the bay. At higher RSLRRs, the marsh progradation rate is slower, which means that the backbarrier basin is filled with a higher proportion of bay as opposed to marsh, and more of the fine-grained sediment is stored in the bay as opposed to the marsh. As a result, the relationship between RSLRR and marsh progradation in GEOMBEST+ depends on both the BSF and the size of the
backbarrier basin, with larger basins being a larger sediment sink than smaller ones. Therefore it is important to constrain basin width before making comparisons between simulations in
GEOMBEST+.
3. Model Simulations and Comparison with Observations 3.1.1 Impact of Barrier and Backbarrier Processes on Marsh Width
The purpose of this set of experiments is to better understand how marsh morphology changes as a function of the input of sediment coming from island processes (storm-deposited overwash sediment) as opposed to backbarrier processes (tidally-delivered fine-grained
sediment), under conditions of rising sea level. To assess the relative impact of the two sources of sediment, I run a set of experiments in which I systematically vary the parameters for the relative sea level rise rate (RSLRR), the bay sediment flux (BSF), and the rate of overwash delivered to the marsh (OWF) one at a time (Table 2), while tracking the final width of the
19
marsh platform. By comparing the marsh widths and the varied parameters, I can determine which parameters have the greatest control over backbarrier marsh morphology.
I first vary the RSLRR such that sea level rises a total of 1m in each simulation, at rates of 1 mm/yr to 10 mm/yr in increments of 1 mm/yr, resulting in simulated time periods ranging from 100 to 1000 years. Constraining total sea level rise in this way insures that the barrier island traverses the same stretch of substrate in each simulation thereby controlling for the effect of substrate slope on barrier island migration [Moore et al., 2010], except for the changes in slope due to backbarrier marsh progradation. I also vary the sediment input parameters across a range of realistic values for BSF (2 – 20 m3/yr) and OWF (0.2 – 2 m3/yr) (Table 2). Overwash
thickness (T0) is also varied, but it is varied in a fixed ratio to OWF such that the geometric shape
of the overwash deposit remains constant. Initial conditions are the same for all simulations except that I also run replicate experiments where I vary the proportion of the backbarrier basin that is open bay versus marsh. Here I consider an 1800m-wide open bay without marsh (i.e., empty basin), a 1000m-wide bay fringed by a 400m-wide (i.e., narrow marsh) marsh on both the barrier island and mainland side, and a basin completely filled by an 1800m-wide marsh (i.e. filled basin). I choose these scenarios, based on trial experiments, for their approximation of the three potentially stable states for backbarrier marsh width. Overall, I run experiments varying the three parameters for 10 values, using 3 different initial conditions, and all combinations thereof, therefore there are 3,000 simulations run in total.
20
progradation rate at the marsh boundary is equal to the island transgression rate, then marshes of that particular width should occur more frequently than others. The frequency distribution of the final backbarrier marsh width from the experiments shows that there are peaks at both 0m and 2000m, for backbarrier basins that are completely empty and completely filled with marsh (Figure 7A). The upper peak includes values above the initial maximum back-barrier marsh width (1800m), because more of the mainland is submerged by the rising sea level, allowing the marsh to expand. I determine the range that the two end-member peaks cover by identifying the point at which the deviation from a hypothetical random uniform distribution is at a maximum, which occurs at 67m for the lower boundary, and 1775m for the upper boundary (Figure 7B).
A third peak, smaller than the first two, appears between the two end members, centered at approximately 250 meters (Figure 7C). I remove the peaks associated with the boundary conditions of empty basins and filled basins from the dataset, to test the null hypothesis that the remaining widths will be distributed in a random uniform distribution, with each bin having equal probability for marshes of that width occurring. A one-sample Kolmogorov–Smirnov test for statistical significance confirms that the intermediate peak deviates from a random uniform distribution at a 95% confidence level, with the maximum deviation occurring at 448m (Figure 7D). Since the maximum deviation occurs at the point where the distribution begins to converge on the uniform distribution, this sets the upper bound of the stable range for the intermediate peak, and the lower bound is set to the point at which the empirical distribution begins to deviate from the hypothetical distribution, at approximately 150 m (Figure 7D). This leads to the
21
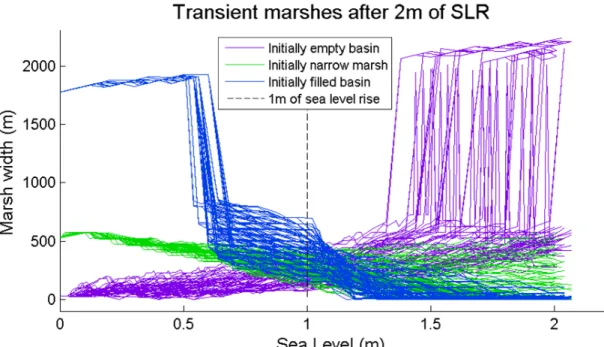
To test the stability of these narrow marshes, I run the simulations that result in final marsh widths in this range for an additional meter of sea level rise, holding the parameters for OWF, BSF, and RSLRR constant. Of the 340 runs (11.3% of all simulations) that populate the
narrow marsh peak after one meter of sea level rise, only 33 remain in the 150-450m range after an additional meter of sea level rise. For the simulations that began initially empty, they
prograde throughout the simulation and pass through the narrow marsh range until ultimately stabilize once filling the entire basin, while for the cases of the initially narrow and initially filled basins, they narrow throughout the simulation, only stabilizing once the marsh width equals zero (Figure 8). So while the narrow marsh peak is indicative of an intermediate stable state, it still represents a long lasting transient state which results in a higher than expected frequency of narrow marshes for an extended duration.
Comparison of the values for OWF, BSF, and RSLRR associated with the occurrence of
marshes in the range of widths representing each alternate state (0-67m, 150-450m, and 1775-2000m, for the empty basin, narrow marsh, and filled basin states, respectively) allows me to constrain the conditions that lead to each potential stable state, (Figure 9). BSF is strongly negatively correlated with the occurrence of empty basins (R2 = 0.96) and marshes in the narrow width range (R2 = 0.84), and it is strongly positively correlated with the occurrence of basins filled with marsh (R2 = 0.95) (Figure 9A). Relationships with RSLRR are opposite those of BSF (Figure 9B): RSLRR is positively correlated with the occurrence of empty basins (R2 = 0.96) and narrow marshes (R2 = 0.72), and negatively correlated with filled basins (R2 = 0.98). OWF does
22
important factors in maintaining filled and empty basins, while OWF appears to play a more
important role in the occurrence of narrow marshes, suggesting that there is a connection between the resiliency of narrow marshes and the supply of overwash sediment.
23
given site, having uniform environmental conditions for each of the important parameters but variations in initial marsh widths, multiple marsh widths may be stable.
3.1.2 Comparison of Experimentally-derived Marsh Widths to Observations from Remote Sensing
As discussed above, results from model simulations suggest the existence of three long lasting alternate states in backbarrier marsh width relative to basin size: empty basins (marsh width = 0m), basins partially filled by marshes of narrow width (marsh width = 150 – 450 m), and basins that are completely filled by marsh (marsh width = basin width). This leads to a testable prediction that there are more backbarrier marshes occurring in these ranges of widths than in others, and that a higher frequency signal in each of these ranges should be observable in a dataset of the frequency distribution of backbarrier marsh width. To test this prediction, I use satellite imagery to measure the width of backbarrier marshes along the extent of the barrier islands in the VCR, which experiences a uniform relative sea level rise, but variable fine-grained sediment supply, overwash fluxes, back-barrier basin width, and historical back-barrier marsh width, which could lead to the existence of multiple stable or transient states within this one geographic location (e.g., Figure 10D).
To make marsh width measurements I obtained ASTER satellite imagery from the USGS (2010) and selected images acquired via satellite at mid-day during low tide and the peak
growing season, to maximize the visibility of the vegetated marsh platform [Hinkle and Mitsch, 2005]. I classified marsh on the basis of threshold values for the Normalized Difference
24
point can be either an open water bay or the mainland, in the case of a backbarrier basin that is completely filled with marsh, but I measured across all tidal channels, which are included in the backbarrier marsh measurement. I collected measurements of backbarrier marsh width at 15m increments alongshore, excluding areas within 1,000m of an inlet, to avoid the inclusion of flood tidal deltas.
25
not random, but rather associated with some process that produces more marshes in that range of widths than in others.
To determine if the peak in marshes of narrow width observed in satellite imagery is associated with overwash, as is the case in model results, I compare the measured backbarrier marsh widths to measurements of dune height along the VCR from Oster (2012). Here, I am using dune height as a proxy for the frequency and volume of overwash deposition based on the idea that islands having lower foredunes are at the same time more prone to overwash, and likely low due to recent destruction by recent overwash events. Thus, I predict that there will be a higher frequency of backbarrier marshes in the narrow width range (150-700m) associated with islands having lower dunes than on average.
Dune height measurements were extracted from LiDAR data collected in 1998, 2005 and 2009 by and processed by Oster (2012) to identify the position and elevation (averaged for all three years) of the most seaward dune crest (known as DHigh). In the absence of a dune crest
above 1.5m, the beach berm was selected as DHigh. I average all DHigh measurements from each
dataset that fall within 50m of the perpendicular transect used for a given marsh width
measurement, such that each marsh width measurement has an associated average DHigh value
(Figure 13). The resultant DHigh values are binned into one meter bins, to compare the
backbarrier marsh widths between transects of different DHigh values. Within each bin, I
calculate the probability that a narrow marsh occurs along a transect within the DHigh bin by
dividing the total count of narrow marshes within the bin by the total number of transects within the bin. As the portion of marshes in that range of DHigh values that fall into the narrow width
26
I plot the probability of narrow marsh width occurring in a given bin versus the 1m bins for DHigh, and fit a linear regression to the trend, which shows negative correlation between DHigh
and the occurrence of narrow marshes, with a weak correlation (R2 = 0.53) that is statistically insignificant at a 95% confidence interval (Figure 14). This does not support the hypothesis that narrow marshes are more likely to occur behind islands with low dunes (which I address further in section 4.2). Overall, the average of all DHigh measurements across the VCR is 2.0m, while
the average DHigh along transects perpendicular to narrow backbarrier marshes is 2.2m, which
suggests that dunes in front of marshes in the narrow width range are slightly higher than elsewhere in the VCR.
3.2 Impact of Backbarrier Environment on Long-Term Island Migration Rates
In addition to investigating the impact of island migration on back barrier marsh
morphology, I explore the effect of differences in back barrier environment on island migration rates. To accomplish this, I conduct a set of experiments to assess how long-term island
migration rate changes across barrier-marsh systems having different marsh widths and sediment characteristics (i.e., sand content and erodibility). Each simulation runs for a total of 1000-yr and SLRR is set to 4 mm/yr, to represent moderate projections of sea level rise for the coming century [e.g., IPCC, 2007].
27
sources, ranging from a marsh-filled basin maintained almost exclusively by fine-grained sediment input from bay sediment flux (BSF = 16 m3/yr ; OWF = 0.5 m3/yr) to an empty basin
having a large contribution from overwash volume and relatively little from BSF (BSF = 4 m3/yr ; OWF = 2 m3/yr), and intermediate cases having moderate contributions from both OWF and BSF
(Table 3). Varying sediment inputs to the marsh in this way leads to the development of marsh layers (as marsh accumulates throughout each run) that vary in their sand content (ranging from muddy to sandy) across the simulations. I also run each pairing of marsh width and sediment source with different erodibilities for the marsh stratigraphic unit (0.01, 0.1, 0.5 and 1) (Table 2).
Model results show that island migration rates are highest for islands backed by empty basins, and lowest for islands backed by basins filled with marsh (Figure 15). Island migration rate also increases as the sand content of the marsh increases, because the increase in sand
content is a result of an increase in OWF, which ultimately reduces the sand supply budget for the
island and thus increases the rate of shoreface erosion. Overall, marsh width plays a more dominant role in controlling island migration rate than the sand content of the backbarrier environment. This is quantified in the relationship between island migration rate and the parameters for BSF and OWF, as the island migration over the course of the experiment is
reduced by 35m with the addition of 1 m3/yr of BSF (holding all other variables constant), compared to a net increase in island migration of 2m over the 1,000 year simulation with the addition of 1 m3/yr of OWF (Table 3). The erodibility of the marsh stratigraphic unit in the
model displays little to no effect on island migration rate.
28
to an island backed by an empty/muddy basin to show the relative importance of backbarrier sand content (Figure 16). Initially, the barrier island backed by an empty muddy basin
transgresses more slowly than the island backed by a narrow marsh, likely because the OWF is
four times higher than for the island with a narrow marsh, which means increased shoreface erosion to liberate sand for overwash (Table 3). However, after approximately 500 years, the island having a narrow marsh erodes into the shoreface sufficiently to expose the underlying sandy marsh stratigraphic layer, and following this, the island migration rate decreases due to the increase in sand availability to the island. The reduction in island migration rate is sufficient that the island backed by the muddy empty basin actually “passes” the marsh-backed island, and ends with a higher average migration rate, despite the lower OWF for the island backed by an empty
basin.
4. Discussion
4.1 Model Limitations
29
same alternate states will be identified in model results when wave erosion is included—a conjecture that is supported by measurements of marsh width from satellite imagery in section 3.1.1—the range of conditions leading to them may slightly differ from the range of conditions identified in this work. This new model serves as an improved tool for studying backbarrier marshes that receive an important supply of sediment from overwash. For marshes that do not receive sediments from overwash deposition (i.e. marshes attached to the mainland), the Mariotti and Fagherazzi model is a more accurate representation [2010].
GEOMBEST+ operates in 2-dimensions (cross-shore), and is therefore unable to address alongshore heterogeneities such as variations in overwash deposition, which tends to occur preferentially in areas where dunes are lower. This can be especially important in areas where ecomorphodynamic feedbacks may cause low areas to remain low longer, thereby increasing alongshore heterogeneity in susceptibility to future overwash events [Wolner et al., 2013]. To account for the lack of a third dimension, I vary model parameters such that the differences that might occur alongshore occur, instead, between model runs. For example, results suggest that, all other factors being equal, an island receiving a larger volume of overwash deposition, when compared to an island receiving a lower volume of overwash deposition, is more likely to have a narrow fringing marsh. Such variations in marsh width among model simulations are
representative of observed alongshore heterogeneity in marsh width. However, it is possible that the timescales of dune elevation [Duran and Moore, 2013] change are fast enough to mute any relationship that might exist between alongshore dune height variability and alongshore marsh width.
30
position in the water column and soil properties, I assume that the marsh, if provided with sufficient sediment to accrete and keep pace with relative sea level rise (RSLR), will be healthy enough to do so and continue to contribute the ecological benefits that aid in vertical accretion. Marshes are resilient over long time scales, tending to maintain an equilibrium elevation relative to sea level as sea level rises [Kirwan and Murray, 2007; Morris et al., 2002], but recent studies have demonstrated that disturbance events can disrupt this equilibrium, leading to a collapse of the marsh ecosystem [Kirwan and Murray, 2008]. Ultimately, we need more data (which can then be used to develop model parameterizations) to quantify the impact of overwash deposition and soil type on overall marsh productivity, especially in terms of organic deposition.
GEOMBEST+ captures the impact of depositional events that take the marsh out of its preferred elevation range, because marsh will only grow in the model below the high water line. However, the relationship between depth and the rate of marsh growth is not described in the current version of the model. As a result, within the model, the marsh accretes at a rate that depends only on the supply of sediment (sand and fine-grained), and accretion rate does not increase as the depth below high tide increases as it should, based on findings of e.g. Kirwan et al. [2010] and Morris et al. [2002]. This feedback would serve to extend the range of conditions
31 4.2 Impact of Overwash on Backbarrier Marshes
The higher frequency of narrow-width marshes in simulation results suggests that this is a long lasting alternate condition where the marshes more frequently reside (such that marshes of this width can maintain their width under a range of conditions), but also a transient state, which marsh platforms pass through as they expand or contract across the spectrum from empty basin to marsh-filled basin. This idea is supported by observations from satellite images, from which I identify a statistically significant peak in marsh width at ~425m (Figure 12), which is predicted to be on this order of magnitude by the model derived peak at ~325m (Figure 7). The exact position of the peak in model results is a function of the formulation for overwash deposition in the model, which may be underestimating extent and volume of overwash deposition. Future model experiments that better constrain overwash processes using data from overwash surveys would represent the relationship between overwash and backbarrier marshes more accurately.
The occurrence of marshes in the narrow peak range in model experiments is positively correlated with the parameter for overwash volume, and negatively correlated with RSLRR and BSF (Figure 9). This suggests that overwash plays a critical role facilitating marshes to “keep
pace” with island migration, without outpacing it, across a range of conditions. Overwash appears to provide narrow marshes with a valuable source of sediment to help them keep pace with sea level rise. Because overwash deposition is limited in extent to the backbarrier region, marshes that have insufficient supply of fine-grained sediment to prograde beyond the “overwash zone” of the island will tend to be narrow. Once the marsh-bay boundary of a narrowing marsh enters the overwash zone, overwash deposition will slow the rate at which the marsh boundary erodes. However, model results suggest that these marshes will continue to narrow and
32
suggest that a stable state between the empty and filled marsh basins does not exist but that marshes, instead, are constantly adjusting by narrowing or widening [Mariotti and Fagherazzi, 2010]. Adding to the findings of Mariotti and Fagherazzi [2010] model results from
GEOMBEST+ suggest that a narrow marsh alternate state can occur in a higher than expected frequency in either conditions of progradation or erosion during the transition from one steady state to another, provided that a source of sediment from overwash is present.
I cannot conclude from these experiments that narrow marshes are definitively unstable, though they behave as such in the model. It is likely that marshes that are narrowing from an initially filled basin will not be stabilized by overwash, and that conditions will continue to erode the marsh until it disappears, as this occurs in model experiments, with the narrow marshes ultimately disappearing after an additional meter of sea level rise (Figure 8). However, in the case of marshes that prograde from an initially empty basin, it is possible that the addition of wave erosion, or changing boundary conditions such that resuspended sediment can be exported from the basin, could lead to a stabilization of the marsh boundary.
33
marshes are stable. Because the islands of the VCR are generally low-lying and transgressive (and thus experience relatively high fluxes of overwash) the existence of a narrow marsh transient state is not surprising and suggests that marsh-filled basins may have been prevalent here in the past, either due to lower RSLRR’s or higher fine-grained sediment supply, or some combination of the two, and are in the process of transitioning to an empty basin stable state. Charleston Sound in South Carolina serves as such environmental conditions, with high rates of inorganic fine-grained sediment supply that supports marsh-filled basins even under high RSLRR’s [Mariotti and Fagherazzi, 2013].
It is important to recognize that in addition to OWF, BSF, and RSLRR the proportion of
34
width, as suggested by two runs which result in the same marsh progradation rate, but different island transgression rates (Figure 17). In the case of more rapid island transgression, the marsh is narrower, because the island rolls over and destroys the trailing edge of the marsh, consistent with observations made from aerial photographs by Kastler and Wiberg [1996].
Overwash likely has additional impacts on backbarrier marshes that could play a critical role in the coupling of backbarrier marshes to barrier islands, beyond the direct contribution of sand-sized sediment to the platform. In the model, overwash deposition always occurs as a layer on top of the backbarrier marsh platform or bay floor. However, field observations and
stratigraphic studies of overwash fans have shown that in some cases, overwash actually scours pre-existing sedimentary layers before depositing sand on top, and in some cases causes net erosion. [e.g., Fisher et al., 1974; Wang and Horwitz, 2007]. Ultimately, the pattern of erosion and accretion caused by overwash processes varies as a function of the morphodynamic
characteristics of the backbarrier environment, including both the shape and roughness of the marsh platform and associated bay. Further, scouring and burial by overwash have the potential to destabilize the marsh platform by removing and smothering marsh vegetation [Kirwan and Murray, 2008; Temmerman et al., 2012]. A better understanding of the ecological impact of
overwash and the range of conditions under which overwash serves as a significant source of disturbance to marsh vegetation, would allow these effects to be incorporated into future iterations of the coupled island-marsh model.
4.3 Impact of Marsh Morphology and Sedimentology on Island Migration
35
broad implications for our understanding of how barrier island transgression varies alongshore. Marsh-backed islands appear less vulnerable to rising sea level than bay-backed islands, because they are able to maintain a more offshore position without a significant contribution of sand from alongshore transport or the shoreface.
Turning to the VCR for examples, the reduction in vulnerability of marsh-backed islands may explain the lower migration rate of the marsh-backed northern half of Metompkin Island relative to the bay-backed southern half [Byrnes, 1988], as well as the persistence of the southern islands in the VCR, which are low-lying, backed by marsh-filled basins and sediment-starved [Demarest and Leatherman, 1985], but have not yet transitioned into the “runaway
transgression” phase [FitzGerald et al., 2006]. In contrast, the Chandeleur Islands in Louisiana serve as a good example of bay-backed islands, and have been rapidly migrating landward [Fearnley et al., 2009] since marsh progradation ceased 120 years ago [Mcbride et al., 1991; Moore et al., in review] and especially during the last several years since Hurricanes Katrina and
Rita [e.g., Sallenger et al., 2009]. This may be largely due to the lack of marsh platform behind the islands to slow their migration landward. In addition to whether an island is simply backed by a marsh or an bay, the depth of the bay behind an island has a significant impact on the rate of transgression, as islands backed by deeper estuaries have a greater accommodation space to fill [Oertel and Kearney, 1989]. This could be another reason for the state of the Chandeleur Islands, which front the Chandeleur Sound, which at an average depth of ~3m is considerably deeper than the shallow coastal bays in the VCR, for which the majority of the total basin area is less than 2m deep [Oertel, 2001].
36
migration rate due to the associated removal of sand from the shoreface. In the conventional view, overwash is associated with an increase in the rate of island transgression, as the erosion of sand from the shoreface and deposition in the backbarrier results in a net landward migration of the island [e.g., Moore et al., 2010; Stolper et al., 2005]. However, the model results presented here indicate that in some scenarios, an increase in overwash can actually help the island to slow its rate of transgression, specifically if the increase in overwash deposition leads to the
maintenance of a narrow marsh (Figure 16), which can reduce the accommodation space behind the island, while also storing overwash sand in the substrate such that it remains in the island’s sand budget. In this way, there is likely a temporary symbiotic feedback between transgressive barrier islands and narrow sandy marshes, whereby the reduction in accommodation space by the marsh helps the island keep pace with sea level and the contribution of overwash sediment from the island helps the marsh to keep pace with sea level.
5. Conclusions
Here, we develop GEOMBEST+—the first model to simulate the coupled evolution of barrier islands and backbarrier marshes—and apply it to investigate the complexities of island-marsh co-evolution. Results from model experiments show that overwash deposition is
important in the maintenance of transient narrow marsh platforms, under conditions of low fine-grained sediment supply and high relative sea level rise rates in which they otherwise would not occur. This conclusion is supported by observations of marsh width from satellite imagery, which reveal a peak in the frequency of marshes in this narrow width range.
Model experiments of long-term barrier island migration show that islands backed by marsh platforms transgress more slowly because the presence of a marsh reduces
37
38 Figures and Tables
39
Figure 2. (A) Cross-shore schematization of coastal morphology for a low-gradient barrier island coast. GEOMBEST’s three functional realms (shoreface, barrier, and backbarrier bay) and distinct stratigraphic units (barrier island sand, bay sediment, and underlying strata) that
40
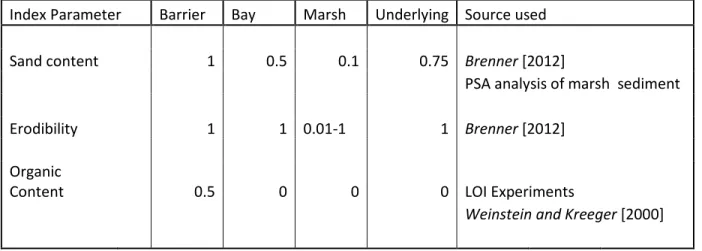
Table 1. Index parameters for stratigraphic units used in GEOMBEST+ experiments. Marsh erodibility was varied from 0.01-1 for the impact of backbarrier environment on long-term island migration experiments.
Index Parameter Barrier Bay Marsh Underlying Source used
Sand content 1 0.5 0.1 0.75 Brenner [2012]
PSA analysis of marsh sediment
Erodibility 1 1 0.01-1 1 Brenner [2012]
Organic
Content 0.5 0 0 0 LOI Experiments
Weinstein and Kreeger [2000]
41
42
43
Table 2. Parameterization for experiments to test impact of barrier and backbarrier processes impact on marsh width.
Parameter Range of Values Tested Source used
BSF 2 - 20 m3/yr, in increments of 2 Schwimmer, [2001]
RSLRR 1 - 10 mm/yr, in increments of 1 IPCC, [2007]
OWF 0.2 - 2 m3/yr, in increments of 2 Fisher et al. [1974]
Leatherman [1987]
T0 0.01 – 0.10 m/yr, in increments of 1 Leatherman and Williams [1977]
Emax 10 cm/yr n/a
DR 0.4 m n/a
44
Figure 5. (A) Profile of initial morphology, showing active barrier sand in yellow, bay sediment in grey, and the underlying substrate in dark yellow. (B) Resultant morphology from a Bay Sediment Flux of 20 m3/yr and a RSLRR of 0 mm/yr, with marsh peat in brown. Ghost traces of marsh boundaries are plotted every 10 years.
45
Figure 6. (A) Marsh progradation as a function of the rate of sea-level rise (RSLRR) for a range of suspended sediment concentrations (Css), from Mariotti and Fagherazzi (2010), compared to
46
Figure 7. (A) Frequency distribution of marsh widths from marsh width experiments. Dashed lines indicate initial widths. (B) Gray bars indicate the range of widths where peaks in frequency occur that are associated with basins completely filled with marsh (> 1775m), and completely empty of marsh (< 60m) based on the maximum deviation of the cumulative distribution function from the standard uniform distribution. (C) Frequency distribution for those
47
48
Figure 9. Relationship of parameters for bay sediment flux (A), rate of sea level rise (B),
49
Figure 10. Phase diagram showing how marsh width changes within the range of parameter space for the initial condition of an empty basin (A), a narrow marsh (B) and a marsh-filled basin (C). BA is the Basin Accretion rate, determined by dividing the BSF by the width of the
50
51
52
Figure 13. Map of marsh width and DHigh measurements along the VCR. Marsh widths are
plotted as lines extending from the island to the backbarrier extent of the marsh. Widths are color-coded according to the potentially stable widths, and DHigh measurements are color-coded
53
54
Table 3. OWF and BSF parameter values used to set marsh width for long-term island migration
experiments, and resultant island migration rates.
Backbarrier Parameters Marsh Width Island Migration Sediment Content OW(m3/yr) F BSF (m3/yr) Average (m) Alternate state Rate (m/yr)
Muddy 0.5 5 0 1.8
Mixed 1 5 0 Empty 1.8
Sandy 2 5 0 Basin 1.9
Muddy 0.5 8.5 129 1.3
Mixed 1 7.5 158 Intermediate 1.4
Sandy 2 7 171 Marsh 1.4
Muddy 0.5 16 4279 1.2
Mixed 1 16 4224 Filled 1.3
Sandy 2 16 4157 Basin 1.4
55
Figure 16. Plot of shoreline position through time for 4-m sea level transgression of two barrier islands with different backbarrier environments. One has a sandy narrow marsh (BSF = 8 m3/yr ; OWF = 2 m3/yr), and the other is backed by an empty basin, with a muddy lagoon (BSF = 4 m3/yr
; OWF = 5 m3/yr). The average rate of migration for the island with a narrow marsh is 1.5 m/yr,
56
57
REFERENCES
Bender, M.A., T.R. Knutson, R.E. Tuleya, J.J. Sirutis, G.A. Vecchi, S.T. Garner, and I.M. Held (2010), Modeled impact of anthropogenic warming on the frequency of intense Atlantic
hurricanes., Science (New York, N.Y.), 327, 454–458.
Brenner, O.T. (2012), The Complex Influences of Backbarrier Deposition, Substrate Slope and Underlying Stratigraphy in Barrier Island Response to Sea Level Rise: Insights from the Virginia Barrier Islands, Mid-Atlantic Bight, U.S.A. University of Virginia.
Bruun, P. (1988), The Bruun rule of erosion by sea-level rise: a discussion on large-scale two-and three-dimensional usages, Journal of Coastal Research, 4, 627–648.
Byrnes, M.R. (1988), Holocene geology and migration of a low-profile barrier island system, Metompkin Island, Virginia. Old Dominion University.
Chmura, G., and G. Hung (2004), Controls on salt marsh accretion: A test in salt marshes of Eastern Canada, Estuaries, 27, 70–81.
Costanza, R., R. Arge, R. De Groot, S. Farberk, M. Grasso, B. Hannon, K. Limburg, S. Naeem, R.V.O. Neill, J. Paruelo, R.G. Raskin, and P. Suttonkk (1997), The value of the world ’ s ecosystem services and natural capital, Nature, 387, 253–260.
Demarest, J., and S. Leatherman (1985), Mainland influence on coastal transgression: Delmarva Peninsula, Marine Geology, 63, 19–33.
Duran, O., and L.J. Moore (2013), Vegetation controls on the maximum size of coastal dunes, Proceedings of the National Academy of Sciences,.
Emanuel, K. (2005), Increasing destructiveness of tropical cyclones over the past 30 years., Nature, 436, 686–688.
Fagherazzi, S., and P.L. Wiberg (2009), Importance of wind conditions, fetch, and water levels on wave-generated shear stresses in shallow intertidal basins, Journal of Geophysical Research, 114, 1–12.
Fagherazzi, S., L. Carniello, L. D’Alpaos, and A. Defina (2006), Critical bifurcation of shallow microtidal landforms in tidal flats and salt marshes., Proceedings of the National Academy of Sciences of the United States of America, 103, 8337–8341.
Fearnley, S.M., M.D. Miner, M. Kulp, C. Bohling, and S. Penland (2009), Hurricane impact and recovery shoreline change analysis of the Chandeleur Islands, Louisiana, USA: 1855 to 2005, Geo-Marine Letters, 29, 455–466.
58
FitzGerald, D., I. Buynevich, and B. Argow (2006), Model of tidal inlet and barrier island dynamics in a regime of accelerated sea level rise, Journal of Coastal Research, II, 789–795. French, J.R. (1993), Numerical simulation of vertical marsh growth and adjustment to
accelerated sea-level rise, North Norfolk, U.K., Earth Surface Processes and Landforms, 18, 63– 81.
Hinkle, R.L., and W.J. Mitsch (2005), Salt marsh vegetation recovery at salt hay farm wetland restoration sites on Delaware Bay, Ecological Engineering, 25, 240–251.
Kastler, J.A., and P.L. Wiberg (1996), Sedimentation and Boundary Changes of Virginia Salt Marshes, Estuarine, Coastal and Shelf Science, 42, 683–700.
Kirwan, M., and A. Murray (2007), A coupled geomorphic and ecological model of tidal marsh evolution, Proceedings of the National Academy of Sciences of the United States of America, 104.
Kirwan, M., and A. Murray (2008), Temporary vegetation disturbance as an explanation for permanent loss of tidal wetlands, Geophysical Research, 35, 1–5.
Kirwan, M.L., G.R. Guntenspergen, A. D’Alpaos, J.T. Morris, S.M. Mudd, and S. Temmerman (2010), Limits on the adaptability of coastal marshes to rising sea level, Geophysical Research Letters, 37, 1–5.
Kirwan, M.L., a. B. Murray, J.P. Donnelly, and D.R. Corbett (2011), Rapid wetland expansion during European settlement and its implication for marsh survival under modern sediment delivery rates, Geology, 39, 507–510.
Knutson, T.R., J.L. McBride, J. Chan, K. Emanuel, G. Holland, C. Landsea, I. Held, J.P. Kossin, a. K. Srivastava, and M. Sugi (2010), Tropical cyclones and climate change, Nature Geoscience, 3, 157–163.
Komar, P.D., and J.C. Allan (2008), Increasing Hurricane-Generated Wave Heights along the U.S. East Coast and Their Climate Controls, Journal of Coastal Research, 242, 479–488.
Larson, M. (1991), Equilibrium profile of a beach with varying grain size. In Coastal Sediments, (ASCE), pp. 905–919.
Leatherman, S. (1987), Overwash and aeolian processes on a US northeast coast barrier, Sedimentary Geology, 52, 183–206.
Leatherman, S., and A. Williams (1977), Overwash sedimentation associated with a large-scale northeaster, Marine Geology, 24.