ENERGY AVAILABILITY: PREVALENCE AND IMPACT ON ENDOCRINE STATUS AND BONE HEALTH IN MALE ENDURANCE TRAINED ATHLETES
Amy R. Lane
A dissertation submitted to the faculty at the University of North Carolina at Chapel Hill in partial fulfillment of the requirements for the degree of Doctor of Philosophy in the
Curriculum of Human Movement Science in the School of Medicine.
Chapel Hill 2019
Approved by:
Anthony C. Hackney Kristen L. Kucera Kristin S. Ondrak
ii © 2019 Amy R. Lane
iii ABSTRACT
Amy R. Lane: Energy Availability: Prevalence and Impact on Endocrine Status and Bone Health in Male Endurance Trained Athletes
(Under the direction of Anthony C. Hackney)
Introduction: Relative Energy Deficiency in Sport (RED-S) is based on the assumption that low energy availability (EA) is responsible for deficiencies in multiple physiologic systems. The Exercise-Hypogonadal Male Condition (EHMC) shares similar
symptomology with RED-S, including diminished sex steroid hormone levels and
decreased bone mineral density (BMD), but whether EA plays a causative role and how prevalent low EA is in male athletes are unclear. Studies have provided evidence that EHMC and RED-S are more likely to develop in endurance athletes performing high volumes of training, but a definitive cause remains unknown. Therefore, it is important to conduct an investigation into prevalence and the potential cascade of events in male endurance trained athletes (META) with respect to EA. Purpose: A two-phase research project investigated prevalence of low EA (study 1) and possible associations between EA and risk factors for RED-S – EHMC (study 2) in META. Methods: Study 1
iv
47.2% (n=51) as At Risk (<30 kcal/kg lean body mass [LBM), 33.3% (n=36) as
Moderate Risk (30-45 kcal/kg LBM) and 19.4% (n=21) as No Risk (≥45 kcal/kg LBM) for low EA. EA was significantly associated with BMD (p=0.005, r=-0.360) and RMR
(p=0.006, r=-0.349). There was no significant association with EA and history of stress fracture (p>0.33) or between EA and any hormonal or blood bone bio-markers
(p>0.150). Conclusions: Major findings were the high prevalence of low EA, and weak, negative associations between EA and both RMR and BMD with no association
v
TABLE OF CONTENTS
TABLE OF CONTENTS ... v
LIST OF TABLES ... viii
LIST OF FIGURES... ix
LIST OF ABBREVIATIONS ... x
CHAPTER 1: INTRODUCTION ... 1
AIM 1 (Manuscript 1)... 4
AIM 2 (Manuscript 2)... 4
CHAPTER 2: REVIEW OF LITERATURE ... 6
INTRODUCTION ... 6
LOW ENERGY AVAILABILITY ... 7
THE FEMALE ATHLETE TRIAD ... 8
EXERCISE-HYPOGONADAL MALE CONDITION ... 11
RELATIVE ENERGY DEFICIENCY IN SPORT, PREVELANCE AND RISK FACTORS ... 12
RED-S Prevalence in Male Athletes ... 14
Endocrine Function ... 15
Bone Health Status ... 19
Resting Metabolic Rate ... 21
vi
Endurance Training and Low Energy Availability: Endocrine Function ... 21
Endurance Training and Low Energy Availability: Bone Health Status ... 27
Resting Metabolic Rate ... 29
CHAPTER 3: EXPERIMENTAL DESIGN AND METHODS ... 33
Overview of Aims ... 33
AIM 1 ... 33
Participants Aim 1 ... 33
Study Procedures: Aim 1 ... 34
Low Energy Availability Risk Calculation ... 35
AIM 2 ... 37
Participants ... 37
Study Design ... 37
Study Procedures ... 37
Statistical Analyses ... 43
CHAPTER 4: RESULTS ... 45
Specific Aim 1 ... 45
Specific Aim 2 ... 49
CHAPTER 5: MANUSCRIPT 1 ... 52
OVERVIEW ... 52
INTRODUCTION ... 53
METHODS ... 56
RESULTS ... 60
vii
CHAPTER 6: MANUSCRIPT 2 ... 70
OVERVIEW ... 70
INTRODUCTION ... 71
METHODS ... 74
RESULTS ... 81
DISCUSSION ... 84
APPENDIX A: ENERGY AVAILABILITY QUESTIONNAIRE ... 93
APPENDIX B: INTRODUCTORY EMAIL– AIM 1 ... 113
APPENDIX C: MEDICAL HEALTH HISTORY QUESTIONNAIRE ... 114
APPENDIX D: ENERGY AVAILABILITY DIET AND FRACTURE HISTORY ... 118
APPENDIX E: RECOVERY STRESS QUESTIONNAIRE FOR ATHLETES ... 119
APPENDIX F: PITTSBURGH SLEEP QUALITY INDEX ... 127
APPENDIX G: DIETARY RECORD FORM ... 128
APPENDIX H: TRAINING RECORD FORM ... 131
APPENDIX I: DATA SUMMARY TABLE ... 132
viii
LIST OF TABLES
Table 1. Studies demonstrating the decrements in endocrine function, bone
health and LEA ... 9
Table 2. Study procedures for Aim 2 ... 38
Table 3. Dependent variables for EA status indication ... 44
Table 4. Energy availability calculation variables and components (n=108) ... 61
Table 5. Summary of characteristics by energy availability risk classification status ... 62
Table 6. Duration of missed training due to injury in the last 12 months by EA risk status (n=33) ... 63
Table 7. Nutritional supplements consumed by participants (n=47) ... 63
Table 8. Participant characteristics (n=60) ... 81
Table 9. Energy availability and components (n=60) ... 82
Table 10. Reproductive and metabolic hormonal measures (n=60) ... 82
ix
LIST OF FIGURES
Figure 1. Potential reproductive dysfunction mechanism ... 1
Figure 2. Triad spectrum model ... 8
Figure 3. Health consequences of RED-S, expanded from the Triad ... 13
Figure 4. Steroid hormone synthesis ... 16
Figure 5. Physiological effects of growth hormone ... 19
Figure 6. Aim 1 study design ... 34
Figure 7. Study design diagram ... 37
Figure 8. Potential systemic and physiologic systems impacted by low EA associated with the RED-S terminology ... 55
Figure 9. Energy availability for total participants and by risk status group ... 61
Figure 10. Total body BMD (Z-score) and EA association ... 83
x
LIST OF ABBREVIATIONS BAP – Bone alkaline phosphatase
BMD – Bone mineral density
DXA – Dual energy X-ray absorptiometry EA – Energy Availability
ECG – Electrocardiogram EI – Energy Intake
EEE – Exercise energy expenditure
EHMC – Exercise-hypogonadal male condition GH – Growth hormone
Kcal – kilocalories Kg - kilogram
LEA – Low Energy Availability
RED-S – Relative energy deficiency in sport RMR – Resting metabolic rate
RMRratio – Resting metabolic ratio T4 – Thyroxine
T3 – Triiodothyronine
VO2 – volume of oxygen uptake
1
CHAPTER 1: INTRODUCTION
The Female Athlete Triad (Triad) was first formally identified in 1997, as a women’s issue consisting of three major components: eating disorders, amenorrhea and osteoporosis. Since the initial position statement was released by the International Olympic Medical Commission in 1997, much research has been conducted and while the components were originally considered inter-related, evidence has suggested a causal link primarily to low energy availability (LEA)1. Figure 1 is a depiction of the potential Triad pathway mechanism leading to reproductive dysfunction.
As insufficient energy is consumed to maintain regular and necessary body functions as well as exercise training, the deficiency in fuel disrupts the
2
been conducted in female athletes regarding the Triad, appropriate levels of energy consumption have been identified to optimize performance and minimize health risk. A female athlete is considered at risk when consuming 30 or fewer kcal per kg of lean mass a day, and is thought to be safe with a consumption of 45 or more kcal per kg of lean mass2. This information provided a platform from which screening procedures have been created and implemented to identify at risk persons and diagnose affected
individuals to minimize performance decrements and improve recovery time. However, this work has been exclusively limited to female athletes thus far. With no male-specific recommendations for energy availability limits for risk in existence, using those identified for females is a reasonable starting point.
In 2014 a consensus statement released by the International Olympic Committee introduced a larger overarching diagnosis encompassing the Triad, and also including male athlete related conditions, the term Relative Energy Deficiency in Sport (RED-S) was proposed3. Unlike in females, there is no visible external que of a problem
developing (i.e., loss of the menstrual cycle in females) in males that can rapidly provide an insight into the development of reproductive dysfunction. However, endurance
trained males have been shown to have higher incidence of stress fracture, disordered eating and the potential for developing the exercise-hypogonadal male condition
(EHMC)4. Endurance athletes are considered at greater risk due to the high volume of training performed. De Souza et al.119 identified a threshold volume of 8-10 hours per week resulted in reproductive dysfunction in male endurance runners.
3
unknown5-8. Several research studies have explored dietary contributions and training as a potential contributing factor within male athletes, but the results have been
conflicting or ambivalent thus far9-12. These studies seem limited due to design approaches and, or small sample sizes. Only Koehler et al.136 has investigated the specific effects of low EA on select metabolic and reproductive hormones in male athletes. After four days at a low EA (15 kcal/kg fat free mass [FFM]) participants demonstrated reduced resting levels of leptin and insulin, but no changes in ghrelin, triiodothyronine, IGF-1 or testosterone136. While the response was not as
comprehensive as in females, it indicates hormonal alterations with low EA in men can occur. Perhaps a more chronic state is necessary for a broader response from the endocrine system.
The paltry and inconsistent findings in men leave the issues of prevalence unknown, as well as the potential effects on some aspects of the endocrine system (as well as metabolic markers, bone health, etc.), and whether there is subsequent
interference with performance. In addition, it is unknown if there is a spectrum or threshold for disorder development in men similar to what is seen in females. Hence, there are many unanswered questions concerning LEA, RED-S, EHMC and male athletes.
Through identification of hormonal alterations due to LEA, prevention of
4
investigation into the potential cascade of events in male endurance trained athletes from LEA be conducted.
AIM 1 (Manuscript 1)
To examine the prevalence of LEA in a sample of competitive, recreationally trained male endurance athletes176. To accomplish this aim a comprehensive online survey will be compiled. Recruitment of subjects will be through distribution of the study web link with description to upper level endurance sport organizations (e.g., U.S.
Cycling, U.S Track and Field clubs) for completion by their membership. The descriptive survey will have distinct sections to gather demographic information for individuals along with approximations of energy intake (EI) and exercise energy expenditure (EEE, see #3, Mountjoy et al. for details). Total energy availability (EA; kcal per kg lean mass a day) will be calculated by subtracting energy expenditure from energy intake (EA = EI – EEE) and dividing by the lean mass for each participant. Learning more about the prevalence of LEA can provide information regarding what type of endurance athletes may be at highest risk, and therefore provide a basis for future research in more specific exercise populations.
AIM 2 (Manuscript 2)
To investigate the possible associations between EA and risk factors for RED-S – EHMC in male endurance athletes an observational, cross sectional design will be implemented. Participants will be competitive, recreationally trained male endurance athletes (i.e., participants in sports such as cycling, marathons, triathlons in which
5
training practices of male endurance athletes across one week of normal training. The collection of dietary intake and exercise energy expenditure combined with laboratory measures of resting metabolic rate, bone mineral density, blood plasma collection and a maximal exercise test will allow for assessments of associations between EA and
6
CHAPTER 2: REVIEW OF LITERATURE INTRODUCTION
The human organism needs a minimum of sufficient energy to meet the demands for all physiological functions within the body. Any additional requirements due to daily function or physical activity require additional energy sources to maintain homeostasis. Endurance athletes participate in high volumes of training and therefore demand substantial energy sources to maintain adequate daily function. It has been identified that low energy availability in female endurance athletes can be detrimental to their endocrine status and bone health. The goal of this project is to investigate if LEA is prevalent among and impacting male endurance athletes with a parallel dysfunction, which could lead to increased risk of RED-S and EHMC.
7 LOW ENERGY AVAILABILITY
Energy availability (EA) is the amount of dietary energy available to meet the needs of exercise energy expenditure (EEE), and is determined as energy intake (EI) minus energy specific for exercise (EA = EI – EEE)113. This should not be confused with the concept of energy balance (EB). EB takes into account total energy expenditure, which in addition to exercise includes, cellular maintenance, thermoregulation, growth, reproduction and immunity113,137. EB referred to the amount of energy stores lost or gained once the body had used all energy necessary to complete all physiological process. EA is delimiting to the cost of energy specific to exercise expenditure. It is recognized that the terms “exercise” and “physical activity” are frequently used interchangeably; but they are not always necessarily the same thing. For this
discussion, exercise is deemed as intentional physical activity conducted with the intent of improving physical fitness and sporting performance.
Loucks and colleagues have identified quantities of EA deemed “healthy” and “low”. An optimal level of energy is dietary energy equal to or greater than 45 kcal per kg of lean mass (LM). However, an individual is deemed at risk with low energy availability (LEA) if their consumption is less than 30 kcal per kg LM15,126. These determinations were made following very well-controlled trials with sedentary females, but it is unclear if they are appropriate for males. Endurance athletes are at a
8
concept has been studied extensively in females, there is some evidence exercising men may also experience LEA5,6,7,46,65,66,121.
THE FEMALE ATHLETE TRIAD
The first formal position statement on the Triad was released by the American College of Sports Medicine in 199722. Originally, it was considered a women’s issue requiring the presence of three major components: an eating disorder, amenorrhea and osteoporosis2. Subsequent research identified two important factors: 1) only one of the three components needed to be present to suggest dysfunction, and 2) LEA, regardless of how it was attained (i.e., reduced dietary intake, increased exercise energy
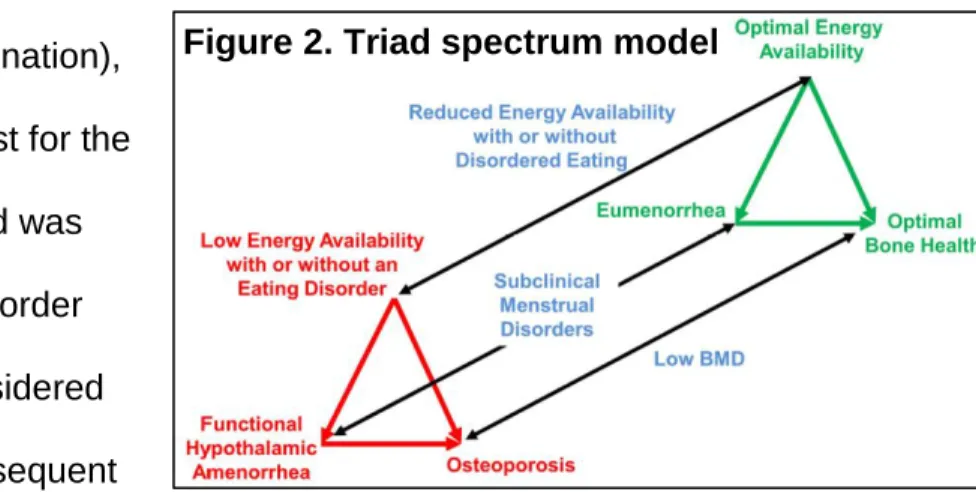
expenditure, or a combination), was a critical protagonist for the Triad. In 2007, the Triad was deemed a spectrum disorder (Figure 2)2. LEA is considered responsible for the subsequent
menstrual cycle disorders and ultimately diminished bone health1,14,15. Numerous research studies have been conducted over the last 30 years with regard to the impact of the Triad. Table 1 illustrates a representative collection of some key research work in this area. LEA was first thought to be induced from eating disorders (ED) or disordered eating (DE). However, energy deficits without ED/DE are possible due to unintentional insufficient EI and/or excessive volume of training without caloric
compensation157,158,159. Amenorrhea is thought to be the result of dysfunction at the hypothalamic-pituitary-ovarian axis. Disruptions in LH pulsatility leading to insufficient
9
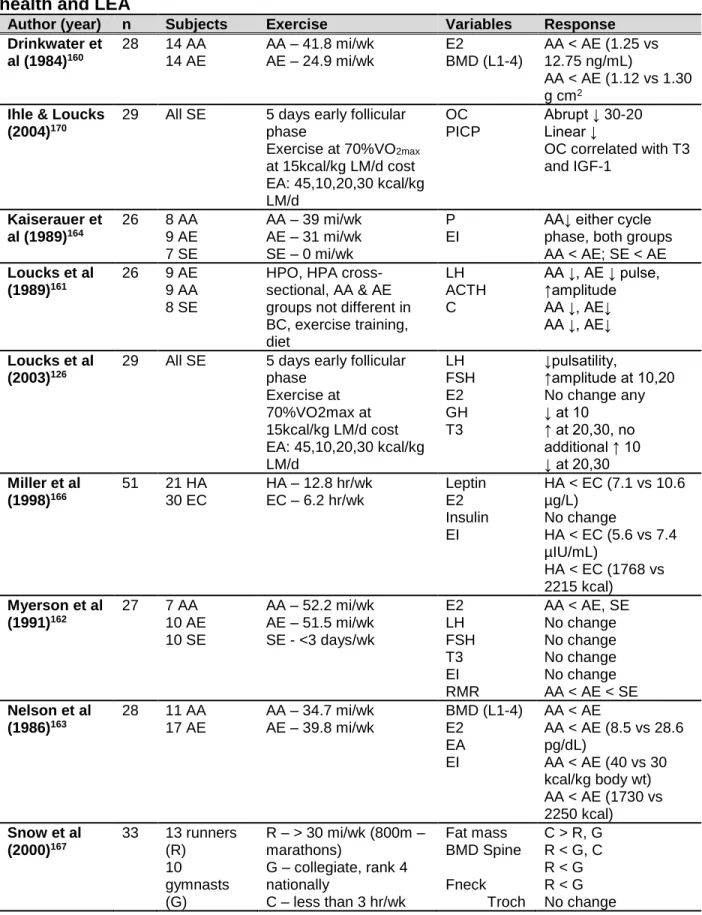
Table 1. Studies demonstrating the decrements in endocrine function, bone health and LEA
Author (year) n Subjects Exercise Variables Response
Drinkwater et al (1984)160
28 14 AA 14 AE
AA – 41.8 mi/wk
AE – 24.9 mi/wk E2 BMD (L1-4)
AA < AE (1.25 vs 12.75 ng/mL)
AA < AE (1.12 vs 1.30 g cm2
Ihle & Loucks (2004)170
29 All SE 5 days early follicular phase
Exercise at 70%VO2max
at 15kcal/kg LM/d cost EA: 45,10,20,30 kcal/kg LM/d
OC PICP
Abrupt ↓ 30-20 Linear ↓
OC correlated with T3 and IGF-1
Kaiserauer et al (1989)164
26 8 AA 9 AE 7 SE
AA – 39 mi/wk AE – 31 mi/wk SE – 0 mi/wk
P EI
AA↓ either cycle phase, both groups AA < AE; SE < AE
Loucks et al (1989)161
26 9 AE 9 AA 8 SE
HPO, HPA cross-sectional, AA & AE groups not different in BC, exercise training, diet
LH ACTH C
AA ↓, AE ↓ pulse, ↑amplitude AA ↓, AE↓ AA ↓, AE↓
Loucks et al (2003)126
29 All SE 5 days early follicular phase
Exercise at 70%VO2max at 15kcal/kg LM/d cost EA: 45,10,20,30 kcal/kg LM/d LH FSH E2 GH T3 ↓pulsatility,
↑amplitude at 10,20 No change any ↓ at 10
↑ at 20,30, no additional ↑ 10 ↓ at 20,30
Miller et al (1998)166
51 21 HA 30 EC
HA – 12.8 hr/wk
EC – 6.2 hr/wk Leptin E2 Insulin EI
HA < EC (7.1 vs 10.6 µg/L)
No change
HA < EC (5.6 vs 7.4 µIU/mL)
HA < EC (1768 vs 2215 kcal)
Myerson et al (1991)162
27 7 AA 10 AE 10 SE
AA – 52.2 mi/wk AE – 51.5 mi/wk SE - <3 days/wk
E2 LH FSH T3 EI RMR
AA < AE, SE No change No change No change No change AA < AE < SE
Nelson et al (1986)163
28 11 AA 17 AE
AA – 34.7 mi/wk
AE – 39.8 mi/wk BMD (L1-4) E2 EA
EI
AA < AE
AA < AE (8.5 vs 28.6 pg/dL)
AA < AE (40 vs 30 kcal/kg body wt) AA < AE (1730 vs 2250 kcal)
Snow et al (2000)167
33 13 runners (R)
10 gymnasts (G)
R – > 30 mi/wk (800m – marathons)
G – collegiate, rank 4 nationally
C – less than 3 hr/wk
Fat mass BMD Spine Fneck Troch
10 10 control (C) Wbody IGF-1
Associated with non-Wbody BMD
Warren et al (1999)165
28 14 AA 14 AE
AA - High int – 444 min/wk
AA – mod int – 1627 min/wk
AE – high int – 174 min/wk
AE – mod int – 1851 min/wk EAT-26 EI EE BMD (spine) LH E2 T3 T4
AA > AE (23.6 vs 10.69)
No change No change AA < AE (1.17 vs 1.26)
No change No change
AA < AE (2.46 vs 3.28 pg/mL)
AA < AE (1.19 vs 1.51 ng/dL)
Zanker et al (1998)168
27 9 AA 9 AE 9 SE
Matched for training load, but details not included EB OC Z-score BAP Z-score E2 T3 IGF-1
AA < AE < SE AA < AE, SE AA < AE AA < AE, SE AA < AE AA < AE < SE AA < AE, SE AA < AE, SE
Zanker et al (1998)169
33 18 (E) 9 (A) 6 (O)
All averaged 47.6 mi/wk BAP BMI T3 E2 EB
E < A, O; O < A for all variables. BAP =positive correlation with BMI, T3, EB
Abbreviations: AA=athlete amenorrheic, AE=athlete eumenorrheic, SE=sedentary eumenorrheic, HA=hypothalamic amenorrheic, EC=eumonerrheic control, E=eumenorrheic, A=amenorrheic,
O=oligomenorrheic, HPO=hypothalimc-pituitary-ovarian, HPA=hypothalamic-pituitary-adrenal, BC=body composition, BMI=body mass index, BMD=bone mineral density, Fneck=femoral neck, Troch=trochanter, Wbody=whole body, RMR=resting metabolic rate, EB=energy balance, EI=energy intake, EE=energy expenditure, EA=energy availability, T3=iiodothyronine, T4=thyroxine, GH=growth hormone, IGF-1=insulin-like growth factor-1, E2=estrogen, LH=luteinizing hormone, FSH=follicle stimulating hormone, P=progesterone, ACTH=adrenocorticotrophic hormone, C=cortisol, OC=osteocalcin, BAP=bone alkaline phosphatase, PICP= type I procollagen carboxy-terminal propeptide, EAT-26=diet questionnaire with higher score is worse, ↓=decrease, ↑=increase, <=lower than, >=greater than, LM=lean mass.
estrogen production has been shown126,160, 162,163,168,169. The lack of estrogen
11
Risk factors for LEA include restricted dietary intake, limiting types of food consumed, early sport specialization training, dieting, and injury171,172. Stress fracture risk increases with lowering BMD, menstrual disturbances and dietary
insufficiencies173,174. Bone losses may be irreversible, it is critical to identify an individual at risk as soon as possible. Prevention is best achieved with annual screenings prior to participation in athletics. The Triad Coalition has created a 12-question screening tool. It will prompt further investigation based on responses. If so directed, determination of primary (menarche after age 15) or secondary (three consecutive absent menses) amenorrhea as well as possibly testing for BMD2,3. The primary treatment for the Triad is to increase EA. This may be accomplished through an increase in EI, a decrease in exercise or a combination of the two. Objective cumulative risk assessment and return to play algorithms have been created by the Triad Coalition to increase prevention and expedite treatment for any impacted individual2. While the Triad is specific to females, males are considered at risk for many of the same dysfunctions. The research has not yet been conducted to the same degree for male endurance athletes at this point in time3.
EXERCISE-HYPOGONADAL MALE CONDITION
EHMC has been identified as a condition in which chronically endurance trained males experience neuroendocrine dysfunction at either a central
12
have been significantly reduced and LH does not demonstrate an increase that would be expected in response to low testosterone 43-46. Both retrospective and prospective study designs have identified the altered PRO and LH measures43,44,46-48. These alterations have been attributed to dysfunction within the
hypothalamic-pituitary-testicular axis, in a fashion similar to observations in the hypothalamic-pituitary-ovarian axis of women4.
The retrospective studies have generally found significantly diminished resting testosterone levels (free and total)31. Studies ranged from seven to forty weeks in training protocols and varied between trained and untrained/sedentary participants. There were significant differences in the protocols of the training programs as well. Included were military training39,40, competition seasons35,37,41, consistent intensity32,36 and continuous plus interval training33,34. Inconsistencies, in findings can likely be attributed to these differences in fitness level, training protocols as well as sampling times. The majority of studies however, indicated decreased resting testosterone following an intensive and, or prolonged endurance training protocol-program32-34,39-41. RELATIVE ENERGY DEFICIENCY IN SPORT, PREVELANCE AND RISK FACTORS
The International Olympic Committee (IOC) consensus group introduced a new term that is meant to be more comprehensive and inclusive than the Triad. By
13
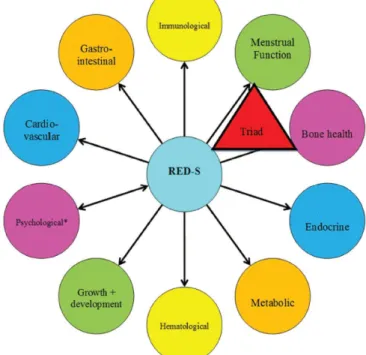
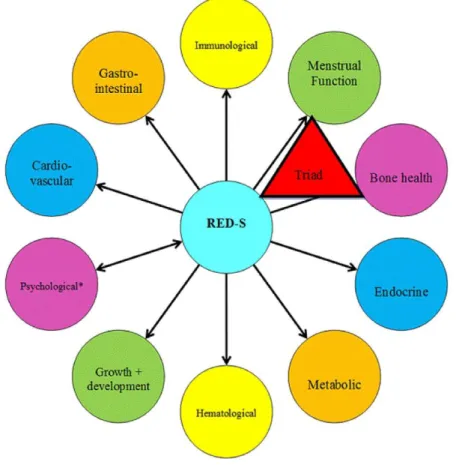
should be included. Finally, men should most certainly be included3. Based on work by Loucks15, a value of 45 kcal/kg of LM/day provides sufficient fuel to maintain balance in healthy females, as noted previously. When insufficient energy is available, there will be alterations in body systems to reduce energy expenditure. This can extend to an array of negative systemic
function as seen in Figure 3. Screening and diagnosis of RED-S is complicated given the array of symptoms, screening tools that are not yet
validated68,69, and a lack of universal EA standards3.
Regardless, EA is recommended as the target measure since it is
considered the catalyst for subsequent
development of RED-S. The precision to collect EI and EEE is imperfect, but these are primarily captured through athlete’s maintenance of records and logs70. When possible, the implementation of technology to increase objectivity for EEE is recommended3. Additionally, menstrual function in females should be monitored for signs of secondary amenorrhea, and finally, bone health should be captured via DXA2.
Treatment when RED-S is present, is to first increase EA. This may be an
increase in EI by approximately 300-600 kcal/day, alone or with a decrease in EEE. The severity of the case will dictate impact on exercise training71,72. Treatment for bone loss
14
may be more complicated as loss is not always reversible. However, several studies have shown a positive effect on BMD following the implementation of resistance training and high-impact loading at least twice a week73,74,77. Supplementation with both calcium and Vitamin D is also recommended75,76. The IOC position statement suggests best way to combat RED-S is education across different groups relevant to the athletes: friends and family, healthcare professionals and sport organizations. The more informed individuals from every facet know what to look for, the earlier a possible sign or symptom can be identified and intervention can occur3.
RED-S Prevalence in Male Athletes
Prevalence of RED-S, especially in men, is not well known. There are more studies evaluating disordered eating (i.e., active efforts to lose body mass without
clinical diagnosis of an eating disorder) than low EA52. A handful of studies investigating EI in male athletes found a greater risk of insufficient caloric intake in leanness sports, especially endurance based. A group of cyclists consumed similar amounts of calories compared to controls regardless of performing five times as much exercise. Both groups were consuming insufficient amounts of B vitamins, vitamin D, iron and calcium53. Other studies identified runners as consuming fewer snacks throughout the day compared to team sports athletes54, and cyclists demonstrating increased disordered eating
15
sports, individuals involved in team sports (i.e., soccer, ice hockey) meet the nutrition recommendations59-62.
Studies have also shown a greater prevalence of endurance athletes practicing disordered eating (i.e., restrictive diets)63-65. Filaire, et al.66 found 67% of cyclists studied were dissatisfied with their weight and 41% had intentionally dieted for weight loss. Tenforde, et al.67, studied 306 male high school runners, and 9% skipped meals or dieted to lose weight. Between adult runners and controls, the runners scored significantly higher on the EAT-26 than controls. A tool used to assess risk of eating disorder or disordered eating, but not diagnostic51. Approximately, 23% and 11% of male triathlete participants scored below the midpoint range on the preoccupation with food and weight, and calorie counting, respectively. While these numbers were slightly lower than in females (39% and 28%, respectively) they are still cause for concern64. The exact prevalence of RED-S is unknown, but the few studies that have investigated endurance athletes have found indications that these athletes are at greater risk of low EA. Since there is such limited information available, it is important to begin to decipher the extent of the risk.
Endocrine Function
Testosterone
Testosterone (T) is a steroid hormone, regulated through the hypothalamic-pituitary-gonadal axis. It is regulated primarily via a negative feedback loop, meaning the hypothalamus is stimulated in response to low levels of circulating T. Upon
16
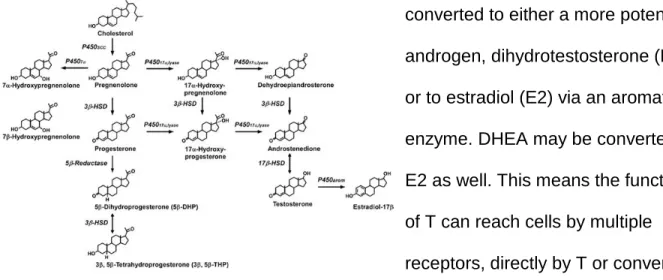
stimulating hormone (FSH) in a pulsatile fashion. LH will stimulate the Leydig cells in the testis to produce and release T80,81,86. It is important to note that T and its precursor dehydroepiandrosterone (DHEA) may be converted in the peripheral tissues. T may be
converted to either a more potent androgen, dihydrotestosterone (DHT) or to estradiol (E2) via an aromatase enzyme. DHEA may be converted to E2 as well. This means the functions of T can reach cells by multiple receptors, directly by T or conversion to DHT both at androgen receptors (ER), and as E2 at estrogen receptors (ER)79,81. As a steroid hormone, T travels through the blood attached to sex hormone binding globulin (50-60%) or another nonspecific binding protein, frequently albumin (40-50%). The remaining 1-3% is circulating freely as the bioavailable portion to be effective at the tissue. The effects can be categorized as either androgenic or anabolic79-81,86. Figure 4 illustrates the steroid hormone
synthesis and conversions through which testosterone can impact tissues.
Androgenic effects are those concerned with reproduction and male secondary sex characteristic development. Testosterone is the primary male sex hormone, and is responsible for stimulating sperm production through androgen receptor activation at the Sertoli cells. Receptor activation begins a cascade of events, currently not well understood, that lead to the production of sperm85,87-89. A chronically low level of testosterone could lead to issues with infertility and potentially libido.
17
Anabolic functions include an array of effects more critical to exercise
performance. Testosterone is important for neuromuscular adaptation, bone growth, strength (synthesis of structural proteins) and increased hematopoeisis80,81. Crewther, et al.91 identified increases in motor neuronal soma and dendritic size, additionally, in muscle cells T increased calcium channels. Numerous studies have found increases in muscle size and/or improvement in performance with exogenous T92-97. Physical activity has been shown repeatedly to increase testosterone, which increases amino acid
uptake in muscle tissue and AR binding leading to increases in muscle gene transcription84,90,98,99. This additional transcription provides increased protein
synthesis82,83. Abu, et al.100 found evidence of testosterone stimulating increases in bone formation and calcium absorption. Additionally, low T has been associated with low BMD101. Negatively altered T concentration could impact many important anabolic components.
Thyroxine (T4) and Triiodothyronine (T3)
The thyroid gland releases two amino-based hormones (T3 and T4) important for contributing to metabolic rate and impacting metabolism of all macronutrients. Nearly all cells of the body are affected, though this will focus on the metabolic effects of T3 and T4. Once bound at a cellular receptor, they can exert their function through both genomic (direct gene activation) and nongenomic (cAMP, second-messenger systems)103,104.
18
the cell to transport more Na+ out of the cytosol and K+ into the extracellular fluid. The additional use of ATP to support the action of the pumps, create additional heat to aid in body temperature regulation80,86. In addition to being a major regulator of BMR106, metabolically, they stimulate protein synthesis, increase lipolysis, gluconeogenesis and glycogenolysis to use more glucose and fatty acids for ATP production80,86. Finally, thyroid hormones are “permissive” hormones in that they enhance the effects of some other hormones. Primarily, the actions of epinephrine and norepinephrine due to
upregulation of beta receptors, although, to some extent T and growth hormone as well via receptor mechanisms80,86,102.
The thyroid hormones are regulated through the negative feedback loop of the hypothalamic-pituitary-thyroid axis, stimulated by low circulating levels of T3 and T4 or low metabolic rate80,86,102. T4 is released in larger quantities compared to T3, but can be converted to T3. This is important as T3 is more biologically active, and thus it is
19
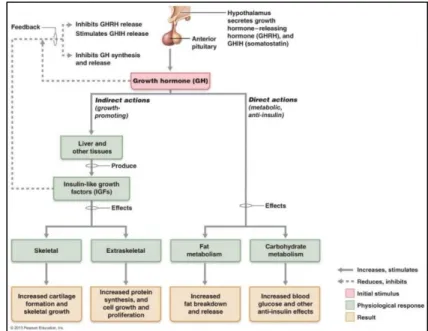
Growth Hormone
Growth Hormone (GH) is secreted from the anterior pituitary. It is stimulated by growth hormone releasing hormone (GHRH) and inhibited by somatostatin from the hypothalamus. GH production is
regulated by a negative feedback loop. GH affects growth at all tissues, both directly and indirectly through the stimulation of insulin-like growth factor-1 (IGF-1)86,102. While it is predominantly involved with growth and development in childhood, GH
continues to be involved in the turnover of muscle, bone and cartilage throughout life132. The metabolic effects of GH extend to carbohydrates, lipids and proteins and can be found in Figure 5.
Bone Health Status
Bone Alkaline Phosphatase
There is no unanimous biomarker to measure bone metabolism, however, alkaline phosphatase (AP) is an important enzyme in bone mineralization. Serum AP is the most commonly used marker for bone metabolism. There are several different enzymatic isoforms for AP. Bone alkaline phosphatase (BAP) is one that has a very high specificity and is being used more in clinical settings107. Epstein108 identified BAP
20
as a strong indicator of bone formation and his study was followed by van Straalen, et al.109, who determined BAP was able to monitor changes in bone formation. When compared to serum AP, BAP identified differences general serum AP was not sensitive enough to capture. Specifically, BAP is thought to indicate osteoblast activity. It supplies the high phosphate concentration at the cell surface for bone mineralization142.
Additionally, BAP is sensitive to aerobic exercise training and does not show diurnal variations. The lack of diurnal variation, and specificity to aerobic training makes this an interesting measure for this project.
Bone Mineral Density
The two primary bone cells involved in maintaining bone strength and health are osteoblasts (bone formation) and osteoclasts (bone resorption)108. Osteoblasts build the bone tissue through production of a matrix developed by crystallized salts come
together in ossification and calcium is deposited into the matrix. Osteoclasts, break down the matrix in an effort to deliver calcium to the blood, weakening the matrix111, 86. During childhood and into young adult status, most of the building of bones occurs. Peak bone mass is generally attained in late teens to early twenties. After that phase, where osteoblasts are the predominant cell, a balance between osteoblasts and osteoclasts persists until later in life. Women are a higher risk for decline in bone strength with age, as osteoclast activity accelerates following menopause. Men do not see as extreme a rise in osteoclast activity, but may still lose bone mineral density with age111.
21
bone mineral content, an individual is at risk of or may be diagnosed with
osteoporosis52. BMD is measured and reported in levels compared to the current young adult mean as a Z-score for standard deviations (SD). The International Society of Clinical Densitometry (ISCD) recognizes BMD within 1 SD (Z = -1 to 1) as normal, between 1 and 2.5 (Z < -1 to -2.5) as low bone mass and more than 2.5 SD (Z < -2.5) as potentially osteoporosis112.
Resting Metabolic Rate
Metabolic rate is the rate at which metabolic processes use energy. This is measured as heat production and is best assessed through indirect calorimetry. The resting metabolic rate (RMR) indicates the minimum number of calories required to meet the demands of physiological processes within the body, including: cellular maintenance, thermoregulation, growth, reproduction, immunity and any
movement113,114. Metabolic rate can be impacted by several factors (exercise, hormones [see thyroids], nervous system, body temperature, food ingestion and age)86,114. To obtain the most accurate measure it is important to take these into account and follow best practices protocol114.
ENDURANCE TRAINING AND LEA IN RED-S RISK FACTORS (Men) Endurance Training and Low Energy Availability: Endocrine Function
Testosterone
22
differ and with them the findings too. When looking at endurance athletes involved in running and cycling, numerous studies have found lower levels of resting
testosterone7,33,44,117,119. In comparing endurance trained (ET) athletes with matched untrained (UT) men, Hackney et al.49,115, found the ET males had significantly lower resting T values than the UT. It should be noted that although T values were decreased and being only 50-85% of the UT males, they were still within the normal clinical range, however, on the lower end. Similarly, McColl et al.116 found ET males to have
significantly reduced resting T values compared to age-matched sedentary controls. This same trend with samples of differing fitness levels has been seen in additional studies, and suggests the volume of exercise training may be interrupting testosterone production7,46,119.
Not all studies have found decreased levels of resting T. Lucia et al.35 investigated T in groups of professional cyclists (n=12), elite triathletes (n=9), recreational marathoners (n=10) and sedentary males (n=9). Comparisons were conducted across training, competition and rest periods in each group. They found no changes in resting T, but the training characteristics were quite variable across exercise groups (although there were significant differences in body fat %). Bonifazi et al.37
23
For example, many of the studies reporting low T have done resting measurements in which no exercise has been done for ~24 hours and stress levels were controlled, hence removing the influence of any exercise training or competition residual.
The argument has also been made that there is a training volume threshold that must be reached in order to induce reductions in resting T121. There have been studies conducted in athletes completing a training workload equivalent to or greater than 100 km, indicating most of them found decrements in resting T within 10-30% lower than sedentary controls7,46,117,119. On the other side, studies where participants performed less than 100 km of training workload were less likely to experience reductions in resting T117,120,121. These contrasting findings support the idea a volume threshold may actually exist, which could explain why endurance athletes are more likely than other field-based sports (i.e., soccer, football) to experience lower resting T since these sports typically perform a lower volume of running-like activities61.
24
Thyroxine (T4) and Triiodothyronine (T3)
Thyroid stimulating hormone (TSH) is quite responsive to short-term exercise once the critical threshold intensity of 50% VO2max has been met. However, the thyroid hormones, triiodothyronine (T3) and thyroxine (T4) do not completely mirror TSH,
possibly due to the delay in time from TSH stimulation for the subsequent production and secretion80. Research findings involving prolonged exercise remains somewhat unclear in the mechanisms regarding T3 and T4 changes with exercise. Interestingly, the two hormones increases do not respond in a linear fashion in men performing prolonged exercise. Typically, T4 after an initial increase, remains constant (plateau) until recovery when it decreases, while T3 once peaking (usually 45-60 min into exercise) declines continuously throughout the remainder of the exercise. The mechanisms driving the responses and physiological outcomes remain unclear; but, it is important to remember the permissive actions of thyroid hormones and hence changes in them affect many other hormones in the endocrine system (e.g., T)124,125. More research is thus needed to elucidate the response to exercise and any relationship to the lower resting T found in some male endurance athletes.
25
change for free T3 in the controls, but the rowers were either negative responders (n=10) with decreases of 28.2% and 24.9% at weeks 5 and 10, respectively, or non-responders (n=7) with no change. Similar responses were seen for TSH and leptin in the negative responders, who had returned to baseline by the end of 20 weeks. It is important to note that all of the women in this study were eumenorrheic. Why only some studies report finding where subjects have experienced a decrease is unclear, but may be due in part to decreased hypothalamic-pituitary signaling action in an effort to
26
course with either a 1200 or 1000 caloric deficit per day, Friedl et al.128 found significant decreases in T3 that were more pronounced in the 1200 kcal deficit group. They
concluded T3 is a strong candidate to identify acute energy deficits. While this was an extreme case, it indicates the responsiveness of T3 to LEA in men
Growth Hormone
Growth hormone (GH) has been shown to respond to an exercise session in as little as 10 minutes. Most research suggests a necessary intensity of 60% VO2max to elicit a response, though some would suggest 40%132. There are mixed results reported, however, on the effects of exercise training on GH resting levels138-141. It has been suggested that resting levels of GH are increased following training that has been conducted at or above the lactate threshold; but other studies have not shown this effect80. This training does appear to increase the pulsatility of GH release, but this may (or may not) lead to an overall concentration at rest80,135. The variability seen across studies may be due to the factors that can impact GH in addition to exercise training alone (see below).
Nutrition is one factor that has been shown to affect GH response. Several studies have indicated elevations in GH when a caloric deficit or LEA is
present126,133,134. Loucks and Thuma identified an increase in sedentary females at both 30 and 20 kcal per kg LM when performing exercise at a 15 kcal per kg LM cost126. In another study, twelve wrestlers consumed a restricted caloric diet for 7 days and
27
to have been the driving force134. Finally, in a similar study, across a wrestling season, 9 wrestlers and 7 age-matched controls were measured before, after and ~4 months post-season. The wrestlers had significantly higher GH levels after the season compared to the controls. This was contributed to the weight restriction practices many wrestlers employ133. Though it is not unanimous it appears low energy availability can have a substantial impact on GH responses at rest and perhaps to exercise.
Endurance Training and Low Energy Availability: Bone Health Status
Bone Alkaline Phosphatase
Exercise training of a weight bearing nature is known to induce increased bone formation. Different activities and sports can leave individuals with varying levels of benefit143, and a marker to measure bone formation status would be helpful. Bone alkaline phosphatase (BAP) has been used in multiple studies to determine the effect of events and endurance training programs on bone health. Eliakim et al.145 measured bone formation in a 5-week endurance training program with an active group and a control group. BAP was increased significantly following the exercise program, with no change seen in the control group. The authors did not see evidence that fitness status was related to bone formation marker response145. In another study, three groups (aerobic, anaerobic, control) were utilized to determine BAP response to 8-week training programs146. After 4 weeks, the aerobic group had a decrease in BAP that returned to baseline levels by week 8. The anaerobic group had increased BAP at week 8
compared to week 4 while the control was relatively unchanged146.
28
The values did not represent a dangerously low level, but did provide evidence suggesting a slowing of bone formation147. Lastly, Shibata et al.148 had 28 sedentary females begin a yearlong practice of daily walking (n=17) or daily walking and jumping (n=11). After one year, BAP increased in both groups, with a more exaggerated change in the walking and jumping group. BAP was the only one of three bone formation
markers to display an increase (again suggesting increased bone formation)148. While the research literature is not in total agreement, this marker appears to be responsive to both accelerations and slowing in bone formation status.
Bone Mineral Density
After genetics, diet and exercise are the two of the most influential factors for bone mineral density (BMD)77. Weight bearing exercise is understood as having an osteogenic effect due to the loading forces applied to the bones144,149. Sports
demanding higher impact and multidirectional forces (i.e., soccer, basketball, lacrosse) have been shown to result in higher BMD than average150,151. Endurance sports, where volume of training and therefore impact, is higher seem like they should also have increased BMD, but there is evidence to suggest this is not the case. Men and women in endurance based sports (i.e., running, cycling, triathlon) not only lack above average BMD levels, but quite the opposite – measured as having lower BMD levels according to ACSM standards112.
29
where direct loading occurs. A total of 40% of the runners had a lumber spine Z-score of -1 to -2.5, which is classified as low to potentially osteoporotic112. Thus even though runners experience a high volume of weight bearing exercise, the indirect nature of the loading on the spine and hip does not protect from injury like the direct loading at the calcaneus143. Dolan et al.154 compared the BMD of two groups of jockeys and one group of boxers. Both jockey groups had significantly lower BMD measures than the boxers. This was attributed to the chronic weight restrictions of the jockeys (i.e., dieting) and the lack of consistent bone loading in their training.
Viner et al.155 investigated 10 months of dietary habits of competitive cyclists (n=10) with lower than expected BMD (Z-score < 0), collecting measures at 0 (pre-season), 5 (competition) and 10 (off-season) months. In this study, LEA was defined as < 30 kcal per kg LM per day and 70% of participants were below that level for the season. Of the participants, 90% and 80% had LEA during competition and off-season, respectively. Based on questionnaires completed, 70% of participants also consciously restricted energy intake for overall body weight control. This study provides evidence that LEA is prevalent among high level cyclists (USA Cycling category: Pro, n=2; 1-4, n=8) and could be a contributing factor to the lower than normal BMD values measured. Resting Metabolic Rate
30
it has on RMR. The impact of endurance training on RMR has been investigated in a number of studies with mixed results.
A 12-month study investigating the effect of a protocol including a walk/jog done three times per week for 45 minutes at 60% of heart rate reserve found no significant change in RMR. This study was conducted in males (7) and females (10) with an average VO2max of 37.5 ml/kg/min (not reflective of highly trained individuals)30. It was suggested the lack of increase in RMR may have been due to the stagnant intensity level used in the training regimen22. There was no indication of training progression throughout the study. This may have limited adaptations to greater lean body mass that would have been expected to contribute to a higher RMR.
Lee et al.29 compared RMR in 19 males following 12-weeks of either an exercise (n=9) protocol (jog/run 3 days per week, 25-40 minutes at 60-80% VO2max) or a control (n=10) sedentary group. The exercise group revealed no change in RMR, while the control group showed decreases in RMR. The control group had a decline in RMR that the authors attributed to possible annual seasonal variation, suggesting the training may have staved off a similar decline in the exercise training group.
31
Similarly, Broeder et al.27 implemented a training program for 12 weeks of walk or jog four days per week with weekly progressions every four weeks. By week nine, the participants were completing 50 minutes of exercise at 70-85% VO2max and 2-5 minute fartlek-like intervals at 90% VO2max. Again no change was seen in RMR and the
participants were in a negative energy balance state. The authors suggest the negative energy balance was resultant from the increased exercise energy expenditure and it was responsible for preventing the expected RMR increase.
Not all studies found no change in RMR following endurance training. While the previously mentioned studies had participants who were primarily sedentary, these next few studies were examining trained versus untrained participants. Tremblay et al.25 saw increases in RMR in both the trained and untrained participants over 11 weeks of
training at 50% VO2max for approximately 5 hours per week. Increases were greater in the trained compared to the untrained individuals. The increases for the untrained were attributed to additional energy expenditure during non-active times due to the increases seen in lean mass seen in them.
Poehlman et al.23,24 tested trained and untrained males to compare VO2max and RMR and determine if there was a relationship. They found in both studies, the trained participants had higher RMR and VO2max scores, additionally, a linear relationship between VO2max and RMR (r = 0.77) was identified. The authors matched the
32
trained), they found the same linear relationship between RMR and VO2max. RMR responded similarly as the level of activity increased with each group, so did the VO2max 24.
33
CHAPTER 3: EXPERIMENTAL DESIGN AND METHODS Overview of Aims
The purposes of Aims 1 and 2 are to investigate the presence and potential association of energy availability and risk factors for RED-S in competitive,
recreationally trained male endurance athletes. Aim 1 investigated the prevalence of LEA, by risk level (At Risk, Moderate Risk, No Risk) associated with EA in a sample of male endurance athletes through a comprehensive online study questionnaire. Aim 2 investigated the possible associations between EA status and RED-S risk factors (i.e., endocrine, metabolic and bone status) as well as EHMC risk factors in male endurance athletes.
AIM 1
Participants Aim 1
Recruitment of subjects for Aim 1 were through distribution of the study web link (with study description) to elite endurance sport organizations for completion by their membership. Prior work from our research group has been highly successful in this format (>1000 participants) and has resulted in a database of potential contact
34
triathlons) training for a competitive endurance event. Individuals were excluded if they had a current injury preventing full training, were under 18 years of age, or were in the first two weeks or final two weeks of training prior to their event. In Appendix A is an illustration of the overall questionnaire to be used in the online format.
Study Procedures: Aim 1
Study Design
This investigation utilized an online study questionnaire created and distributed through Qualtrics ®. Participants received an email containing a brief description of the study and necessary information (dietary and training records) for completion, along with an internet link directly to the study.
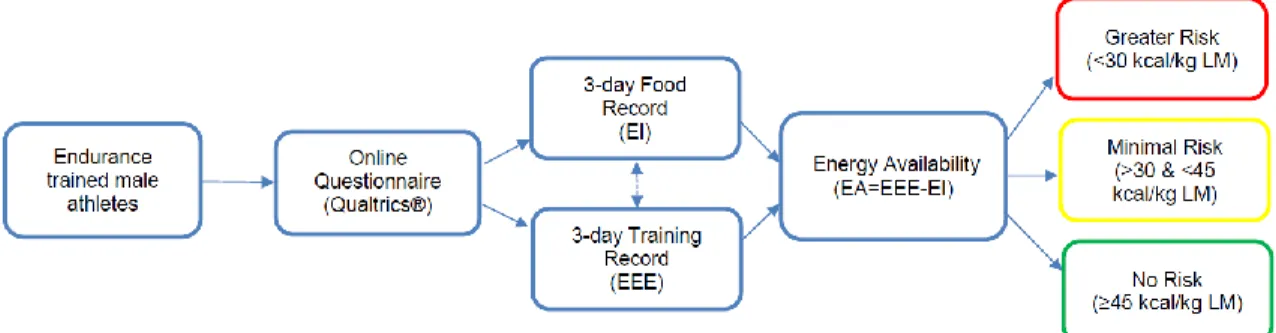
The design for Aim 1 can be found in Figure 6. Figure 6. Aim 1 study design
Energy Availability Questionnaire
Introductory Email
The introductory email included the purpose of the study and that it would include questions regarding standard characteristics (age, height, weight), dietary and training habits. It informed the participant about the 3-day diet and training record that would be requested and the importance of maintaining their normal diet and training habits were stressed. Additional contact information for the PI was provided in the case of
35
Dietary Component
The dietary habits of the participants were collected through a 3-day food record they provided including everything they consumed and the quantity with as much detail as possible (i.e., brand, ounces, servings, weight). Participants were emailed detailed directions following the completion of the survey, including guidelines for portion size with examples. It was requested that the days of dietary recording be matched with the reported training days.
Training Component
Training habits were captured through a series of questions inquiring about mode, duration and intensity. Heart rate and ratings of perceived exertion during the given session were included for all. Cycling included rpm and watt measures, while swimming included distance swam. To increase specificity, questions were asked separately for each training session as opposed to average estimations per week (e.g., How many sessions per week do you consider high intensity?).
Low Energy Availability Risk Calculation
Determining the energy availability status required multiple estimations. Based on information collected in the characteristics section, lean body mass (eLBM) and resting metabolic rate (eRMR) were estimated for each participant. The Boer formula17 and Cunningham equation19 were utilized to estimate LBM and RMR, respectively. The equation for determining EA was follows:
36
Energy intake was calculated from the dietary records provided. Each item was analyzed through a nutritional analysis system (Food Processor, ESHA, Salem, OR) to determine total macronutrient content intake per day (kcal/day). Each day was
compared with the training for that day.
Exercise energy expenditure was determined using the Compendium of Physical Activities13. Based on the information about each training day completed by the
participant, a metabolic equivalent (MET) value was designated from the compendium. Kcal cost will then be calculated as:
EEE = MET value x weight (kg) x duration (hr)20
The values obtained for EI and EEE for each of the three days was calculated to
determine EA. The three-day EA totals were then averaged to determine participant EA. This data collection allowed the calculation of energy availability in male
endurance athletes, allowing for assessment of prevalence within the current standard cut points (as determined in females) and identify a potential prevalence outside the given standards. It is understood that the guidelines for LEA are developed from
37 AIM 2
Participants
Participants were sixty competitively trained male endurance athletes (i.e., participants in sports such as cycling, marathons, triathlons in which aerobic based training ≥ 10 hr/wk) recruited from the North Carolina Triangle area. Participants were actively training for an event. Individuals were excluded if they, 1) were under 18 years of age, 2) had an injury limiting training, 3) were within the first or last two weeks of training, or 4) had a history of medical or surgical events that may significantly affect the study outcome, including cardiovascular disease, metabolic, renal, hepatic, or
musculoskeletal disorders. Study Design
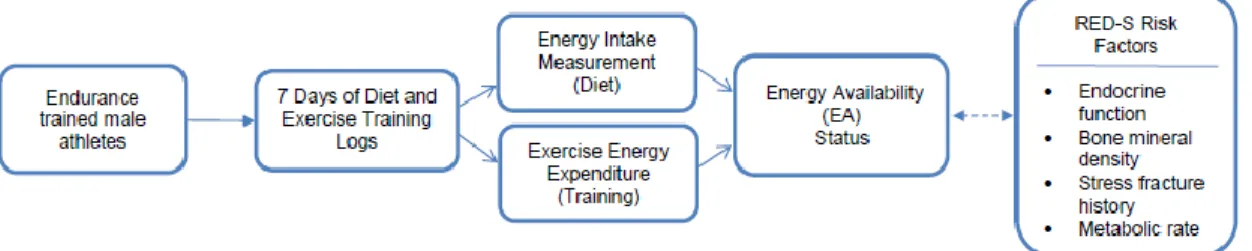
To investigate the possible associations between EA and risk factors for RED-S in male endurance athletes an observational, cross sectional design was implemented. By using an observational design, it was possible to capture the habitual practices of male endurance athletes. A diagram of the study design is below (Figure 7).
Figure 7. Study design diagram
Study Procedures
38
below), received directions for diet and training records and a resting electrocardiogram during the initial visit. Following the observational period (at least eight days later), participants returned to the APL following an 8 hour fast and having performed no exercise in the previous 24 hours for resting metabolic rate, BMD and blood draw assessment. Each participant also completed in this final visit a maximal
cardiopulmonary exercise test (VO2max) which was used to more objectively calculate the caloric cost of training (see below for details).
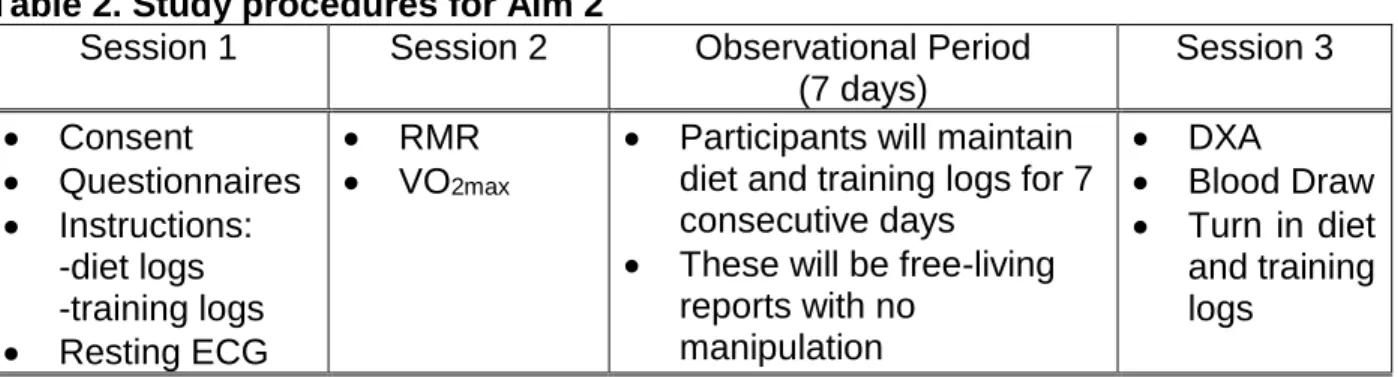
Table 2. Study procedures for Aim 2
Session 1 Session 2 Observational Period (7 days)
Session 3
• Consent
• Questionnaires
• Instructions: -diet logs -training logs
• Resting ECG
• RMR
• VO2max
• Participants will maintain diet and training logs for 7 consecutive days
• These will be free-living reports with no
manipulation
• DXA
• Blood Draw
• Turn in diet and training logs
Questionnaires
At the introductory session, once the consent form was signed, all participants completed four questionnaires:
• Medical History – This provided a detailed look at each participant’s history and helped confirm safety for conduction of VO2max test.
• Energy Availability Diet and Fracture History – provided knowledge about participants’ diet and stress fracture history, which was an important factor in this study.
39
The PSQI is a valid and reliable questionnaire with a published cut-off score of ≥ 5 indicating sleep disturbance14.
• Recovery Stress Questionnaire for Athletes (REST-Q Sport 52 [REST-Q]) – The REST-Q analyzed individual recovery-stress state for the previous 72 hours through 19 sub-scales related to training recovery stress. Questions are rated on a 7-point Likert scale from 0 (never) to 6 (always).
See Appendices C-F for a copy of the questionnaires.
Maximal Oxygen Uptake Test (VO2max)
Each participant underwent a resting electrocardiogram (ECG) (GE Healthcare, Chicago, IL, USA) to detect any underlying cardiac complication that would prohibit conduction of a VO2max test. Once approved through medical history and ECG
clearance, a VO2max test was scheduled and completed. Participants arrived at the APL fasted for at least 8 hours, consuming only water and having avoided strenuous
40
10 seconds of each minute and ratings of perceived exertion (RPE, Borg 6-20 scale) were recorded in the final minute of each stage. The caloric cost and HR data for each stage was the basis to determine participant EEE for each training session.
Cycle Ergometer
Participants whose primary competition and training form was cycling were
tested on an electronically braked cycle ergometer (Lode, Groningen, The Netherlands). Participants warmed-up on the cycle at 50 watts (W) for two minutes, then had five minutes for stretching. The procedures were then explained, mask was fitted and a resting collection began for three minutes while seated on the cycle. Following rest, the test began with resistance of 100 W and increased by 50 W every two minutes. This continued until volitional fatigue175.
Treadmill
41
Resting Metabolic Rate
Participants arrived at the laboratory fasted for at least 8 hours, having
consumed only water and having avoided strenuous exercise, caffeine and alcohol for the previous 24 hours. Participants lied supine in a quiet room, where they continued to breathe under a ventilated canopy in quiet rest with no visual or audible stimulation for 30 minutes. Respiratory gases measuring oxygen consumption (VO2) and carbon dioxide production (VCO2) were collected via the TrueMax 2400 canopy system and metabolic cart (Parvo Medics, Sandy, UT, USA). Gas and flowmeter calibrations were conducted immediately prior to testing.
Dual Energy X-ray Absorptiometry
Bone mineral density was determined through the use of dual energy x-ray absorptiometry (DXA) (GE Lunar, Chicago, IL, USA). Participants removed jewelry, excess layers and shoes, and lay supine on the DXA machine. They were positioned with arms and legs extended while not touching the rest of the body, fingers wew apart, feet were strapped loosely together to prevent rolling. The participant was directed to lay quietly as the measurement occurred, approximately 6-7 minutes. Low BMD was defined as a Z-score < -1 standard deviation112.
Blood Collection Procedures
Blood draws were collected from an antecubital vein following standard
42
centrifugation (IECCentra-8R Refrigerated Centrifuge, International Equipment
Company, Needham Heights, Massachusetts, USA) at 3000 rpm for 15 minutes at 4°C. Sera samples were pipetted and stored in 1.5 mL cryogenic vials (USA Scientific, Ocala, FL, USA) at -80°C until analysis via enzyme linked immunosorbent assay (ELISA). All ELISAs were conducted per manufacturer instruction. Standards were measured in triplicate and samples in duplicate. Mean values for each sample were determined and utilized in the statistical analysis. Serum was collected to analyze testosterone, triiodothyronine (T3), thyroxine (T4), growth hormone and bone alkaline phosphatase (BAP) (see Table 3.2).
Observational Period
During the 7-day observational period, participants continued to eat and train freely with no intervention. They maintained diet records and training records each day to create a snapshot of a standard week for a male endurance athlete. These records contained the necessary information to calculate EI and EEE to determine EA.
Diet Record
Participants were required to complete daily food logs during the 7 day
observational period. These were subsequently analyzed to determine energy intake. Diets were self-selected by participants. Prior to the study beginning a period of education by the principal investigator as to food measurement and recording was provided during the instructional session. Each participant received dietary recording forms with spaces for time of day, type of food/drink, quantity of food/drink (See
43
Training Record
Training during the observational period was controlled by the participant. Steps were taken to ensure that athletes were not in phases of their training cycles where there would be substantial alterations of activity (i.e., tapering). Participants maintained training logs (Appendix H) each day which permitted measurement of exercise energy expenditure. Training logs included mode of exercise, duration (minutes) and intensity of each session. Intensity was determined through HR tracking by a chest strap-based heart rate telemetry system (Polar Electro, Inc., Lake Success, NY, USA). The HR for each session was used to determine the caloric cost based on the HR during the stages of the VO2max test. Multiplying the caloric cost for the intensity by the duration in minutes provided the EEE for each individual session.
Statistical Analyses
All statistics were executed with SPSS v19 (Chicago, IL) and statistical significance level was set at p<0.05.
Aim 1 – LEA prevalence in male endurance athletes
Frequencies of EA status (kcal/kg of LBM/d) were utilized to identify respondents with different levels of LEA risk. Prevalence was then determined as follows: At risk = number of individuals consuming less than 30 kcal/kg of LBM divided by total
44
characteristics, modes of exercise training and effect of injury induced exercise training break between EA risk groups
Aim 2 – EA status association with RED-S – EHMC Risk Factors
A power analysis (G*Power 3.1.9.2) was conducted for bivariate correlational assessment at 80% power and α < 0.05, to detect a correlation coefficient r=0.30 (smallest effect) a sample of 67 participants were necessary. In previous studies conducted in women with comparable analyses167,169,170, sample sizes of 29-33 were sufficient to detect r=0.5-0.9. Provided the large volume of information being requested from participants, we suspected some attrition would occur. Thus we determined 60 participants would be sufficient between the power analysis and previous research to detect a minimal association between LEA and RED-S – EHMC factors.
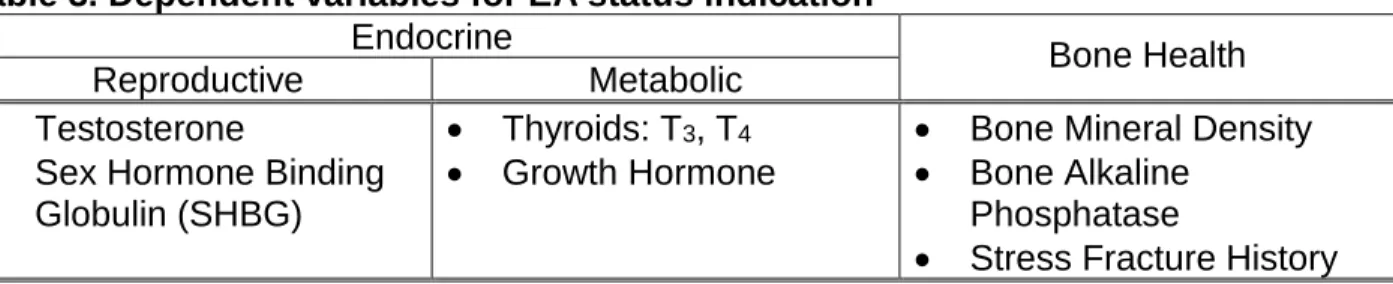
Each variable was tested for normal distribution through Shapiro-Wilk and correlational analyses (Pearson product moment or Spearman rank-order) was conducted for associations between EA status and risk factors for RED-S – EHMC (testosterone, BMD, injury history). Dependent variables are identified in Table 3). Association levels were defined as negligible (0.0-0.29), low (0.3-0.49), moderate (0.5-0.69), high (0.7-0.89) and very high (0.9-1.0)16.
Table 3. Dependent variables for EA status indication
Endocrine Bone Health
Reproductive Metabolic
• Testosterone
• Sex Hormone Binding Globulin (SHBG)
• Thyroids: T3, T4
• Growth Hormone
• Bone Mineral Density
• Bone Alkaline Phosphatase
45
CHAPTER 4: RESULTS
This chapter provides an overview of the key aspects for the results, limitations, future studies and conclusions reported in the manuscripts developed from Aim 1 and Aim 2 of the current study. Greater detail on each of these elements can be found in specific manuscripts.
Specific Aim 1
To examine the prevalence of low energy availability (EA) in a sample of
competitive, recreationally trained male endurance athletes.
Results
Energy Availability and Prevalence
A total of 219 individuals completed the survey and 108 completed the 3-day diet and training logs. Prevalence for this study was categorized by EA risk status: 1) At-Risk (AR) – EA ≤ 30 kcal/kg eLBM; 2) Moderate At-Risk (MR) – EA > 30 and < 45 kcal/kg eLBM; and 3) No Risk (NR) – EA ≥ 45 kcal/kg eLBM. Based upon these criteria, 47.2% (n=51) were classified AR, 33.3% (n=36) as MR and 19.4% (n=21) as NR for low EA in this sample.
46
Physical Characteristics, Training and Energy Availability
The EA groups (AR, MR, NR) were each remarkably similar in age, weight and height (no measures were significantly different from one another). BMI, however, was significantly lower in the NR group (22.4 kg/m2±2.3) compared to the AR group (23.7 kg/m2±2.3, F 2,105 = 3.181, p=0.023).
Relative to exercise training, for hours per week and years of training, the groups did not differ (p>0.05). Injury impact on training was variable, as 33 participants
experienced a break in their training of at least three weeks due to injury during the last 12 months. The prevalence of missed training due to injury trends higher in the MR (33.3%) and NR groups (47.6%), and lower in the AR group (21.5%) compared to the sample as a whole (30.6%). Subsequent analysis of how injury impacted prevalence categorization was conducted. From the entire sample (n=108), those having
experienced an injury induced training break in the previous 12 months had significantly higher EA (37.0 kcal/kg eLBM±15.7) than those without a training break (29.4 kcal/kg eLBM±15.7, t106 = -2.306, p=0.023). However, within each specific risk category EA was unaffected by injury induced training breaks (t49 = 0.523, p>0.603).
Nutritional Supplements and Energy Availability
At least one nutritional supplement was consumed by 43.5% of respondents (n=47). Supplement consumption did not, however, significantly affect EA values across the groups (F1,106 = 1.586, p=0.211).
Limitations