2013 State Physician Workforce Data Book
Center for Workforce Studies
Acknowledgments
The 2013 State Physician Workforce Data Book was produced with the help of many people. The publication was
produced under the direction of Karen Jones, with substantial assistance from Casey Tilton in assembling and reviewing
the manuscript. Other AAMC staff who contributed to this report include Paul Jolly, Geoffrey Redden, and Brent
Bledsoe. We are also grateful to Monica Whatley for her effort in checking the data presented here.
We also owe special thanks to the American Medical Association for making the Physician Masterfile available to the
AAMC for research purposes, the AAMC Student and Applicant Studies staff for providing data on students enrolled
in medical schools and physicians training in GME, the AAMC Data Warehouse staff without whom the data analysis
would not be possible, and the AAMC Creative Services team.
The Center for Workforce Studies welcomes your comments and suggestions for future editions of this report.
Suggestions by readers led to the inclusion of Puerto Rico in the report this year, and the addition of specialty-specific
state level data in the online supplement.
Please send comments, suggestions, or questions to:
Clese Erikson, Senior Director
AAMC Center for Workforce Studies
[email protected]
Acknowledgments ...i
Executive Summary ... 1
Interactive Maps ... 2
Key Definitions ... 2
Commonly Used Acronyms ... 3
Section 1 – Physician Supply
Key Findings ... 4
Active Physicians per 100,000 Population by Degree Type, 2012
Map 1 ... 4
Figure 1 ... 8
Table 1 ... 9
Active Patient Care Physicians per 100,000 Population by Degree Type, 2012
Figure 2 ... 10
Table 2 ... 11
Active Primary Care Physicians per 100,000 Population by Degree Type, 2012
Map 2 ... 5
Figure 3 ... 12
Table 3 ... 13
Active Patient Care Primary Care Physicians per 100,000 Population by
Degree Type, 2012
Figure 4 ... 14
Table 4 ... 15
Active Physicians Who Are Female, 2012
Figure 5 ... 16
Table 5 ... 17
Active Physicians Who Are International Medical Graduates (IMGs), 2012
Map 3 ... 6
Figure 6 ... 18
Table 6 ... 19
Active Physicians by Selected Age Groups, 2012
Figure 7 ... 20
Table 7 ... 21
Section 2 – Undergraduate Medical Education
Key Findings ... 22
Students Enrolled in Medical or Osteopathic School for the 2012–2013 Academic Year per
100,000 Population
Map 4 ... 22
Figure 8 ... 24
Table 8 ... 25
Students Enrolled in Public Medical or Osteopathic School for the 2012–2013 Academic Year
per 100,000 Population
Map 5 ... 23
Figure 9 ... 26
Table 9 ... 27
Change in Number of Students Enrolled in Medical or Osteopathic Schools, 2002–2012
Figure 10 ... 28
Table 10 ... 29
In-State Matriculation to Medical School for the 2012–2013 Academic Year
Figure 11 ... 30
Table 11 ... 31
Table of
Contents
Section 3 – Graduate Medical Education
Key Findings ... 32
Residents and Fellows on Duty as of December 31, 2011 in ACGME-Accredited Programs
per 100,000 Population by Degree Type
Map 6 ... 32
Figure 12 ... 36
Table 12 ... 37
Residents and Fellows on Duty as of December 31, 2011 in ACGME-Accredited Primary
Care Programs per 100,000 Population by Degree Type
Map 7 ... 33
Figure 13 ... 38
Table 13 ... 39
Residents and Fellows on Duty as December 31, 2011 in ACGME-Accredited Programs Who
Are International Medical Graduates (IMGs)
Figure 14 ... 40
Table 14 ... 41
Ratio of Graduate Medical Education (GME) to Undergraduate Medical Education (UME),
Academic Year 2011–2012
Figure 15 ... 42
Table 15 ... 43
Change in Number of Residents and Fellows in ACGME-Accredited Programs, 2001–2011
Map 8 ... 34
Map 9 ... 35
Figure 16 ... 44
Table 16 ... 45
Section 4 – Retention
Key Findings ... 46
Physicians Retained from UME
Map 10 ... 46
Figure 17 ... 48
Table 17 ... 49
Physicians Retained from Public UME
Figure 18 ... 50
Table 18 ... 51
Physicians Retained from GME
Map 11 ... 47
Figure 19 ... 52
Table 19 ... 53
Physicians Retained from UME and GME Combined
Figure 20 ... 54
Table 20 ... 55
Summary
State Medians for Physician Supply, UME, GME, and In-State Retention, 2008, 2010, and
2012
Table 21 ... 56
Executive Summary
The 2013 State Physician Workforce Data Book is a biennial report that examines current physician supply, medical school
enrollment, and graduate medical education in the United States. The report provides the most current data available for
each state, the District of Columbia, and Puerto Rico in a series of figures and corresponding tables.
Between 2008 and 2012, there were small increases in the state median number of active physicians and active patient
care physicians, as well as in the state median percent female physicians and percent physicians age 60 or older. While
the median number of students enrolled in undergraduate medial education has increased relative to the population, the
number of students enrolled in graduate medical education per population has remained flat. There has also been little
consistent change in the median percent of physicians who are retained in-state from either undergraduate or graduate
medical education.
The Data Book is divided into four sections:
Section 1: Physician Supply. This section includes data on active physicians in each state, including
physician-to-population ratios, percent female, age distribution, and type of medical education. Data by race and ethnicity were not
available.
Section 2: Undergraduate Medical Education. This section provides information on enrollment for both medical and
osteopathic schools, as well as data on in-state matriculation. Alaska, Delaware, Idaho, Montana, and Wyoming do not
have medical schools, but four of those states (Alaska, Idaho, Montana, and Wyoming) have an agreement with the
University of Washington to reserve slots for residents of those four states at the University of Washington School of
Medicine. For the purposes of this report, all students at the University of Washington School of Medicine are counted in
Washington and not in other states.
Section 3: Graduate Medical Education. This section presents data on physicians in residency and fellowship positions
in each state, including physician-to-population ratios, degree type, and location of medical school. Data in this section
include M.D.’s and D.O.’s in programs accredited by the Accreditation Council for Graduate Medical Education
(ACGME). Where possible, data for physicians in programs accredited by the American Osteopathic Association (AOA)
also are included.
Section 4: In-State Retention. This section presents data on states’ retention of the physicians they educate in medical or
osteopathic schools and in graduate medical education (GME) programs.
The primary data sources for this report are:
• American Medical Association (AMA) Physician Masterfile (December 31, 2012)
• Population estimates from the U.S. Census Bureau
• AAMC Student Record System
• American Association of Colleges of Osteopathic Medicine
Interactive Maps
Individual maps can be selected and printed from the Interactive Report for the 2013 State Physician Workforce Data
Book, which is available online: https://www.aamc.org/data/workforce/interactive/
Summaries for each state, including counts for the top specialties, are also available through the interactive report.
Key Definitions
Active physicians: Physicians who report working in administration, direct patient care, medical research, medical
teaching, or other non-patient care activities are considered active. Physicians whose major professional activity is
unclassified also are considered active. Physicians who are classified as retired, semi-retired, temporarily not in practice,
not active for other reasons, residents, or fellows are excluded.
These data refer to physicians who are active in the 50 states of the United States, the District of Columbia, and Puerto
Rico—regardless of where they attended medical or osteopathic school. Physicians active in other U.S. territories are
excluded. To determine whether or not an active physician is in the United States, the location of the physician’s office
was used. In cases where the physician’s office location was missing, the state from the preferred mailing address was
used. This substitution occurred for approximately nine percent of cases among all active physicians.
Active patient care physicians: This group is a subset of active physicians. It comprises only those physicians whose
self-reported type of practice is direct patient care.
U.S.M.D.: Physicians who received their Doctor of Medicine (M.D.) degree from a medical school in the United States or
Puerto Rico. Graduates of Canadian medical schools are not counted as U.S.M.D.’s.
D.O.: Physicians who received their Doctor of Osteopathy (D.O.) degree from a U.S. osteopathic school accredited by the
American Osteopathic Association.
International medical graduate (IMG): An individual who graduated from a medical school outside of the United
States, Puerto Rico, or Canada is considered an international medical graduate (IMG). This includes U.S. citizens who
completed their medical education outside the United States, Puerto Rico, or Canada.
To be eligible for licensure and practice in the United States, all IMGs must be certified by the Educational Commission
for Foreign Medical Graduates (ECFMG) and complete a residency training program in the United States. Graduates
of Canadian medical schools are not considered IMGs because they do not have to be certified by the ECFMG to enter
a residency training program in the United States. Please note that although graduates of Canadian medical schools
who are practicing in the United States are not considered IMGs or U.S.M.D.’s, they are included in the total for active
physicians.
Primary care physicians: Physicians are counted as primary care physicians if their self-designated primary specialty
is one of the following: adolescent medicine, family medicine, general practice, geriatric medicine, internal medicine,
internal medicine/pediatrics, or pediatrics. Residents and fellows are counted as primary care residents and fellows
if they are in one of the following programs: adolescent medicine (pediatrics), family medicine, geriatric medicine
(family medicine), geriatric medicine (internal medicine), geriatric medicine/family practice, geriatric medicine/internal
medicine, internal medicine, internal medicine/family practice, internal medicine/pediatrics, or pediatrics. In the 2009
State Physician Workforce Data Book, the internal medicine/preventive medicine residency program was considered
primary care, but is no longer. There were 29 residents in the internal medicine/preventive medicine program in 2010
and 28 in 2012.
Residents: Physicians who have completed undergraduate medical education and are at any level of training in an
ACGME- or AOA-accredited training program.
Fellows: Physicians who have completed a residency and are pursuing further training in a subspecialty through a
fellowship program accredited by the ACGME.
Medical school: A school that confers the Doctor of Medicine (M.D.) degree and is accredited by the Liaison Committee
on Medical Education.
Osteopathic school: A school that confers the Doctor of Osteopathy (D.O.) degree and is accredited by the American
Osteopathic Association.
Commonly Used Acronyms
AACOM Association of American Colleges of Osteopathic Medicine
AAMC Association of American Medical Colleges
ACGME Accreditation Council for Graduate Medical Education
AMA
American Medical Association
AOA
American Osteopathic Association
D.O.
Doctor of Osteopathy
GME
Graduate Medical Education
IMG
International Medical Graduate
M.D.
Doctor of Medicine
OGME
Osteopathic Graduate Medical Education
Key Findings – Physician Supply
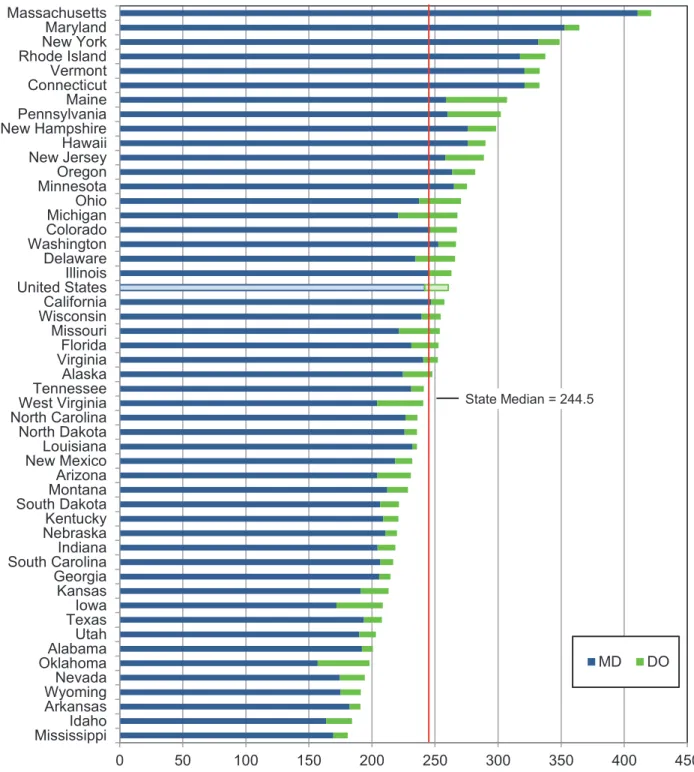
• In 2012, there were 260.5 active physicians per 100,000 population in the United States, ranging from a high of
421.5 in Massachusetts to a low of 180.8 in Mississippi. The states with the highest number of physicians per
100,000 population are concentrated in the Northeast (see Map 1, Figure 1, and Table 1).
Map 1. Total Active Physicians per 100,000 Population, 2012
Map 1. Total Active Physicians Per 100,000 Population, 2012
Map 1. Total Active Physicians Per 100,000 Population, 2012
Source: July 1, 2012 population estimates are from the U.S. Census Bureau (Release date: December 2012). Physician data are
from the AMA Physician Masterfile (December 31, 2012).
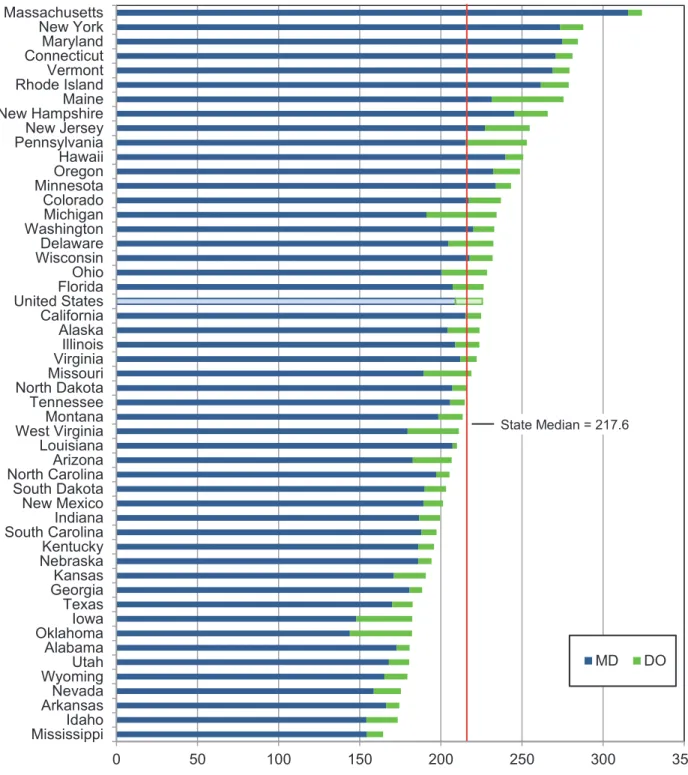
• Nationally in 2012, there were 225.6 physicians active in patient care
2per 100,000 population. Massachusetts had the
highest number of patient care physicians per 100,000 population (324.1), while Mississippi had the lowest (164.4) (see
Figure 2 and Table 2).
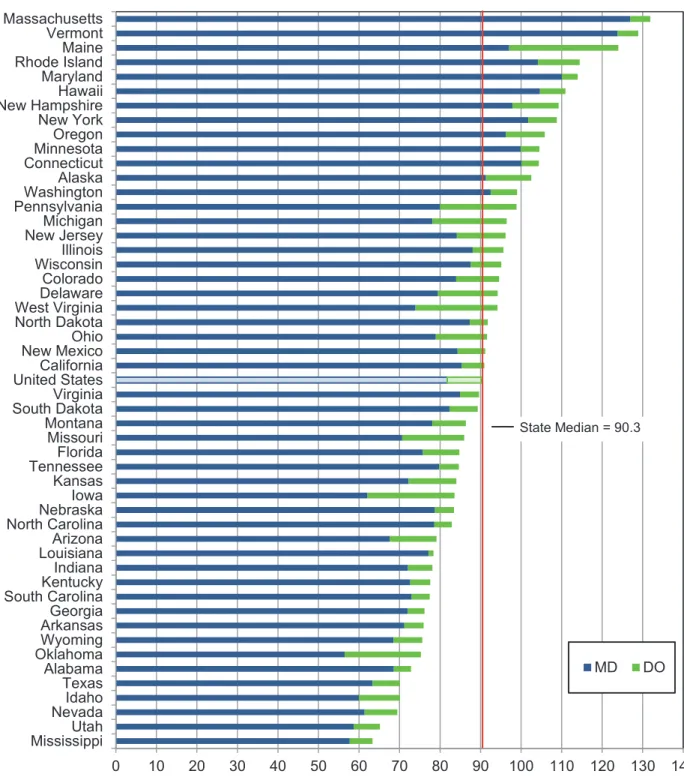
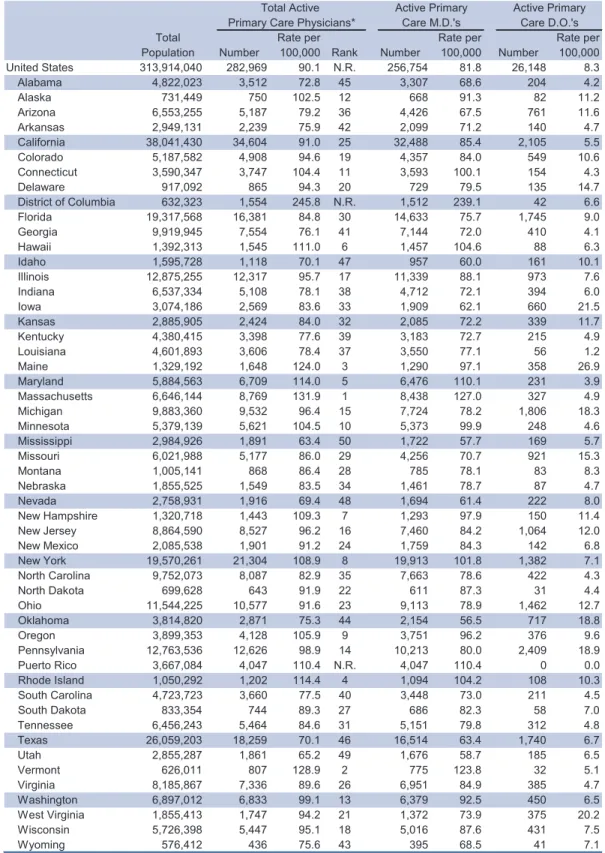
• There were 90.1 primary care physicians per 100,000 population in the United States in 2012. Once again,
Massachusetts was at the top with a value of 131.9, while Mississippi had the lowest number of primary care physicians
per 100,000 population (63.4). The distribution of primary care physicians per 100,000 population is very similar to the
distribution of all physicians per 100,000 population (see Map 2, Figure 3, and Table 3).
Map 2. Primary Care Physicians per 100,000 Population, 2012
Source: July 1, 2012 population estimates are from the U.S. Census Bureau (Release date: December, 2012). Physician data are from
the AMA Physician Masterfile (December 31, 2012).
Map 2. Active Primary Care Physicians Per 100,000 Population, 2012
Map 2. Active Primary Care Physicians Per 100,000 Population, 2012
2 This refers to physicians whose type of practice is categorized as patient care. Physicians whose type of practice is administration, medical research, medical teaching, or other non-patient care activities are not included here.
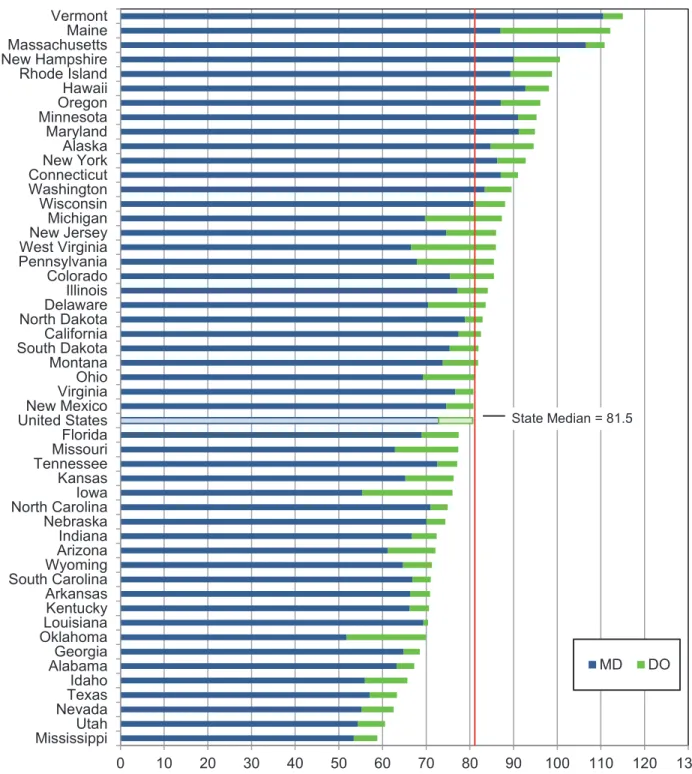
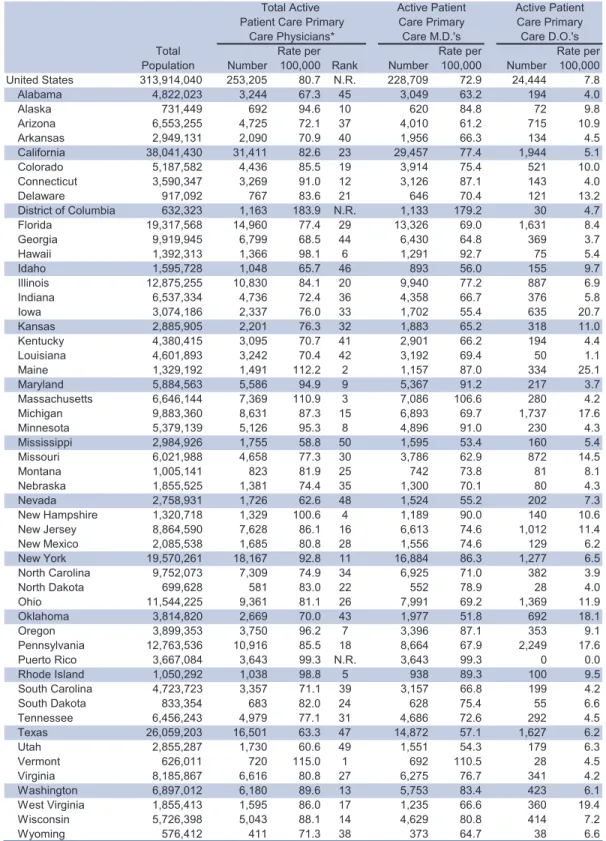
• In 2012, there were 80.7 primary care physicians active in patient care per 100,000 population in the United States,
ranging from a low of 58.8 in Mississippi to a high of 115.0 in Vermont. In Oklahoma and Iowa, D.O.’s represented
more than one-quarter of the patient care primary care physicians. Nationally, D.O.’s comprise approximately 10
per-cent of active patient care primary care physicians (see Figure 4 and Table 4).
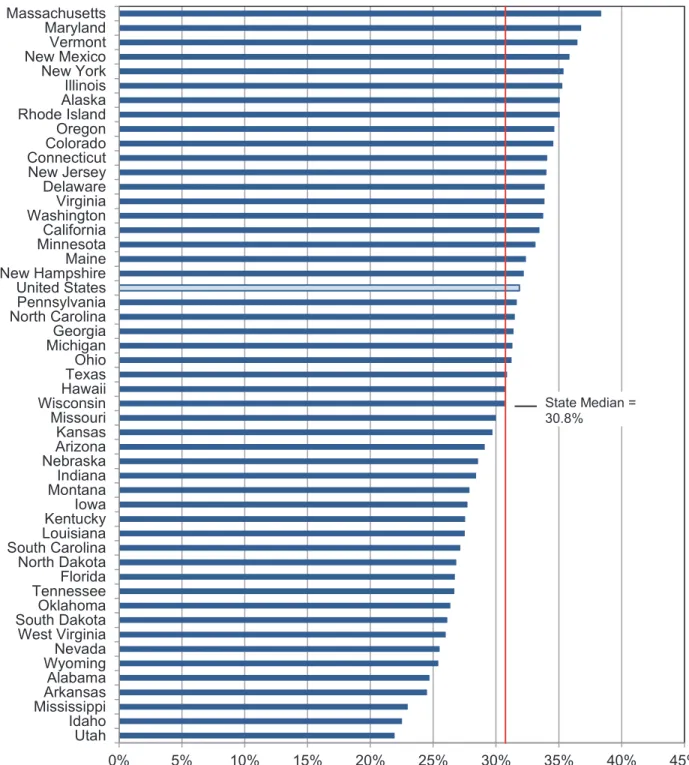
• In 2012, more than one-third (38.4 percent) of active physicians in Massachusetts were female. Utah had the lowest
percentage of female physicians (21.9). Nationally, 31.9 percent of the active physicians were female (see Figure 5 and
Table 5).
• In 2012, states varied widely in the percentage of their physician workforce that graduated from an international
medi-cal school
3(see Map 3, Figure 6, and Table 6). Nationally, 24.1 percent of the physician workforce was IMGs. New
Jersey and New York had the highest percentages (38.6 and 37.5 percent, respectively), while Montana and Idaho had
the lowest (4.6 and 4.5 percent, respectively).
Map 3. Percentage of Active Physicians Who Are IMGs, 2010
Map 3. Percentage of Active Physicians Who Are IMG, 2012
Map 3. Percentage of Active Physicians Who Are IMG, 2012
3 Graduates from Canadian medical schools are not considered IMGs. See Key
Source: AMA Physician Masterfile (December 31, 2012).
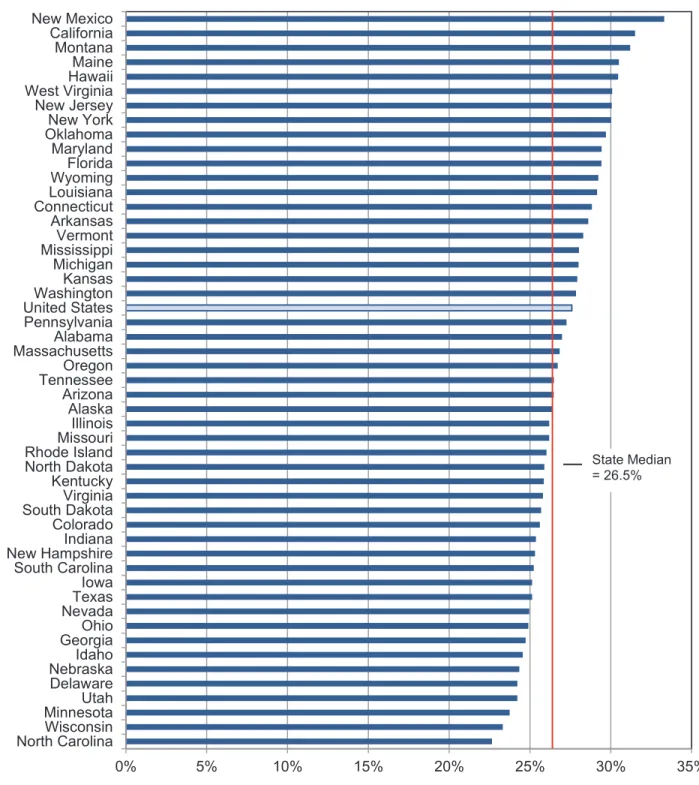
• Nationally, more than one-fourth (27.6 percent) of the active physician workforce was age 60 or older. There was some
variation among the states in the percentage of physicians who were age 60 or older in 2012. New Mexico had the
high-est percentage (33.3), while North Carolina had the lowhigh-est percentage (22.6) (see Figure 7 and Table 7).
are excluded (n=214).
Sources: July 1, 2012 population estimates are from the U.S. Census Bureau (Release date: December 2012). Physician data are from the 2013 AMA Physician Masterfile (December 31, 2012). Physicians whose medical school type was not available
0
50
100
150
200
250
300
350
400
450
Mississippi
Idaho
Arkansas
Wyoming
Nevada
Oklahoma
Alabama
Utah
Texas
Iowa
Kansas
Georgia
South Carolina
Indiana
Nebraska
Kentucky
South Dakota
Montana
Arizona
New Mexico
Louisiana
North Dakota
North Carolina
West Virginia
Tennessee
Alaska
Virginia
Florida
Missouri
Wisconsin
California
United States
Illinois
Delaware
Washington
Colorado
Michigan
Ohio
Minnesota
Oregon
New Jersey
Hawaii
New Hampshire
Pennsylvania
Maine
Connecticut
Vermont
Rhode Island
New York
Maryland
Massachusetts
MD
DO
State Median = 244.5
Figure 1. Active Physicians per 100,000 Population by Degree Type, 2012
Total Rate per Rate per Rate per Population Number 100,000 Rank Number 100,000 Number 100,000 United States 313,914,040 817,850 260.5 N.R. 759,227 241.9 58,409 18.6 Alabama 4,822,023 9,681 200.8 44 9,259 192.0 419 8.7 Alaska 731,449 1,813 247.9 25 1,642 224.5 171 23.4 Arizona 6,553,255 15,133 230.9 32 13,391 204.3 1,738 26.5 Arkansas 2,949,131 5,629 190.9 48 5,377 182.3 252 8.5 California 38,041,430 97,977 257.6 20 93,884 246.8 4,063 10.7 Colorado 5,187,582 13,869 267.3 16 12,767 246.1 1,098 21.2 Connecticut 3,590,347 11,949 332.8 6 11,527 321.1 420 11.7 Delaware 917,092 2,439 265.9 18 2,149 234.3 289 31.5 District of Columbia 632,323 5,559 879.1 N.R. 5,435 859.5 122 19.3 Florida 19,317,568 48,852 252.9 23 44,676 231.3 4,167 21.6 Georgia 9,919,945 21,300 214.7 39 20,402 205.7 893 9.0 Hawaii 1,392,313 4,037 289.9 10 3,843 276.0 194 13.9 Idaho 1,595,728 2,938 184.1 49 2,611 163.6 327 20.5 Illinois 12,875,255 33,874 263.1 19 31,629 245.7 2,234 17.4 Indiana 6,537,334 14,295 218.7 37 13,368 204.5 923 14.1 Iowa 3,074,186 6,414 208.6 41 5,283 171.9 1,131 36.8 Kansas 2,885,905 6,151 213.1 40 5,519 191.2 632 21.9 Kentucky 4,380,415 9,678 220.9 35 9,151 208.9 526 12.0 Louisiana 4,601,893 10,846 235.7 30 10,691 232.3 153 3.3 Maine 1,329,192 4,084 307.3 7 3,438 258.7 645 48.5 Maryland 5,884,563 21,455 364.6 2 20,769 352.9 681 11.6 Massachusetts 6,646,144 28,016 421.5 1 27,294 410.7 708 10.7 Michigan 9,883,360 26,476 267.9 15 21,816 220.7 4,654 47.1 Minnesota 5,379,139 14,814 275.4 13 14,260 265.1 551 10.2 Mississippi 2,984,926 5,396 180.8 50 5,053 169.3 342 11.5 Missouri 6,021,988 15,282 253.8 22 13,330 221.4 1,951 32.4 Montana 1,005,141 2,297 228.5 33 2,132 212.1 165 16.4 Nebraska 1,855,525 4,080 219.9 36 3,907 210.6 172 9.3 Nevada 2,758,931 5,361 194.3 46 4,813 174.5 548 19.9 New Hampshire 1,320,718 3,942 298.5 9 3,648 276.2 294 22.3 New Jersey 8,864,590 25,604 288.8 11 22,891 258.2 2,706 30.5 New Mexico 2,085,538 4,839 232.0 31 4,554 218.4 284 13.6 New York 19,570,261 68,273 348.9 3 64,956 331.9 3,291 16.8 North Carolina 9,752,073 23,034 236.2 28 22,088 226.5 942 9.7 North Dakota 699,628 1,651 236.0 29 1,580 225.8 69 9.9 Ohio 11,544,225 31,248 270.7 14 27,400 237.3 3,836 33.2 Oklahoma 3,814,820 7,552 198.0 45 5,985 156.9 1,567 41.1 Oregon 3,899,353 10,995 282.0 12 10,282 263.7 711 18.2 Pennsylvania 12,763,536 38,565 302.1 8 33,169 259.9 5,385 42.2 Puerto Rico 3,667,084 9,919 270.5 N.R. 9,919 270.5 0 0.0 Rhode Island 1,050,292 3,548 337.8 4 3,334 317.4 210 20.0 South Carolina 4,723,723 10,250 217.0 38 9,767 206.8 479 10.1 South Dakota 833,354 1,846 221.5 34 1,721 206.5 124 14.9 Tennessee 6,456,243 15,568 241.1 26 14,925 231.2 640 9.9 Texas 26,059,203 54,167 207.9 42 50,458 193.6 3,697 14.2 Utah 2,855,287 5,801 203.2 43 5,421 189.9 380 13.3 Vermont 626,011 2,084 332.9 5 2,009 320.9 75 12.0 Virginia 8,185,867 20,647 252.2 24 19,697 240.6 948 11.6 Washington 6,897,012 18,395 266.7 17 17,423 252.6 964 14.0 West Virginia 1,855,413 4,466 240.7 27 3,786 204.1 679 36.6 Wisconsin 5,726,398 14,578 254.6 21 13,707 239.4 867 15.1 Wyoming 576,412 1,102 191.2 47 1,010 175.2 92 16.0 N.R. = Not Ranked
* Physicians whose medical school type was unavailable (n=214) are included in the total.
Total Active Physicians* Active M.D.'s Active D.O.'s
Sources: July 1, 2012 population estimates are from the U.S. Census Bureau (Release date: December 2012). Physician data are from the 2013 AMA Physician Masterfile (December 31, 2012).
are excluded (n=151).
from the 2013 AMA Physician Masterfile (December 31, 2012). Physicians whose medical school type was not available
Sources: July 1, 2012 population estimates are from the U.S. Census Bureau (Release date: December 2012). Physician data are
0
50
100
150
200
250
300
350
Mississippi
Idaho
Arkansas
Nevada
Wyoming
Utah
Alabama
Oklahoma
Iowa
Texas
Georgia
Kansas
Nebraska
Kentucky
South Carolina
Indiana
New Mexico
South Dakota
North Carolina
Arizona
Louisiana
West Virginia
Montana
Tennessee
North Dakota
Missouri
Virginia
Illinois
Alaska
California
United States
Florida
Ohio
Wisconsin
Delaware
Washington
Michigan
Colorado
Minnesota
Oregon
Hawaii
Pennsylvania
New Jersey
New Hampshire
Maine
Rhode Island
Vermont
Connecticut
Maryland
New York
Massachusetts
MD
DO
State Median = 217.6
Figure 2. Active Patient Care Physicians per 100,000 Population by Degree Type, 2012
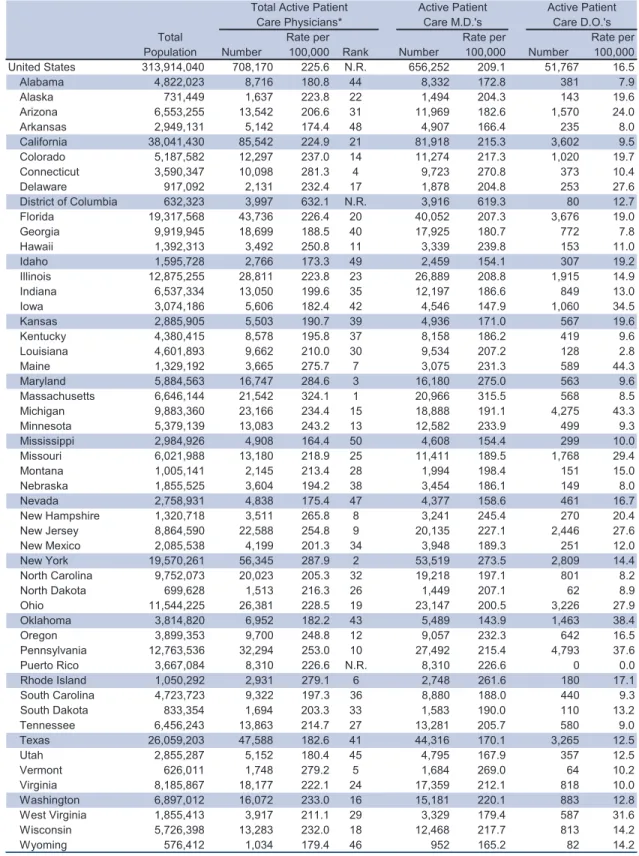
Table 2. Active Patient Care Physicians per 100,000 Population by Degree Type, 2012
Total Rate per Rate per Rate per
Population Number 100,000 Rank Number 100,000 Number 100,000 United States 313,914,040 708,170 225.6 N.R. 656,252 209.1 51,767 16.5 Alabama 4,822,023 8,716 180.8 44 8,332 172.8 381 7.9 Alaska 731,449 1,637 223.8 22 1,494 204.3 143 19.6 Arizona 6,553,255 13,542 206.6 31 11,969 182.6 1,570 24.0 Arkansas 2,949,131 5,142 174.4 48 4,907 166.4 235 8.0 California 38,041,430 85,542 224.9 21 81,918 215.3 3,602 9.5 Colorado 5,187,582 12,297 237.0 14 11,274 217.3 1,020 19.7 Connecticut 3,590,347 10,098 281.3 4 9,723 270.8 373 10.4 Delaware 917,092 2,131 232.4 17 1,878 204.8 253 27.6 District of Columbia 632,323 3,997 632.1 N.R. 3,916 619.3 80 12.7 Florida 19,317,568 43,736 226.4 20 40,052 207.3 3,676 19.0 Georgia 9,919,945 18,699 188.5 40 17,925 180.7 772 7.8 Hawaii 1,392,313 3,492 250.8 11 3,339 239.8 153 11.0 Idaho 1,595,728 2,766 173.3 49 2,459 154.1 307 19.2 Illinois 12,875,255 28,811 223.8 23 26,889 208.8 1,915 14.9 Indiana 6,537,334 13,050 199.6 35 12,197 186.6 849 13.0 Iowa 3,074,186 5,606 182.4 42 4,546 147.9 1,060 34.5 Kansas 2,885,905 5,503 190.7 39 4,936 171.0 567 19.6 Kentucky 4,380,415 8,578 195.8 37 8,158 186.2 419 9.6 Louisiana 4,601,893 9,662 210.0 30 9,534 207.2 128 2.8 Maine 1,329,192 3,665 275.7 7 3,075 231.3 589 44.3 Maryland 5,884,563 16,747 284.6 3 16,180 275.0 563 9.6 Massachusetts 6,646,144 21,542 324.1 1 20,966 315.5 568 8.5 Michigan 9,883,360 23,166 234.4 15 18,888 191.1 4,275 43.3 Minnesota 5,379,139 13,083 243.2 13 12,582 233.9 499 9.3 Mississippi 2,984,926 4,908 164.4 50 4,608 154.4 299 10.0 Missouri 6,021,988 13,180 218.9 25 11,411 189.5 1,768 29.4 Montana 1,005,141 2,145 213.4 28 1,994 198.4 151 15.0 Nebraska 1,855,525 3,604 194.2 38 3,454 186.1 149 8.0 Nevada 2,758,931 4,838 175.4 47 4,377 158.6 461 16.7 New Hampshire 1,320,718 3,511 265.8 8 3,241 245.4 270 20.4 New Jersey 8,864,590 22,588 254.8 9 20,135 227.1 2,446 27.6 New Mexico 2,085,538 4,199 201.3 34 3,948 189.3 251 12.0 New York 19,570,261 56,345 287.9 2 53,519 273.5 2,809 14.4 North Carolina 9,752,073 20,023 205.3 32 19,218 197.1 801 8.2 North Dakota 699,628 1,513 216.3 26 1,449 207.1 62 8.9 Ohio 11,544,225 26,381 228.5 19 23,147 200.5 3,226 27.9 Oklahoma 3,814,820 6,952 182.2 43 5,489 143.9 1,463 38.4 Oregon 3,899,353 9,700 248.8 12 9,057 232.3 642 16.5 Pennsylvania 12,763,536 32,294 253.0 10 27,492 215.4 4,793 37.6 Puerto Rico 3,667,084 8,310 226.6 N.R. 8,310 226.6 0 0.0 Rhode Island 1,050,292 2,931 279.1 6 2,748 261.6 180 17.1 South Carolina 4,723,723 9,322 197.3 36 8,880 188.0 440 9.3 South Dakota 833,354 1,694 203.3 33 1,583 190.0 110 13.2 Tennessee 6,456,243 13,863 214.7 27 13,281 205.7 580 9.0 Texas 26,059,203 47,588 182.6 41 44,316 170.1 3,265 12.5 Utah 2,855,287 5,152 180.4 45 4,795 167.9 357 12.5 Vermont 626,011 1,748 279.2 5 1,684 269.0 64 10.2 Virginia 8,185,867 18,177 222.1 24 17,359 212.1 818 10.0 Washington 6,897,012 16,072 233.0 16 15,181 220.1 883 12.8 West Virginia 1,855,413 3,917 211.1 29 3,329 179.4 587 31.6 Wisconsin 5,726,398 13,283 232.0 18 12,468 217.7 813 14.2
Wyoming 576,412 1,034 179.4 46 952 165.2 82 14.2
N.R. = Not Ranked
Sources: July 1, 2012 population estimates are from the U.S. Census Bureau (Release date: December 2012). Physician data are from the 2013 AMA Physician Masterfile (December 31, 2012).
Care M.D.'s Care D.O.'s Active Patient Active Patient Total Active Patient
Sources: July 1, 2012 population estimates are from the U.S. Census Bureau (Release date: December 2012). Physician data are from the 2013 AMA Physician Masterfile (December 31, 2012). Physicians whose medical school type was unavailable
are excluded (n=67).
0
10
20
30
40
50
60
70
80
90 100 110 120 130 140
Mississippi
Utah
Nevada
Idaho
Texas
Alabama
Oklahoma
Wyoming
Arkansas
Georgia
South Carolina
Kentucky
Indiana
Louisiana
Arizona
North Carolina
Nebraska
Iowa
Kansas
Tennessee
Florida
Missouri
Montana
South Dakota
Virginia
United States
California
New Mexico
Ohio
North Dakota
West Virginia
Delaware
Colorado
Wisconsin
Illinois
New Jersey
Michigan
Pennsylvania
Washington
Alaska
Connecticut
Minnesota
Oregon
New York
New Hampshire
Hawaii
Maryland
Rhode Island
Maine
Vermont
Massachusetts
MD
DO
State Median = 90.3
Figure 3. Active Primary Care Physicians per 100,000 Population by Degree Type, 2012
Table 3. Active Primary Care Physicians per 100,000 Population by Degree Type, 2012
Total Rate per Rate per Rate per
Population Number 100,000 Rank Number 100,000 Number 100,000 United States 313,914,040 282,969 90.1 N.R. 256,754 81.8 26,148 8.3 Alabama 4,822,023 3,512 72.8 45 3,307 68.6 204 4.2
Alaska 731,449 750 102.5 12 668 91.3 82 11.2
Arizona 6,553,255 5,187 79.2 36 4,426 67.5 761 11.6 Arkansas 2,949,131 2,239 75.9 42 2,099 71.2 140 4.7 California 38,041,430 34,604 91.0 25 32,488 85.4 2,105 5.5 Colorado 5,187,582 4,908 94.6 19 4,357 84.0 549 10.6 Connecticut 3,590,347 3,747 104.4 11 3,593 100.1 154 4.3 Delaware 917,092 865 94.3 20 729 79.5 135 14.7 District of Columbia 632,323 1,554 245.8 N.R. 1,512 239.1 42 6.6 Florida 19,317,568 16,381 84.8 30 14,633 75.7 1,745 9.0 Georgia 9,919,945 7,554 76.1 41 7,144 72.0 410 4.1 Hawaii 1,392,313 1,545 111.0 6 1,457 104.6 88 6.3 Idaho 1,595,728 1,118 70.1 47 957 60.0 161 10.1 Illinois 12,875,255 12,317 95.7 17 11,339 88.1 973 7.6 Indiana 6,537,334 5,108 78.1 38 4,712 72.1 394 6.0 Iowa 3,074,186 2,569 83.6 33 1,909 62.1 660 21.5 Kansas 2,885,905 2,424 84.0 32 2,085 72.2 339 11.7 Kentucky 4,380,415 3,398 77.6 39 3,183 72.7 215 4.9 Louisiana 4,601,893 3,606 78.4 37 3,550 77.1 56 1.2 Maine 1,329,192 1,648 124.0 3 1,290 97.1 358 26.9 Maryland 5,884,563 6,709 114.0 5 6,476 110.1 231 3.9 Massachusetts 6,646,144 8,769 131.9 1 8,438 127.0 327 4.9 Michigan 9,883,360 9,532 96.4 15 7,724 78.2 1,806 18.3 Minnesota 5,379,139 5,621 104.5 10 5,373 99.9 248 4.6 Mississippi 2,984,926 1,891 63.4 50 1,722 57.7 169 5.7 Missouri 6,021,988 5,177 86.0 29 4,256 70.7 921 15.3
Montana 1,005,141 868 86.4 28 785 78.1 83 8.3
Nebraska 1,855,525 1,549 83.5 34 1,461 78.7 87 4.7 Nevada 2,758,931 1,916 69.4 48 1,694 61.4 222 8.0 New Hampshire 1,320,718 1,443 109.3 7 1,293 97.9 150 11.4 New Jersey 8,864,590 8,527 96.2 16 7,460 84.2 1,064 12.0 New Mexico 2,085,538 1,901 91.2 24 1,759 84.3 142 6.8 New York 19,570,261 21,304 108.9 8 19,913 101.8 1,382 7.1 North Carolina 9,752,073 8,087 82.9 35 7,663 78.6 422 4.3 North Dakota 699,628 643 91.9 22 611 87.3 31 4.4 Ohio 11,544,225 10,577 91.6 23 9,113 78.9 1,462 12.7 Oklahoma 3,814,820 2,871 75.3 44 2,154 56.5 717 18.8 Oregon 3,899,353 4,128 105.9 9 3,751 96.2 376 9.6 Pennsylvania 12,763,536 12,626 98.9 14 10,213 80.0 2,409 18.9 Puerto Rico 3,667,084 4,047 110.4 N.R. 4,047 110.4 0 0.0 Rhode Island 1,050,292 1,202 114.4 4 1,094 104.2 108 10.3 South Carolina 4,723,723 3,660 77.5 40 3,448 73.0 211 4.5 South Dakota 833,354 744 89.3 27 686 82.3 58 7.0 Tennessee 6,456,243 5,464 84.6 31 5,151 79.8 312 4.8 Texas 26,059,203 18,259 70.1 46 16,514 63.4 1,740 6.7 Utah 2,855,287 1,861 65.2 49 1,676 58.7 185 6.5
Vermont 626,011 807 128.9 2 775 123.8 32 5.1
Virginia 8,185,867 7,336 89.6 26 6,951 84.9 385 4.7 Washington 6,897,012 6,833 99.1 13 6,379 92.5 450 6.5 West Virginia 1,855,413 1,747 94.2 21 1,372 73.9 375 20.2 Wisconsin 5,726,398 5,447 95.1 18 5,016 87.6 431 7.5
Wyoming 576,412 436 75.6 43 395 68.5 41 7.1
N.R. = Not Ranked
* Physicians whose medical school type was unavailable (n=67) are included in the total.
Sources: July 1, 2012 population estimates are from the U.S. Census Bureau (Release date: December 2012). Physician data are from the 2013 AMA Physician Masterfile (December 31, 2012).
are excluded (n=52).
Sources: July 1, 2012 population estimates are from the U.S. Census Bureau (Release date: December 2012). Physician data are from the 2013 AMA Physician Masterfile (December 31, 2012). Physicians whose medical school type was unavailable
0
10
20
30
40
50
60
70
80
90
100 110 120 130
Mississippi
Utah
Nevada
Texas
Idaho
Alabama
Georgia
Oklahoma
Louisiana
Kentucky
Arkansas
South Carolina
Wyoming
Arizona
Indiana
Nebraska
North Carolina
Iowa
Kansas
Tennessee
Missouri
Florida
United States
New Mexico
Virginia
Ohio
Montana
South Dakota
California
North Dakota
Delaware
Illinois
Colorado
Pennsylvania
West Virginia
New Jersey
Michigan
Wisconsin
Washington
Connecticut
New York
Alaska
Maryland
Minnesota
Oregon
Hawaii
Rhode Island
New Hampshire
Massachusetts
Maine
Vermont
MD
DO
State Median = 81.5
Figure 4. Active Patient Care Primary Care Physicians per 100,000 Population by Degree Type, 2012
Table 4. Active Patient Care Primary Care Physicians per 100,000 Population by Degree Type, 2012
Total Rate per Rate per Rate per
Population Number 100,000 Rank Number 100,000 Number 100,000 United States 313,914,040 253,205 80.7 N.R. 228,709 72.9 24,444 7.8 Alabama 4,822,023 3,244 67.3 45 3,049 63.2 194 4.0
Alaska 731,449 692 94.6 10 620 84.8 72 9.8
Arizona 6,553,255 4,725 72.1 37 4,010 61.2 715 10.9 Arkansas 2,949,131 2,090 70.9 40 1,956 66.3 134 4.5 California 38,041,430 31,411 82.6 23 29,457 77.4 1,944 5.1 Colorado 5,187,582 4,436 85.5 19 3,914 75.4 521 10.0 Connecticut 3,590,347 3,269 91.0 12 3,126 87.1 143 4.0 Delaware 917,092 767 83.6 21 646 70.4 121 13.2 District of Columbia 632,323 1,163 183.9 N.R. 1,133 179.2 30 4.7 Florida 19,317,568 14,960 77.4 29 13,326 69.0 1,631 8.4 Georgia 9,919,945 6,799 68.5 44 6,430 64.8 369 3.7 Hawaii 1,392,313 1,366 98.1 6 1,291 92.7 75 5.4 Idaho 1,595,728 1,048 65.7 46 893 56.0 155 9.7 Illinois 12,875,255 10,830 84.1 20 9,940 77.2 887 6.9 Indiana 6,537,334 4,736 72.4 36 4,358 66.7 376 5.8 Iowa 3,074,186 2,337 76.0 33 1,702 55.4 635 20.7 Kansas 2,885,905 2,201 76.3 32 1,883 65.2 318 11.0 Kentucky 4,380,415 3,095 70.7 41 2,901 66.2 194 4.4 Louisiana 4,601,893 3,242 70.4 42 3,192 69.4 50 1.1 Maine 1,329,192 1,491 112.2 2 1,157 87.0 334 25.1 Maryland 5,884,563 5,586 94.9 9 5,367 91.2 217 3.7 Massachusetts 6,646,144 7,369 110.9 3 7,086 106.6 280 4.2 Michigan 9,883,360 8,631 87.3 15 6,893 69.7 1,737 17.6 Minnesota 5,379,139 5,126 95.3 8 4,896 91.0 230 4.3 Mississippi 2,984,926 1,755 58.8 50 1,595 53.4 160 5.4 Missouri 6,021,988 4,658 77.3 30 3,786 62.9 872 14.5
Montana 1,005,141 823 81.9 25 742 73.8 81 8.1
Nebraska 1,855,525 1,381 74.4 35 1,300 70.1 80 4.3 Nevada 2,758,931 1,726 62.6 48 1,524 55.2 202 7.3 New Hampshire 1,320,718 1,329 100.6 4 1,189 90.0 140 10.6 New Jersey 8,864,590 7,628 86.1 16 6,613 74.6 1,012 11.4 New Mexico 2,085,538 1,685 80.8 28 1,556 74.6 129 6.2 New York 19,570,261 18,167 92.8 11 16,884 86.3 1,277 6.5 North Carolina 9,752,073 7,309 74.9 34 6,925 71.0 382 3.9 North Dakota 699,628 581 83.0 22 552 78.9 28 4.0 Ohio 11,544,225 9,361 81.1 26 7,991 69.2 1,369 11.9 Oklahoma 3,814,820 2,669 70.0 43 1,977 51.8 692 18.1 Oregon 3,899,353 3,750 96.2 7 3,396 87.1 353 9.1 Pennsylvania 12,763,536 10,916 85.5 18 8,664 67.9 2,249 17.6 Puerto Rico 3,667,084 3,643 99.3 N.R. 3,643 99.3 0 0.0 Rhode Island 1,050,292 1,038 98.8 5 938 89.3 100 9.5 South Carolina 4,723,723 3,357 71.1 39 3,157 66.8 199 4.2 South Dakota 833,354 683 82.0 24 628 75.4 55 6.6 Tennessee 6,456,243 4,979 77.1 31 4,686 72.6 292 4.5 Texas 26,059,203 16,501 63.3 47 14,872 57.1 1,627 6.2 Utah 2,855,287 1,730 60.6 49 1,551 54.3 179 6.3
Vermont 626,011 720 115.0 1 692 110.5 28 4.5
Virginia 8,185,867 6,616 80.8 27 6,275 76.7 341 4.2 Washington 6,897,012 6,180 89.6 13 5,753 83.4 423 6.1 West Virginia 1,855,413 1,595 86.0 17 1,235 66.6 360 19.4 Wisconsin 5,726,398 5,043 88.1 14 4,629 80.8 414 7.2
Wyoming 576,412 411 71.3 38 373 64.7 38 6.6
N.R. = Not Ranked
* Physicians whose medical school type was unavailable (n=52) are included in the total.
Sources: July 1, 2012 population estimates are from the U.S. Census Bureau (Release date: December 2012). Physician data are from the 2013 AMA Physician Masterfile (December 31, 2012).
Care Physicians* Care M.D.'s Care D.O.'s Total Active Active Patient Active Patient Patient Care Primary Care Primary Care Primary
Source: AMA Physician Masterfile (December 31, 2012). Physicians whose sex was unavailable (n=1,097) are excluded.
0%
5%
10%
15%
20%
25%
30%
35%
40%
45%
Utah
Idaho
Mississippi
Arkansas
Alabama
Wyoming
Nevada
West Virginia
South Dakota
Oklahoma
Tennessee
Florida
North Dakota
South Carolina
Louisiana
Kentucky
Iowa
Montana
Indiana
Nebraska
Arizona
Kansas
Missouri
Wisconsin
Hawaii
Texas
Ohio
Michigan
Georgia
North Carolina
Pennsylvania
United States
New Hampshire
Maine
Minnesota
California
Washington
Virginia
Delaware
New Jersey
Connecticut
Colorado
Oregon
Rhode Island
Alaska
Illinois
New York
New Mexico
Vermont
Maryland
Massachusetts
State Median =
30.8%
Table 5. Active Female Physicians, 2012
Total Active
Physicians* Number Percent Rank United States 816,753 260,221 31.9% N.R.
Alabama 9,674 2,390 24.7% 46
Alaska 1,810 635 35.1% 7
Arizona 15,104 4,395 29.1% 30
Arkansas 5,624 1,378 24.5% 47
California 97,788 32,718 33.5% 16
Colorado 13,855 4,789 34.6% 10
Connecticut 11,940 4,068 34.1% 11
Delaware 2,438 826 33.9% 13
District of Columbia 5,553 2,334 42.0% N.R.
Florida 48,788 13,040 26.7% 39
Georgia 21,283 6,682 31.4% 22
Hawaii 4,032 1,240 30.8% 26
Idaho 2,935 661 22.5% 49
Illinois 33,825 11,933 35.3% 6
Indiana 14,278 4,058 28.4% 32
Iowa 6,402 1,775 27.7% 34
Kansas 6,146 1,827 29.7% 29
Kentucky 9,670 2,664 27.5% 35
Louisiana 10,840 2,982 27.5% 36
Maine 4,080 1,321 32.4% 18
Maryland 21,428 7,881 36.8% 2
Massachusetts 27,982 10,735 38.4% 1
Michigan 26,429 8,274 31.3% 23
Minnesota 14,798 4,904 33.1% 17
Mississippi 5,391 1,239 23.0% 48
Missouri 15,269 4,582 30.0% 28
Montana 2,295 640 27.9% 33
Nebraska 4,077 1,165 28.6% 31
Nevada 5,350 1,365 25.5% 44
New Hampshire 3,940 1,269 32.2% 19
New Jersey 25,551 8,691 34.0% 12
New Mexico 4,834 1,733 35.9% 4
New York 68,152 24,112 35.4% 5
North Carolina 23,020 7,250 31.5% 21
North Dakota 1,650 443 26.8% 38
Ohio 31,206 9,747 31.2% 24
Oklahoma 7,537 1,987 26.4% 41
Oregon 10,982 3,805 34.6% 9
Pennsylvania 38,520 12,195 31.7% 20
Puerto Rico 9,890 3,528 35.7% N.R.
Rhode Island 3,546 1,244 35.1% 8
South Carolina 10,239 2,781 27.2% 37
South Dakota 1,845 482 26.1% 42
Tennessee 15,562 4,153 26.7% 40
Texas 54,081 16,700 30.9% 25
Utah 5,795 1,271 21.9% 50
Vermont 2,083 760 36.5% 3
Virginia 20,622 6,983 33.9% 14
Washington 18,375 6,203 33.8% 15
West Virginia 4,458 1,159 26.0% 43
Wisconsin 14,569 4,472 30.7% 27
Wyoming 1,102 280 25.4% 45
Source: AMA Physician Masterfile (December 31, 2012) N.R. = Not Ranked
* Physicians whose sex was missing (n=1,097) are excluded.
Source: AMA Physician Masterfile (December 31, 2012). Physicians whose medical school type was unavailable are excluded (n=214). Physicians who are graduates of Canadian medical schools are not included (n=9,495).
0%
10%
20%
30%
40%
50%
Idaho
Montana
Alaska
Colorado
Vermont
Utah
Oregon
Wyoming
Maine
Hawaii
Nebraska
Washington
South Dakota
Mississippi
South Carolina
North Carolina
Minnesota
New Hampshire
Arkansas
Alabama
Tennessee
Oklahoma
Kansas
New Mexico
Iowa
Wisconsin
Louisiana
Missouri
Georgia
Kentucky
Virginia
Indiana
Massachusetts
Pennsylvania
Arizona
United States
Texas
California
Ohio
North Dakota
Rhode Island
Delaware
Maryland
Connecticut
Nevada
West Virginia
Michigan
Illinois
Florida
New York
New Jersey
State Median = 18.2%
Table 6. Active Physicians by Medical School Type, 2012
Number Percent Number Percent Number Percent Rank United States 817,636 552,925 67.6% 58,409 7.1% 196,807 24.1% N.R. Alabama 9,678 7,543 77.9% 419 4.3% 1,613 16.7% 31
Alaska 1,813 1,513 83.5% 171 9.4% 115 6.3% 48
Arizona 15,129 9,662 63.9% 1,738 11.5% 3,461 22.9% 16 Arkansas 5,629 4,434 78.8% 252 4.5% 904 16.1% 32 California 97,947 68,510 69.9% 4,063 4.1% 23,937 24.4% 14 Colorado 13,865 11,557 83.4% 1,098 7.9% 1,059 7.6% 47 Connecticut 11,947 8,069 67.5% 420 3.5% 3,341 28.0% 8 Delaware 2,438 1,488 61.0% 289 11.9% 644 26.4% 10 District of Columbia 5,557 4,160 74.9% 122 2.2% 1,222 22.0% N.R. Florida 48,843 26,985 55.2% 4,167 8.5% 17,253 35.3% 3 Georgia 21,295 15,839 74.4% 893 4.2% 4,381 20.6% 22 Hawaii 4,037 3,258 80.7% 194 4.8% 527 13.1% 41
Idaho 2,938 2,441 83.1% 327 11.1% 131 4.5% 50
Illinois 33,863 20,722 61.2% 2,234 6.6% 10,637 31.4% 4 Indiana 14,291 10,220 71.5% 923 6.5% 2,998 21.0% 19 Iowa 6,414 4,056 63.2% 1,131 17.6% 1,154 18.0% 26 Kansas 6,151 4,419 71.8% 632 10.3% 1,055 17.2% 28 Kentucky 9,677 7,048 72.8% 526 5.4% 1,991 20.6% 21 Louisiana 10,844 8,529 78.7% 153 1.4% 2,091 19.3% 24 Maine 4,083 2,812 68.9% 645 15.8% 528 12.9% 42 Maryland 21,450 14,855 69.3% 681 3.2% 5,703 26.6% 9 Massachusetts 28,002 20,215 72.2% 708 2.5% 6,362 22.7% 18 Michigan 26,470 13,860 52.4% 4,654 17.6% 7,691 29.1% 5 Minnesota 14,811 11,548 78.0% 551 3.7% 2,340 15.8% 34 Mississippi 5,395 4,276 79.3% 342 6.3% 746 13.8% 37 Missouri 15,281 10,196 66.7% 1,951 12.8% 3,043 19.9% 23 Montana 2,297 2,011 87.5% 165 7.2% 105 4.6% 49 Nebraska 4,079 3,331 81.7% 172 4.2% 541 13.3% 40 Nevada 5,361 3,244 60.5% 548 10.2% 1,516 28.3% 7 New Hampshire 3,942 2,899 73.5% 294 7.5% 628 15.9% 33 New Jersey 25,597 12,900 50.4% 2,706 10.6% 9,878 38.6% 1 New Mexico 4,838 3,649 75.4% 284 5.9% 862 17.8% 27 New York 68,247 38,548 56.5% 3,291 4.8% 25,595 37.5% 2 North Carolina 23,030 18,540 80.5% 942 4.1% 3,327 14.4% 35 North Dakota 1,649 1,099 66.6% 69 4.2% 415 25.2% 12 Ohio 31,236 19,210 61.5% 3,836 12.3% 7,829 25.1% 13 Oklahoma 7,552 4,653 61.6% 1,567 20.7% 1,288 17.1% 29 Oregon 10,993 9,036 82.2% 711 6.5% 1,055 9.6% 44 Pennsylvania 38,554 24,073 62.4% 5,385 14.0% 8,783 22.8% 17 Puerto Rico 9,919 4,683 47.2% 0 0.0% 5,236 52.8% N.R. Rhode Island 3,544 2,379 67.1% 210 5.9% 901 25.4% 11 South Carolina 10,246 8,258 80.6% 479 4.7% 1,462 14.3% 36 South Dakota 1,845 1,457 79.0% 124 6.7% 254 13.8% 38 Tennessee 15,565 12,171 78.2% 640 4.1% 2,602 16.7% 30 Texas 54,155 36,702 67.8% 3,697 6.8% 13,216 24.4% 15
Utah 5,801 4,845 83.5% 380 6.6% 518 8.9% 45
Vermont 2,084 1,743 83.6% 75 3.6% 185 8.9% 46
Virginia 20,645 15,209 73.7% 948 4.6% 4,323 20.9% 20 Washington 18,387 14,496 78.8% 964 5.2% 2,499 13.6% 39 West Virginia 4,465 2,468 55.3% 679 15.2% 1,291 28.9% 6 Wisconsin 14,574 10,909 74.9% 867 5.9% 2,682 18.4% 25
Wyoming 1,102 880 79.9% 92 8.3% 125 11.3% 43
Source: AMA Physician Masterfile (December 31, 2012) N.R. = Not Ranked
* The total excludes active physicians whose medical school type was unavailable (n=214). Physicians who are graduates of Total Active
U.S.M.D. D.O. IMG
Number Physicians*
Source: AMA Physician Masterfile (December 31, 2012). Physicians whose age was unavailable are excluded (n=1,417).
0%
5%
10%
15%
20%
25%
30%
35%
North Carolina
Wisconsin
Minnesota
Utah
Delaware
Nebraska
Idaho
Georgia
Ohio
Nevada
Texas
Iowa
South Carolina
New Hampshire
Indiana
Colorado
South Dakota
Virginia
Kentucky
North Dakota
Rhode Island
Missouri
Illinois
Alaska
Arizona
Tennessee
Oregon
Massachusetts
Alabama
Pennsylvania
United States
Washington
Kansas
Michigan
Mississippi
Vermont
Arkansas
Connecticut
Louisiana
Wyoming
Florida
Maryland
Oklahoma
New York
New Jersey
West Virginia
Hawaii
Maine
Montana
California
New Mexico
State Median
= 26.5%
Figure 7. Percentage of Active Physicians Who are Age 60 or Older, 2012
Table 7. Active Physicians by Selected Age Groups, 2012
Number Percent Number Percent Rank United States 816,433 140,084 17.2% 225,221 27.6% N.R.
Alabama 9,679 1,522 15.7% 2,612 27.0% 22
Alaska 1,806 266 14.7% 477 26.4% 27
Arizona 15,065 2,362 15.7% 3,988 26.5% 26
Arkansas 5,625 917 16.3% 1,609 28.6% 15
California 97,884 15,767 16.1% 30,835 31.5% 2
Colorado 13,855 2,246 16.2% 3,548 25.6% 35
Connecticut 11,939 1,966 16.5% 3,442 28.8% 14
Delaware 2,436 411 16.9% 590 24.2% 46
District of Columbia 5,558 1,328 23.9% 1,653 29.7% N.R.
Florida 48,673 6,538 13.4% 14,318 29.4% 11
Georgia 21,290 3,568 16.8% 5,266 24.7% 43
Hawaii 4,036 640 15.9% 1,229 30.5% 5
Idaho 2,936 414 14.1% 721 24.6% 44
Illinois 33,844 6,653 19.7% 8,865 26.2% 28
Indiana 14,290 2,405 16.8% 3,625 25.4% 36
Iowa 6,398 1,203 18.8% 1,608 25.1% 39
Kansas 6,144 1,160 18.9% 1,716 27.9% 19
Kentucky 9,664 1,775 18.4% 2,499 25.9% 32
Louisiana 10,843 1,995 18.4% 3,161 29.2% 13
Maine 4,076 528 13.0% 1,243 30.5% 4
Maryland 21,428 3,639 17.0% 6,307 29.4% 10
Massachusetts 28,006 5,338 19.1% 7,516 26.8% 23
Michigan 26,247 4,638 17.7% 7,352 28.0% 18
Minnesota 14,808 2,705 18.3% 3,516 23.7% 48
Mississippi 5,391 842 15.6% 1,511 28.0% 17
Missouri 15,259 2,978 19.5% 3,996 26.2% 29
Montana 2,295 260 11.3% 716 31.2% 3
Nebraska 4,072 808 19.8% 991 24.3% 45
Nevada 5,337 751 14.1% 1,332 25.0% 41
New Hampshire 3,939 565 14.3% 997 25.3% 37
New Jersey 25,557 3,712 14.5% 7,682 30.1% 7
New Mexico 4,834 663 13.7% 1,610 33.3% 1
New York 68,200 11,985 17.6% 20,474 30.0% 8 North Carolina 23,027 4,166 18.1% 5,214 22.6% 50
North Dakota 1,649 342 20.7% 427 25.9% 31
Ohio 31,097 5,981 19.2% 7,742 24.9% 42
Oklahoma 7,531 1,251 16.6% 2,237 29.7% 9
Oregon 10,977 1,818 16.6% 2,932 26.7% 24
Pennsylvania 38,438 7,125 18.5% 10,478 27.3% 21 Puerto Rico 9,889 1,581 16.0% 2,976 30.1% N.R.
Rhode Island 3,547 644 18.2% 923 26.0% 30
South Carolina 10,248 1,753 17.1% 2,586 25.2% 38
South Dakota 1,841 341 18.5% 473 25.7% 34
Tennessee 15,556 2,463 15.8% 4,119 26.5% 25
Texas 54,117 10,464 19.3% 13,599 25.1% 40
Utah 5,794 1,032 17.8% 1,403 24.2% 47
Vermont 2,082 273 13.1% 589 28.3% 16
Virginia 20,628 3,478 16.9% 5,322 25.8% 33
Washington 18,384 2,929 15.9% 5,119 27.8% 20 West Virginia 4,444 796 17.9% 1,337 30.1% 6 Wisconsin 14,561 2,521 17.3% 3,395 23.3% 49
Wyoming 1,098 159 14.5% 321 29.2% 12
Source: AMA Physician Masterfile (December 31, 2012) N.R. = Not Ranked
Active Total
Under Age 40 Age 60 or Older Number
Map 4. Medical and Osteopathic Students Per 100,000 Population
2012-2013 Academic Year
Map 4. Medical and Osteopathic Students Per 100,000 Population
2012-2013 Academic Year
Key Findings – Undergraduate Medical Education
• During the 2012–2013 academic year, there were 32.7 students per 100,000 population enrolled in medical and
osteo-pathic schools
1in the United States. The states with the highest student-to-population ratio were concentrated in the
Northeast and the Midwest (see Map 4, Figure 8, and Table 8).
Map 4. Medical and Osteopathic Students per 100,000 Population, 2012–2013 Academic Year
Sources: Medical enrollment data are from the AAMC Data Warehouse, accessed online Aug. 13, 2013, at https://www.aamc.org/
data/facts. Osteopathic enrollment data are from the AACOM Web site: http://www.aacom.org/data/studentenrollment/Pages/
default.aspx (accessed Aug. 14, 2013). July 1, 2012 population estimates are from the U.S. Census Bureau (Release date: December
2012).
• More than half (60.2 percent) of the students enrolled in medical schools in the United States were enrolled in public
schools, while only one-fifth of students enrolled in osteopathic schools (20.4 percent) were enrolled in public schools.
The rate of students enrolled in public medical or osteopathic schools per 100,000 population varied widely across
states where a public school exists, from a low of 8.5 in Massachusetts to a high of 84.6 in West Virginia (see Map 5,
Figure 9, and Table 9). In the United States overall, there were 16.9 students per 100,000 population enrolled in public
medical and osteopathic schools.
Map 5. Public Medical and Osteopathic Students Per 100,000 Population
2012-2013 Academic Year
Map 5. Public Medical and Osteopathic Students Per 100,000 Population
2012-2013 Academic Year
Sources: Medical enrollment data are from the AAMC Data Warehouse, accessed online Aug. 13, 2013, at https://www.
aamc.org/data/facts. Osteopathic enrollment data are from the AACOM Web site:
http://www.aacom.org/data/studenten-rollment/Pages/default.aspx (accessed Aug. 14, 2013). July 1, 2012 population estimates are from the U.S. Census Bureau
(Release date: December 2012).
Map 5. Public Medical and Osteopathic Students per 100,000 Population, 2012–2013 Academic Year
• Between the 2002–2003 and 2012–2013 academic years, the total number of students enrolled in medical or osteopathic
schools increased by 27.8 percent in the United States. The growth was driven by a somewhat greater increase in the
total number of students enrolled in medical schools (12,009) compared to osteopathic schools (10,309). This
repre-sents a 17.5 percent increase in M.D. enrollment and a 90.2 percent increase in D.O. enrollment during the 10-year
period. Every state experienced an increase in enrollment, except Utah, which had an 18.3 percent decrease in
enroll-ment. Twenty-one states and Puerto Rico had enrollment increases of 20 percent or more (see Figure 10 and Table 10).
• For the 2012–2013 academic year, 61.3 percent of first-year students in M.D. schools matriculated in their home
state. West Virginia had the highest in-state matriculation rate—93.3 percent of the new medical students from West
Virginia matriculated to a school in West Virginia. In contrast, New Hampshire had the lowest rate of states with a
medical school—only 15.2 percent of the new medical students from New Hampshire matriculated in-state (see Figure
11 and Table 11).
Sources: Medical enrollment data are from the AAMC Data Warehouse accessed online 8/13/13 at https://www.aamc.org/data/facts. Osteopathic enrollment data are from the AACOM website http://www.aacom.org/data/studentenrollment/Pages/default.aspx (accessed 8/14/13). July 1, 2012 population estimates are from the U.S. Census Bureau (Release date: December 2012).
0
10
20
30
40
50
60
70
80
90
Alaska
Delaware
Idaho
Montana
Wyoming
Utah
Oregon
California
Washington
Hawaii
New Mexico
Indiana
North Carolina
Alabama
New Jersey
Minnesota
Arkansas
Florida
Connecticut
Colorado
Georgia
Texas
Kansas
Oklahoma
Wisconsin
South Dakota
Mississippi
Nevada
South Carolina
New Hampshire
United States
Arizona
Maryland
Kentucky
Virginia
North Dakota
Maine
Tennessee
Ohio
Michigan
Illinois
Louisiana
Rhode Island
Massachusetts
Iowa
New York
Nebraska
Pennsylvania
Missouri
Vermont
West Virginia
MD
DO
State Median = 29.1
Figure 8. Students Enrolled in Medical or Osteopathic School for the 2012-2013 Academic Year per
100,000 Population
Rate per Rate per Rate per Number 100,000 Rank Number 100,000 Number 100,000 United States 313,914,040 102,498 32.7 N.R. 80,757 25.7 21,741 6.9 Alabama 4,822,023 1,046 21.7 37 1,046 21.7 ---
---Alaska 731,449 --- --- --- --- --- ---
---Arizona 6,553,255 2,170 33.1 20 721 11.0 1,449 22.1
Arkansas 2,949,131 687 23.3 34 687 23.3 ---
---California 38,041,430 6,780 17.8 43 5,111 13.4 1,669 4 Colorado 5,187,582 1,336 25.8 31 705 13.6 631 12.2 Connecticut 3,590,347 905 25.2 32 905 25.2 ---
---Delaware 917,092 --- --- --- --- --- ---
---District of Columbia 632,323 2,038 322.3 N.R. 2,038 322.3 --- ---Florida 19,317,568 4,781 24.7 33 3,097 16.0 1,684 8.7 Georgia 9,919,945 2,604 26.3 30 2,169 21.9 435 4.4
Hawaii 1,392,313 258 18.5 41 258 18.5 ---
---Idaho 1,595,728 --- --- --- --- --- ---
---Illinois 12,875,255 5,696 44.2 11 4,899 38.0 797 6.2 Indiana 6,537,334 1,341 20.5 39 1,341 20.5 ---
---Iowa 3,074,186 1,546 50.3 7 654 21.3 892 29.0
Kansas 2,885,905 792 27.4 28 792 27.4 ---
---Kentucky 4,380,415 1,535 35.0 18 1,162 26.5 373 8.5 Louisiana 4,601,893 2,050 44.5 10 2,050 44.5 ---
---Maine 1,329,192 500 37.6 15 --- --- 500 37.6
Maryland 5,884,563 1,964 33.4 19 1,964 33.4 --- ---Massachusetts 6,646,144 3,043 45.8 8 3,043 45.8 --- ---Michigan 9,883,360 4,197 42.5 12 2,941 29.8 1,256 12.7 Minnesota 5,379,139 1,239 23.0 35 1,239 23.0 --- ---Mississippi 2,984,926 844 28.3 24 527 17.7 317 11 Missouri 6,021,988 3,846 63.9 3 2,179 36.2 1,667 27.7
Montana 1,005,141 --- --- --- --- --- ---
---Nebraska 1,855,525 1,120 60.4 5 1,120 60.4 ---
---Nevada 2,758,931 803 29.1 23 262 9.5 541 20
New Hampshire 1,320,718 413 31.3 21 413 31.3 --- ---New Jersey 8,864,590 2,020 22.8 36 1,423 16.1 597 6.7 New Mexico 2,085,538 393 18.8 40 393 18.8 --- ---New York 19,570,261 9,853 50.3 6 8,126 41.5 1,727 9 North Carolina 9,752,073 2,070 21.2 38 2,070 21.2 --- ---North Dakota 699,628 261 37.3 16 261 37.3 --- ---Ohio 11,544,225 4,740 41.1 13 4,227 36.6 513 4.4 Oklahoma 3,814,820 1,050 27.5 27 665 17.4 385 10
Oregon 3,899,353 551 14.1 44 551 14.1 ---
---Pennsylvania 12,763,536 7,949 62.3 4 5,401 42.3 2,548 20.0 Puerto Rico 3,667,084 1,310 35.7 N.R. 1,310 35.7 --- ---Rhode Island 1,050,292 471 44.8 9 471 44.8 --- ---South Carolina 4,723,723 1,472 31.2 22 1,151 24.4 321 6.8 South Dakota 833,354 234 28.1 25 234 28.1 --- ---Tennessee 6,456,243 2,626 40.7 14 1,929 29.9 697 10.8 Texas 26,059,203 7,135 27.4 29 6,286 24.1 849.0 3.3
Utah 2,855,287 348 12.2 45 348 12.2 ---
---Vermont 626,011 463 74.0 2 463 74.0 ---
---Virginia 8,185,867 2,893 35.3 17 2,137 26.1 756 9.2 Washington 6,897,012 1,272 18.4 42 972 14.1 300 4 West Virginia 1,855,413 1,569 84.6 1 732 39.5 837 45.1 Wisconsin 5,726,398 1,594 27.8 26 1,594 27.8 ---
---Wyoming 576,412 --- --- --- --- --- ---
---N.R. = Not Ranked
--- Indicates that the data are not applicable. Some states do not have a medical or osteopathic school.
Sources: Medical enrollment data are from the AAMC Data Warehouse accessed online 8/13/13 at https://www.aamc.org/data/facts. Osteopathic enrollment data are from the AACOM website http://www.aacom.org/data/studentenrollment/Pages/default.aspx (accessed 8/14/13). July 1, 2012 population estimates are from the U.S. Census Bureau (Release date: December 2012).
PopulationTotal
Total Students Enrolled in Students Enrolled in Students Enrolled in Medical or Osteopathic Schools Medical Schools Osteopathic Schools
Sources: Medical enrollment data are from the AAMC Data Warehouse accessed online 8/13/13 at https://www.aamc.org/data/facts. Osteopathic enrollment data are from the AACOM website http://www.aacom.org/data/studentenrollment/Pages/default.aspx (accessed 8/14/13). July 1, 2012 population estimates are from the U.S. Census Bureau (Release date: December 2012).
0
10
20
30
40
50
60
70
80
90
Alaska
Delaware
Idaho
Maine
Montana
New Hampshire
Pennsylvania
Rhode Island
Wyoming
California
Massachusetts
Georgia
Nevada
Connecticut
Arizona
North Carolina
Florida
Utah
Wisconsin
Illinois
Colorado
New York
Missouri
Washington
Oregon
Tennessee
United States
Mississippi
Hawaii
Minnesota
New Mexico
Indiana
Iowa
Alabama
New Jersey
Arkansas
Maryland
Texas
South Carolina
Virginia
Kentucky
Kansas
Oklahoma
Louisiana
South Dakota
Nebraska
Ohio
North Dakota
Michigan
Vermont
West Virginia
MD
DO
State Median =18.8
Figure 9. Students Enrolled in Public Medical or Osteopathic School for the 2012-2013 Academic Year per
100,000 Population
Rate per Rate per Rate per Number 100,000 Rank Number 100,000 Number 100,000 United States 313,914,040 53,079 16.9 N.R. 48,642 15.5 4,437 1.4 Alabama 4,822,023 1,046 21.7 18 1,046 21.7 ---
---Alaska 731,449 --- --- --- --- --- ---
---Arizona 6,553,255 721 11.0 36 721 11.0 ---
---Arkansas 2,949,131 687 23.3 16 687 23.3 ---
---California 38,041,430 3,175 8.3 41 3,175 8.3 ---
---Colorado 5,187,582 705 13.6 30 705 13.6 ---
---Connecticut 3,590,347 386 10.8 37 386 10.8 ---
---Delaware 917,092 --- --- --- --- --- ---
---District of Columbia 632,323 --- --- N.R. --- --- --- ---Florida 19,317,568 2,296 11.9 34 2,296 11.9 ---
---Georgia 9,919,945 899 9.1 39 899 9.1 ---
---Hawaii 1,392,313 258 18.5 23 258 18.5 ---
---Idaho 1,595,728 --- --- --- --- --- ---
---Illinois 12,875,255 1,744 13.5 31 1,744 13.5 --- ---Indiana 6,537,334 1,341 20.5 20 1,341 20.5 ---
---Iowa 3,074,186 654 21.3 19 654 21.3 ---
---Kansas 2,885,905 792 27.4 10 792 27.4 ---
---Kentucky 4,380,415 1,162 26.5 11 1,162 26.5 --- ---Louisiana 4,601,893 1,275 27.7 8 1,275 27.7 ---
---Maine 1,329,192 --- --- --- --- --- ---
---Maryland 5,884,563 1,373 23.3 15 1,373 23.3 --- ---Massachusetts 6,646,144 565 8.5 40 565 8.5 --- ---Michigan 9,883,360 4,197 42.5 3 2,941 29.8 1,256 12.7
Minnesota 5,379,139 999 18.6 22 999 18.6 ---
---Mississippi 2,984,926 527 17.7 24 527 17.7 ---
---Missouri 6,021,988 830 13.8 28 830 13.8 ---
---Montana 1,005,141 --- --- --- --- --- ---
---Nebraska 1,855,525 536 28.9 6 536 28.9 ---
---Nevada 2,758,931 262 9.5 38 262 9.5 ---
---New Hampshire 1,320,718 --- --- --- --- --- --- ---New Jersey 8,864,590 2,020 22.8 17 1,423 16.1 597 6.7 New Mexico 2,085,538 393 18.8 21 393 18.8 --- ---New York 19,570,261 2,665 13.6 29 2,665 13.6 --- ---North Carolina 9,752,073 1,103 11.3 35 1,103 11.3 ---
---North Dakota 699,628 261 37.3 4 261 37.3 ---
---Ohio 11,544,225 3,835 33.2 5 3,322 28.8 513 4.4
Oklahoma 3,814,820 1,050 27.5 9 665 17.4 385 10
Oregon 3,899,353 551 14.1 26 551 14.1 ---
---Pennsylvania 12,763,536 --- --- --- --- --- --- ---Puerto Rico 3,667,084 469 12.8 N.R 469 12.8 --- ---Rhode Island 1,050,292 --- --- --- --- --- --- ---South Carolina 4,723,723 1,151 24.4 13 1,151 24.4 ---
---South Dakota 833,354 234 28.1 7 234 28.1 ---
---Tennessee 6,456,243 963 14.9 25 963 14.9 ---
---Texas 26,059,203 6,308 24.2 14 5,459 20.9 849 3.3
Utah 2,855,287 348 12.2 33 348 12.2 ---
---Vermont 626,011 463 74.0 2 463 74.0 ---
---Virginia 8,185,867 2,011 24.6 12 2,011 24.6 --- ---Washington 6,897,012 972 14.1 27 972 14.1 --- ---West Virginia 1,855,413 1,569 84.6 1 732 39.5 837 45.1
Wisconsin 5,726,398 752 13.1 32 752 13.1 ---
---Wyoming 576,412 --- --- --- --- --- ---
---N.R. = Not Ranked
--- Indicates that the data are not applicable. Some states do not have a public medical or osteopathic school.
Sources: Medical enrollment data are from the AAMC Data Warehouse accessed online 8/13/13 at https://www.aamc.org/data/facts. Osteopathic enrollment data are from the AACOM website http://www.aacom.org/data/studentenrollment/Pages/default.aspx (accessed 8/14/13). July 1, 2012 population estimates are from the U.S. Census Bureau (Release date: December 2012).
Students Enrolled Students Enrolled
PopulationTotal
Total Students Enrolled in Public in Public in Public Medical or Osteopathic Schools Medical Schools Osteopathic Schools
Sources: 2011 Medical enrollment data are from the AAMC Data Warehouse accessed online on 8/21/13 at
https://www.aamc.org/data/facts. 2001 Medical enrollment data retrieved from the AAMC Data Warehouse STUDENT file as of 8/21/13. 2001 and 2011 Osteopathic enrollment data are from the AACOM website at
http://www.aacom.org/data/studentenrollment/Pages/default.aspx (accessed 8/14/13).
-20%
0%
20%
40%
60%
80%
100%
120%
140%
160%
Alaska
Delaware
Idaho
Montana
Wyoming
Utah
Hawaii
Illinois
Maine
Maryland
Iowa
Connecticut
North Carolina
Wisconsin
Missouri
Alabama
Minnesota
Kansas
Oklahoma
South Dakota
Massachusetts
New York
California
North Dakota
Vermont
New Jersey
Louisiana
Nebraska
Ohio
Arkansas
Indiana
New Mexico
Pennsylvania
Kentucky
United States
New Hampshire
Oregon
Texas
Rhode Island
Michigan
Tennessee
Georgia
Washington
South Carolina
Virginia
West Virginia
Mississippi
Florida
Arizona
Colorado
Nevada
State Median =18.6%
280%
2002 2012 Rank 2002 2012 2002 2012 United States 80,180 102,498 27.8% N.R. 68,748 80,757 11,432 21,741
Alabama 946 1,046 10.6% 35 946 1,046 ---
---Alaska --- --- --- --- --- --- ---
---Arizona 966 2,170 124.6% 3 420 721 546 1,449
Arkansas 571 687 20.3% 21 571 687 ---
---California 5,858 6,780 15.7% 28 4,713 5,111 1,145 1,669
Colorado 552 1,336 142.0% 2 552 705 0 631
Connecticut 842 905 7.5% 39 842 905 ---
---Delaware --- --- --- --- --- --- ---
---District of Columbia 1,828 2,038 11.5% N.R. 1,828 2,038 --- ---Florida 2,287 4,781 109.1% 4 1,530 3,097 757 1,684
Georgia 1,621 2,604 60.6% 10 1,621 2,169 0 435
Hawaii 255 258 1.2% 44 255 258 ---
---Idaho --- --- --- --- --- --- ---
---Illinois 5,350 5,696 6.5% 43 4,707 4,899 643 797
Indiana 1,113 1,341 20.5% 20 1,113 1,341 ---
---Iowa 1,441 1,546 7.3% 40 639 654 802 892
Kansas 710 792 11.5% 33 710 792 ---
---Kentucky 1,229 1,535 24.9% 17 978 1,162 251 373
Louisiana 1,734 2,050 18.2% 24 1,734 2,050 ---
---Maine 468 500 6.8% 42 --- --- 468 500
Maryland 1,831 1,964 7.3% 41 1,831 1,964 ---
---Massachusetts 2,678 3,043 13.6% 30 2,678 3,043 --- ---Michigan 2,775 4,197 51.2% 12 2,248 2,941 527 1,256 Minnesota 1,118 1,239 10.8% 34 1,118 1,239 ---
---Mississippi 408 844 106.9% 5 408 527 0 317
Missouri 3,479 3,846 10.5% 36 1,961 2,179 1,518 1,667
Montana --- --- --- --- --- --- ---
---Nebraska 944 1,120 18.6% 23 944 1,120 ---
---Nevada 212 803 278.8% 1 212 262 0 541
New Hampshire 320 413 29.1% 16 320 413 ---
---New Jersey 1,714 2,020 17.9% 25 1,387 1,423 327 597
New Mexico 324 393 21.3% 19 324 393 ---
---New York 8,536 9,853 15.4% 29 7,389 8,126 1,147 1,727 North Carolina 1,906 2,070 8.6% 38 1,906 2,070 ---
---North Dakota 224 261 16.5% 27 224 261 ---
---Ohio 3,986 4,740 18.9% 22 3,554 4,227 432 513
Oklahoma 940 1,050 11.7% 32 592 665 348 385
Oregon 426 551 29.3% 15 426 551 ---
---Pennsylvania 6,388 7,949 24.4% 18 4,654 5,401 1,734 2,548 Puerto Rico 969 1,310 35.2% N.R. 969 1,310 ---
---Rhode Island 340 471 38.5% 13 340 471 ---
---South Carolina 889 1,472 65.6% 8 889 1,151 0 321
South Dakota 206 234 13.6% 31 206 234 ---
---Tennessee 1,707 2,626 53.8% 11 1,707 1,929 0 697
Texas 5,408 7,135 31.9% 14 4,929 6,286 479 849
Utah 426 348 -18.3% 45 426 348 ---
---Vermont 397 463 16.6% 26 397 463 ---
---Virginia 1,707 2,893 69.5% 7 1,707 2,137 0 756
Washington 773 1,272 64.6% 9 773 972 0 300
West Virginia 897 1,569 74.9% 6 589 732 308 837
Wisconsin 1,450 1,594 9.9% 37 1,450 1,594 ---
---Wyoming --- --- --- --- --- --- ---
---N.R. = Not Ranked
--- Indicates that the data are not applicable. Some states do not have a medical or osteopathic school. Sources: 2011 Medical enrollment data are from the AAMC Data Warehouse accessed online on 8/21/13 at
https://www.aamc.org/data/facts. 2001 Medical enrollment data retrieved from the AAMC Data Warehouse STUDENT file as of 8/21/13. 2001 and 2011 Osteopathic enrollment data are from the AACOM website at
http://www.aacom.org/data/studentenrollment/Pages/default.aspx (accessed 8/14/13).
Total Students Enrolled in UME Students Enrolled in
Medical School Students Enrolled inOsteopathic School Percent
Change
Source: AAMC Data Warehouse Applicant Matriculant File, accessed online at http://www.aamc.org/data/facts (August 16, 2013).
0%
10%
20%
30%
40%
50%
60%
70%
80%
90%
100%
Alaska
Delaware
Idaho
Maine
Montana
Wyoming
New Hampshire
Utah
Maryland
Colorado
Rhode Island
Washington
California
Connecticut
Oregon
Massachusetts
New Jersey
Arizona
Minnesota
Virginia
United States
Missouri
Vermont
Pennsylvania
Iowa
Florida
New York
Illinois
North Carolina
Hawaii
Nevada
Michigan
Wisconsin
Georgia
Indiana
South Dakota
Ohio
New Mexico
Tennessee
Mississippi
Oklahoma
Kansas
North Dakota
Kentucky
Texas
Nebraska
Louisiana
Alabama
Arkansas
South Carolina
West Virginia
State Median = 67.7%
Figure 11. In-State Matriculation to Medical School for the 2012-2013 Academic Year
Number Number Percent Rank
United States 19,059 11,691 61.3% N.R.
Alabama 247 219 88.7% 4
Alaska 37 --- ---
---Arizona 282 141 50.0% 33
Arkansas 162 144 88.9% 3
California 2,268 841 37.1% 38
Colorado 276 90 32.6% 41
Connecticut 218 84 38.5% 37
Delaware 32 --- ---
---District of Columbia 41 13 31.7% N.R.
Florida 1,088 704 64.7% 26
Georgia 549 408 74.3% 18
Hawaii 74 51 68.9% 22
Idaho 65 --- ---
---Illinois 893 582 65.2% 24
Indiana 357 270 75.6% 17
Iowa 150 97 64.7% 27
Kansas 220 181 82.3% 10
Kentucky 241 203 84.2% 8
Louisiana 348 308 88.5% 5
Maine 47 --- ---
---Maryland 504 161 31.9% 42
Massachusetts 573 238 41.5% 35
Michigan 726 516 71.1% 20
Minnesota 368 197 53.5% 32
Mississippi 170 135 79.4% 12
Missouri 331 204 61.6% 30
Montana 55 --- ---
---Nebraska 129 114 88.4% 6
Nevada 78 54 69.2% 21
New Hampshire 46 7 15.2% 44
New Jersey 757 331 43.7% 34
New Mexico 126 98 77.8% 14
New York 1,443 938 65.0% 25
North Carolina 445 296 66.5% 23
North Dakota 60 50 83.3% 9
Ohio 748 575 76.9% 15
Oklahoma 176 141 80.1% 11
Oregon 206 85 41.3% 36
Pennsylvania 730 470 64.4% 28
Puerto Rico 257 246 95.7% N.R.
Rhode Island 35 12 34.3% 40
South Carolina 290 265 91.4% 2
South Dakota 66 50 75.8% 16
Tennessee 315 245 77.8% 14
Texas 1,560 1,368 87.7% 7
Utah 206 61 29.6% 43
Vermont 54 34 63.0% 29
Virginia 475 263 55.4% 31
Washington 340 120 35.3% 39
West Virginia 104 97 93.3% 1
Wisconsin 320 230 71.9% 19
Wyoming 28 --- ---
---N.R. = Not Ranked
--- Indicates that the data are not applicable, as those states do not have a medical school.
* The data shown here are for students in medical schools only. Students attending osteopathic schools are excluded. Source: AAMC Data Warehouse Applicant Matriculant File, accessed online at http://www.aamc.org/data/facts (August 16, 2013).
Matriculants to First-Year Medical Students Who
Medical School by Matriculated to a Medical School in
State of Legal Residence Their Legal State of Residence