ISSN:1991-8178
Australian Journal of Basic and Applied Sciences
Journal home page: www.ajbasweb.com
Corresponding Author: Luqman Mahmood Mina, School of Electrical and Electronic Engineering, Engineering Campus,
University Sains Malaysia, 14300 Nibong Tebal, Penang, Malaysia, E-mail: [email protected]
Improved Accuracy of Breast Cancer Detection in Digital Mammograms using Wavelet
Analysis and Artificial Neural Network
1Luqman Mahmood Mina and 2Nor Ashidi Mat Isa
1School of Electrical and Electronic Engineering, Engineering Campus, University Sains Malaysia, 14300 Nibong Tebal, Penang, Malaysia.
2School of Electrical and Electronic Engineering, Engineering Campus, University Sains Malaysia, 14300 Nibong Tebal, Penang, Malaysia.
A R T I C L E I N F O A B S T R A C T Article history:
Received 10 October 2015 Accepted 30 November 2015 Available online 31 December 2015
Keywords:
Mammogram, breast cancer, mass detection, feature extraction, pattern matching
The high mortality rate in women due to breast cancer prompts the need for early detection techniques. Towards this, mammography imaging system is an advantage for both early detection and screening of breast cancer tumors, given that it uses low dose x-rays for examining the breasts. The use of screening mammography in the early on detection of breast cancer tumor of variable sizes (malignant or benign) reduces mortality rate in women. The objective of this study is to enhance the current accuracy (diagnostic) of digital mammograms using industry standard simulation software tool, MATLAB and the MIAS dataset. The technique involves the identification of tumor cells in terms of different stages of the disease. The processes of recognition and classification of mammograms were concisely analyzed with the aim of differentiating between normal and abnormal (benign or cancerous). It is reported that dense breasts can make the interpretation of conventional mammograms more complex. Although advanced digital mammography techniques assert better detection in dense breast tissues, the availability of such costly digital mammograms is not widespread. This problem can be minimized by analyzing different breast structures (mammograms) using the MATLAB numerical analysis software for image processing applications. In this study, we investigate wavelet-based feature extraction from mammogram images and efficient dimensionality reduction technique. The objective is to propose a new computerized feature extraction technique to identify abnormalities in the mammogram images. In this work feature reduction is carried out using median idea for both maximums and minimums high frequency coefficients sub bands. The proposed system was tested on the MIAS database, resulting in 98.43% succession rate of normal and abnormal classification while for benign and malignant classification, 98.26% rate was obtained.
© 2015 AENSI Publisher All rights reserved. To Cite This Article: Luqman Mahmood Mina and Nor Ashidi Mat Isa., Improved Accuracy of Breast Cancer Detection in Digital Mammograms using Wavelet Analysis and Artificial Neural Network. Aust. J. Basic & Appl. Sci., 9(37): 341-345, 2015
INTRODUCTION
A woman is diagnosed with cancer every 3 minutes and every 13 minutes a woman dies due to breast cancer in the US. Approximately 1 in 8 U.S women will develop invasive breast cancer over the course of her lifetime. 410,000 are people are projected to die from breast cancer, globally; however, about one-third of these deaths could be minimized if the cancer tumors were detected and treated at an early stage (Cancer Facts and Figures, 2012). Breast cancer is one of the most prevalent cancers that affect women. In accorda nce with the report by World Health Organization, breast cancer is one of the most commonly diagnosed cancers amongst middle-aged women. Generally, it is the second
foremost cause of death due to cancer among American women. Next to skin cancer (which is mostly not fatal), breast cancer is the most common cancer globally. Notwithstanding the high prevalence rates, it has been discovered that about 89% of women with breast cancer keep living 5 years after their diagnosis. This is largely a t t ributable to early stage detection and treatment of cancer ( Gawande, A., 2007) .
crucial and effective ways of reducing mortality, because at that point, only a few of the cells that departed from the primary tumor would have successfully formed secondary tumors. The survival rate of breast cancer can be significantly increased if breast cancer can be detected early on, while it is clinically confined to a small area. However, such early breast cancer is generally can be undetected by physical examination and breast self-examination. Thus, the main role of imaging technique is the detection of primary lesions in the breast (Brake, G.M. and N. Karssemeij er, 2001). Presently, the most effective method for the detection of early breast cancer is X-ray mammography. However, reading the mammograms by radiologists is an intricate job that requires specialized training and experience. Hence, there is a strong demand for advancement in computer-aided diagnosis systems CAD (International Commission on Radiological Protection, 1990;Nishikawa, R.M., 2007).
Emerging technological advancements i n mammography have aided the identification of breast cancer at early or initial stages, when the tumor is benign. Studies constantly show that more standard use of only mammography would reduce mortality rate due to breast cancer by one- third.
However, the existing practice in identifying the presence of tumors in breast tissues has a constraint of 10% false negative and a 20% false positive cases being reported (Brake, G.M. and N. Karssemeij er, 2001). These cases can be reduced by developing efficient algorithms to precisely identify, report and position of the tumor present in breast tissues, ultimately saving more women from breast cancer deaths.
A. Computer Aided Diagnosis for Breast Cancer: The objective of a conventional breast cancer CAD system is to detect and assess different cancerous mammograms automatically (Nishikawa, R.M., 2007). The framework of a CAD system is illustrated in Fig. 1. The work flow entails the selection of region of interest (ROI) from the mammogram as an input sample image; preprocessing of the sample image via noise removal and image enhancement, and the extraction of texture features, multi-resolution features and shape features using feature extraction algorithms. The redundant features are removed using a feature selection method to improve the classification efficiency.
Fig. 1: Frame work of CAD system.
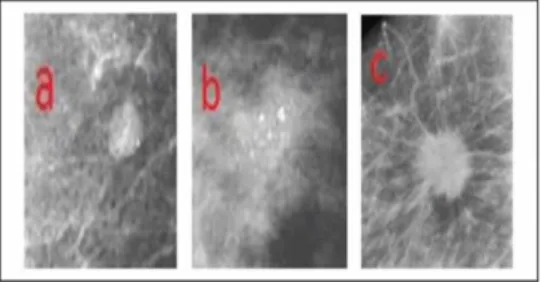
B.Abnormalities in Breast Tissue:
There are three categories of abnormalities of interest in CAD system, i.e., circumscribed mass (Highnam, R. and M. Brady, 1999).
Microcalci fication clusters (Gulsrud, T.O.,
2005), speculated or stellated lesion (Nishikawa, R.M., 1995). The characteristic mammog-raphic form of each of these abnormalities is depicted in Fig. 2.
I. Methodology:
The methodology of this study comprises three stages. The first stage covers the mammogram preprocessing and detection of the breast region. The second stage utilizes the output of the first stage to detect suspicious densities (abnormalities) in the breast region. This stage entails feature extraction and selection. The set of features extracted from the second stage is used as input for the next stage. The third stage is the classification stage, where a mammogram is examined for the existence of tumor based on the feature vectors obtained from the preceding stage. Any suspicious density is then further classified as one having a benign or malignant tumor. This stage aids the diagnosis of breast cancer. The processing stages are clearly outlined below:
A. Stage I:
This preprocessing stage involves the segmentation of the input image (mammogram data) to delineate the abnormalities from the background of the mammograms, thus improving the quality of the image and reduces noise. This stage comprises the following steps:
Step 1: Removal of Black Background: For every mammogram image, the sum of intensities for all rows and columns is determined, and a set of threshold values is subsequently applied to these sums to remove the black background.
Step 2: Removal of Label: The existing label in a mammogram image is eliminated using the connected component technique. The largest region is maintained for additional analysis which happens to be the breast region of interest.
B. Stage II:
The output of stage I, i.e., the breast region (ROI) is used as the input image in this stage. Features are extracted from the enhanced image via a wavelet decomposition process. The feature extraction and selection stages are outlined in the following steps:
Step 1: Wavelet Decomposition: The Wavelet Transform is perhaps the latest solution to surmounting the limitations of the Fourier Transform. A wavelet is a waveform of effectively restricted duration with an average value of zero. The discretization of an image by means of wavelets gives rise to a set of coefficients which serve as features for further analysis. The Daubechies wavelet is used for this study is. The outputs from this wavelet decomposition are the decomposition vector, C and the corresponding bookkeeping matrix, S. The decomposition vector comprises three detail coefficients horizontal detail coefficient, H, vertical detail coefficient, V and diagonal detail coefficient, D.
Step 2: Extraction of Coefficients: Here, the
three detail coefficients, H, V and D at the decomposition scale of N are extracted from the wavelet decomposition structure (C, S). These vectors are extracted at each scale without scale 1; since the details coefficients at scale 1 contain high frequency details and noise. The quality of the resultant image is verified and validated to 98% of the original image with the exclusion (zeroing) of scale 1 coefficients.
Step 3: Normalization of vectors: The coefficients vector (H, V and D) for scale 2 to scale 5 are extracted and nominalized. Nominalization is attained by dividing each vector by it maximum value. This results in all the vector values being less than or equal to one. This step is used to simplify the coefficient values.
Step 4: Determine median maximum and median minimum coefficients. A matrix is constructed by putting wavelet coefficients (median max and median min) of each image in row vector, where the number of rows is the number of images, and the number of columns is the number of coefficients. A feature extraction method is developed based on the statistical median maximum and median minimum of high frequency sub bands method. The method is ranking the features (columns) according to its capability to differentiate the classes. The method depends on extracting the features that can maximize the ability to discriminate between different classes. However, the value of the features is too big, so we need a normalizing process of the high sub band horizontal, vertical, and diagonal coefficients at the desired five levels of decomposition.
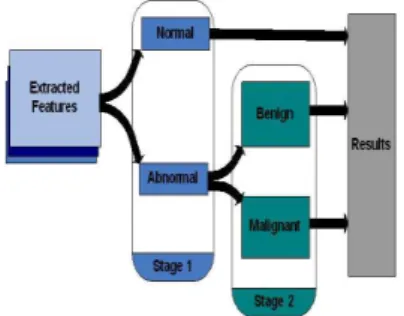
C. Stage III:
In this stage, the output features obtained from Stage II are used for classification and diagnosis. These feature vectors are applied to identify and distinguish a normal mammogram from an abnormal case. The abnormal mammogram undergoes further classification into benign and malignant cases. This classification is valid regardless of the type of abnormal tissue identified as shown in Fig. 3. The benign and malignant masses are differentiated based on mass attributes of margin, density and location. Round masses of low density with smooth distinctively defined margins are considered benign, while highly dense speculated masses with blurred margins are classified as malignant tumors.
RESULTS AND DISCUSSION
The results of the analysis performed on t h e mammograms acquired from the database of
done, the median of biggest and smallest coefficients per each high frequency sub bands were extracted. For each level of decomposition, we got only two features per each sub band, the total features for every mammogram are 10 features. A matrix was created by storing wavelet coefficients (median maximum and median minimum for five levels) of every image in row vector, where the number of rows is the number of images, and the number of columns is the number of coefficients. We have examined a new technique for classification purpose, which is Cross-Validation technique. Data features divided to (5) sets, then apply 5-fold cross validation and the new data sets feeds to neural network system for classifying purpose. By using cross-validation technique each coefficient has chance of being as a training sample and testing sample. All experiments are
set with the same neural network parameter setting so there is consistency across all tests. As a first stage, we separate database images as a normal and abnormal. Previously, we mentioned the abnormal cases involved a Benign and Malignant. For normal cases it is clear according to the database identification. While 207 images belong to the normal cases, and the rest which is 115 images have abnormalities. We trained the neural networks by 80% of both types, and tested by the rest, which is 20%. This procedure repeated five times for each level of decomposition from level 1 to level 5. For each level, we used those features extracted from last step of features extraction, which are selected features from (H, V and D sub bands).Table 1 and table 2 shows classification rate for normal and abnormal at 28 and 36 neurons of hidden layer.
Fig. 3: Classification stage block diagram.
Table 1: (Classification rates for Normal and Abnormal 28 neurons).
Accuracy (%) Specificity (%) Sensitivity (%) folds
96.87 95.65 97.56 G1
98.43 100 97.56 G2
95.31 91.30 97.56 G3
98.43 95.5 100 G4
98.43 95.63 100 G5
98.43 95.64 98.56 Average
Table 2: (Classification rates for Normal and Abnormal 36 neurons).
Accuracy (%) Specificity (%) Sensitivity (%) folds
100 100 100 G1
98.43 100 97.56 G2
92.18 95.65 90.24 G3
96.87 91.30 100 G4
96.87 95.65 97.56 G5
96.87 96.52 97.07 Average
II. Conclusion:
In this work, we have presented and discussed three methods for building a computer aided diagnosing system for classification of abnormality in digital mammograms. We have used preprocessing to preparing images to the next steps. In addition, we have investigated and analyzed the two-dimensional discreet wavelet transform for features extraction, and Artificial Neural Networks (ANN) algorithm for classification process. Earlier studies proved that transform domain is utilized to
wavelet decomposition. Then, the median of maximum and minimum coefficients are used to reduce the number of features to 10 features. These two sets of features are input to the ANN for classification.
The proposed method divided the images into twenty sub bands using Haar wavelet decomposition for five levels, removing approximation (low frequency sub bands) and retaining only details (high frequency sub bans). The proposed algorithm calculates median maximum and median minimum for each details sub bands obtained from wavelet filters, then put into the feature victor to the next step, which is classification. In this study, we introduced an evolutionary multi–objective approach to artificial neural networks for the breast cancer diagnosis. We showed empirically that the proposed approach has better generalization than previous approaches with much lower computational cost.
Our results show that combining discrete wavelet transform (DWT) with support vector machine (ANN) is a powerful combination for identifying and classifying abnormality and severity of abnormality in a mammogram images. Future extensions of this approach could deal with a way to incorporate possibly other coefficients of the transform, either from higher than five frequency decomposition levels, or increase the number of feature coefficients in each levels, since some useful distinct information could be found from those, depending on the data tested.
REFERENCES
Cancer Facts and Figures, 2012. American Cancer Society.
Gawande, A., 2007. “Suggestions for Becoming a Positive Deviant," in Better: A Surgeon’s Notes on Perf -ormance, 2nd ed. NY: Picador, ch, 7: 249-253.
Brake, G.M. and N. Karssemeij er, 2001."Segmentation of suspicious densities in digital mammograms", Intern ational Journal of Medical Phy sics, 28: 259-266.
Highnam, R. and M. Brady, 1999. Mammographic Image Analysis, Kluwer Academic Publishers, Dordrecht.
Gulsrud, T.O., K. Engan, T. Hanstveit, 2005. “Watershed segmentation of detected masses in digital mammograms", Proceedings of the 27th Annual Conference of the IEEE Engineering in Medicine and Biology, Shanghai.
Nishikawa, R.M., M.L. Giger, K. Doi, C.1.Y. Vyborn, R.A. Schmidt, 1995. "Computer aided detection of clustered microcalcifications in digital mammograms", Med. BioI. Eng. Comput., 33: 174-178.
International Commission on Radiological Protection, 1990. Annals of the ICRP, 21: 1-3.
Nishikawa, R.M., 2007. "Current status and future directions of computer-aided diagnosis in mammography", Intern ational Journal of Computerized Medical Imaging and Graphics, 31: 224-235.