http://www.cmbl.org.pl DOI: 10.2478/s11658-006-0006-6 Received: 18 July 2005
Revised form accepted: 14 December 2005
© 2006 by the University of Wrocław, Poland
* Corresponding author, e-mail: [email protected]
Abbreviations used: DSM IV Classification – Diagnostic and Statistical Manual of Mental Disorders; NCBI – National Center for Biotechnology Information; AN – Anorexia nervosa; AN-R – restricting type of Anorexia nervosa; AN-BP – binge-eating/purging type of Anorexia nervosa; LEP – leptin; LEPR – Homo sapiens leptin receptor; LEPROTL1 – Homo sapiens leptin receptor overlapping transcript-like 1; LEPROT – leptin receptor overlapping transcript; OB-R – Leptin receptor coding gene; OB-R – leptin receptor; Ob-Ra – leptin receptor splice variant; Ob-Rb – leptin receptor splice variant; Ob-Rc – leptin receptor splice variant; Ob-Rd – leptin receptor splice variant; Ob-Re – leptin receptor splice variant
Short communication
THE TRANSCRIPT EXPRESSION PROFILE OF THE LEPTIN RECEPTOR-CODING GENE ASSAYED WITH THE
OLIGONUCLEOTIDE MICROARRAY TECHNIQUE – COULD THIS
BE AN Anorexia nervosa MARKER?
MAŁGORZATA JANAS-KOZIK1,2*, URSZULA MAZUREK3, IRENA KRUPKA-MATUSZCZYK1, MAŁGORZATA STACHOWICZ3, JOANNA
GŁOGOWSKA-LIGUS3 and TADEUSZ WILCZOK3
1Department and Clinic of Psychiatry and Pschychotherapy, Medical University
of Silesia, Katowice, Poland, 2Department of Child and Adolescent Psychiatry, Medical University of Silesia, Katowice, Poland, 3Departmentof Molecular Biology and Medical Genetics, Medical University of Silesia, Katowice, Poland
Abstract: Anorexia nervosa is a serious eating disorder with the highest mortality rate of any psychatric disorder. The DSM-IV classification differentiates two AN types: the restricting type (AN-R) and the binge-eating/purging type (AN-BP). Leptin (LEP) levels can be thought of as a signal to the body of its energy reserves. The leptin receptor (including all its mRNA isoforms) is expressed in many tissues. Our aim was to discover the transcript expression profile of the LEP receptor-coding gene in the peripheral blood mononuclears in AN-R and AN-BP patients. Three young women suffering from
Anorexia nervosa (one with AN-BP and two with AN-R) took part in the study,
gene expression was examined using the oligonucleotide microarray method (HG-U133A, Affymetrix). The results were normalized using RMAExpress. Next, the accumulation analysis method was used (clustering). Hierarchical clustering resulted in three groups of separate clusters. The first group (cluster I) consisted of AN-R patients. The next group (cluster II) consisted of reference group patients suffering from different psychic disorders not related to eating disorders. Cluster III consisted of two patients – the first with AN-BP and the second with an adaptive disorder.
Key words:Anorexia nervosa, Leptin receptor, Oligonucleotide microarray
INTRODUCTION
Anorexia nervosa (AN) is an eating disorder most common among adolescent
girls and young women. The incidence of AN is estimated at 0.5-1% among adolescent girls and up to 0.8% among young women. The AN mortality rate reaches 15% [1]. The main AN symptoms include a loss in body mass and a constant fear of weight gain.
One of the anorexigenic peptides is leptin (LEP). It is produced by differentiated adipocytes, although leptin production has been found in other human tissues, such as the fundus of the stomach, the skeletal muscles, the liver and the placenta [2]. The leptin produced by the adipose tissue and by that gastric mucosa may serve to coordinate the long- and short-term regulation of feeding behaviour [3]. Leptin may be regarded as one of the best markers for the total body fat content. It comes in two types: free LEP and LEP bound with plasma protein, each having its own function in the system [4]. Free LEP controls fat tissue mass, while LEP bound with a soluble receptor controls energy expenditure [5]. The leptin receptor (OB-R) is a product of the OB-R gene, which can be found on human chromosome 1 (1p31).
Alternative splicing of one OB-R gene transcript creates several functional isoforms of the LEP receptor. Isoforms of the LEP (OB-R) receptor differ in the length of their cytoplasmic domain, and, as a result, there are short and long isoforms. LEP receptors belong to the cytokine class I receptor family [5]. The human leptin receptor gene contains a number of single nucleotide polymorphisms (SNPs). In the leptin receptor, these are associated with measures of body weight [6].
MATERIALS AND METHODS
ICD-10 [9] liststhe following criteria for a definite AN diagnosis.
• Body weight is maintained at least 15% below that expected with the weight either having been lost or never achieved. Prepubertal patients may show failure to make the expected weight gain during the period of growth.
• The weight loss is self-induced by avoidance of “fattening foods”.
• There is a body-image distortion in the form of a specific psychopathology whereby a dread of fatness persists as an intrusive, overvalued idea and the patient imposes a low weight threshold on himself or herself.
• A widespread endocrine disorder involving the hypothalamic-pituitary-gonadal axis is manifested in women as amenorrhoea and in men as a loss of sexual interest and potency. An apparent exception is the persistence of vaginal bleeds in anorexic women who are receiving replacement hormonal therapy.
The DSM-IV classification [10] uses the same body weight deficiency criteria as ICD-10, but additionally differentiates between two AN types: the restricting type (AN-R) and the binge-eating/purging type (AN-BP). The AN-R type is characterized by the use of a radical diet limiting the quantity and quality of eaten food. AN-R patients do not use laxatives, dehydrants or anacathartics to “cleanse” their bodies. AN-BP patients, in addition to putting themselves on a diet, also try to “cleanse” their bodies using the aformentioned pharmaceuticals.
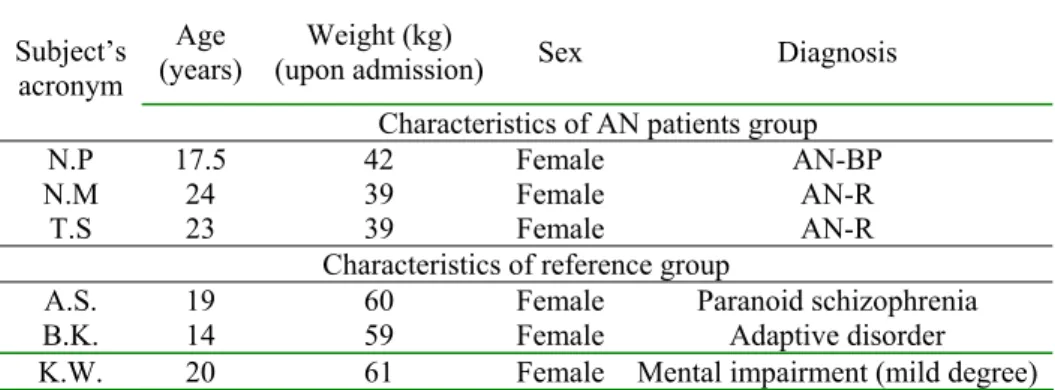
Three AN patients comforming to the ICD-10 and the DSM-IV AN diagnostic criteria took part in the study. The patients in the reference group did not suffer from eating disorders. The characteristics of the AN patients and the reference group subjects are presented in Tab. 1.
Tab. 1. The characteristics of the AN patients and the reference group subjects.
Age
(years) (upon admission) Weight (kg) Sex Diagnosis Subject’s
acronym
Characteristics of AN patients group
N.P 17.5 42 Female AN-BP
N.M 24 39 Female AN-R
T.S 23 39 Female AN-R
Characteristics of reference group
A.S. 19 60 Female Paranoid schizophrenia
B.K. 14 59 Female Adaptive disorder
K.W. 20 61 Female Mental impairment (mild degree)
Total RNA extraction from peripheral blood mononuclears
Vacutaner tubes. Then the nucleated fraction was isolated, out of which total RNA was extracted using a Total RNA Prep Plus kit according to the manufacturer’s recommendations (A&A Biotechnology) [11].
Leptin receptor gene expression assessed with the oligonucleotide microarray method
The oligonucleotide microarray method analyzes gene expression by using the phenomenon of hybridization of single-thread RNA fragments with complementary DNA probes. This method makes it possible to examine the expression of thousands of transcripts represented on a microarray via specific oligonucleotide probes. The material used in the assay was total RNA which was purified (with an RNeasy Total RNA Mini Kit, Qiagen) and treated with DNase I. The obtained RNA was used for the synthesis of two-thread cDNA (using the Gibco BRL SuperScript Choice system), which was the microarray for biotinylated cRNA synthesis (via an in vitro transcription reaction, with an Enzo kit). cRNA was purified on RNeasy Mini Kit columns (Qiagen), fragmented and hybridized with a test microarray (Test 3), and then with the HG-U133A microarray (Affymetrix). cRNA hybridized with the microarray was stained using streptavidine phycoerythrin conjugate. The fluorescence intensity was assessed with a G2500A GeneArray Scanner. The results were analyzed with MicroArray Suite 5.0 and Data Mining Tool (Affymetrix). The obtained results were normalized with RMAExpress and clustered with Cluster v.3.0.
Leptin concentration assay in plasma
LEP concentration was measured using the commercial enzymoimmunological kits made by DRG Instruments GmbH Germany (Leptin Sandwich ELISA). The manufacturer’s protocols were followed during the assay. The assay was performed on an automatic ELISA reader made by DRG (Eliza MAT 2000). Leptin shows the following cross relations: Human Leptin – 100%, Rat Leptin < 0.2%, Mouse Leptin < 0.2%, Human Insulin, Human Proinsulin, Rat Insulin, Human C-Peptide, Glucagon and IGF-I – N.D. Assay sensitivity = 0.03 ng/ml.
RESULTS AND DISCUSSION
The BMI and LEP concentrations for the AN patients after 2 months of therapy are presented in Tab. 2. The LEP concentrations and BMI were measured once for the reference group.
Tab. 2. The BMI and LEP concentrations for the AN patients after a 2-month period of observation and for the reference group subjects.
BMI (kg/m2) LEP concentration in the plasma (ng/ml) Subject’s
acronym
Results for the AN patients after 2 months of observation
N.P 17.32 9.1
N.M 15.46 2.03
T.S 14.14 1.90
Coefficient variation 10.21% 94.86% Results for the reference group
A.S. 22.23 15.2
B.K. 24.30 14.7
K.W. 22.0 15.8
Coefficient variation 5.55% 3.62%
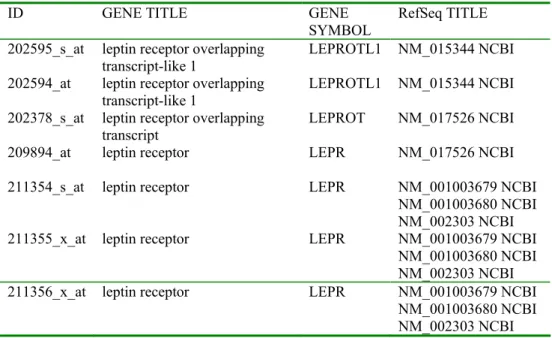
Tab. 3. Analyzed transcripts coding the leptin receptor present on the HG-U133A microarray.
ID GENE TITLE GENE
SYMBOL
RefSeq TITLE
202595_s_at leptin receptor overlapping
transcript-like 1 LEPROTL1 NM_015344 NCBI 202594_at leptin receptor overlapping
transcript-like 1
LEPROTL1 NM_015344 NCBI
202378_s_at leptin receptor overlapping
transcript LEPROT NM_017526 NCBI
209894_at leptin receptor LEPR NM_017526 NCBI
211354_s_at leptin receptor LEPR NM_001003679 NCBI NM_001003680 NCBI NM_002303 NCBI 211355_x_at leptin receptor LEPR NM_001003679 NCBI
NM_001003680 NCBI NM_002303 NCBI 211356_x_at leptin receptor LEPR NM_001003679 NCBI
The oligonucleotide microarray method was used to determine the expression profile of the LEP receptor-coding gene after the patients had been in the Ward for two months. The expression profile of the LEP receptor-coding gene (OB-R) was assayed with the HG-U133A oligonucleotide microarray (Affymetrix). Seven transcripts of the LEP receptor-coding gene were found in the Affymetrix database [12]. We investigated two isoforms of the LEP receptor-coding gene (LEPR); they were found in the NCBI database (Ob-Ra and Ob-Rb) [13]. The NCBI database includes the following reference sequences for LEPR:
Homo sapiens leptin receptor (LEPR), transcript variant 1, mRNA (NM
002203); Homo sapiens leptin receptor (LEPR), transcript variant 2, mRNA (NM 001003679); Homo sapiens leptin receptor (LEPR), transcript variant 3, mRNA (NM 001003680). These sequences were used by Affymetrix to determine the reference sequences for the transcripts of the LEP receptor-coding gene. We used the 7 transcripts listed in Tab. 3.
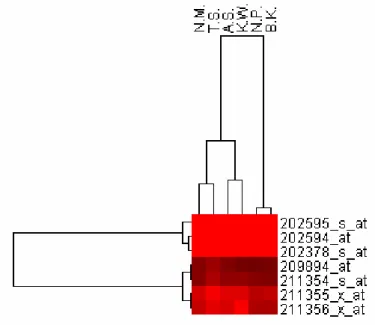
In order to present the data obtained during the HG-U133A oligonucleotide microarray analysis, the obtained results were normalized using RMAExpress. Next, the accumulation analysis method was used (clustering). The studied transcript results were clustered with Cluster v 3.0. Clustering groups transcripts of genes with similar expression profiles. All the transcripts are arranged in the form of a hierarchical tree, on which transcripts with similar expression profiles are located close to each other. Hierarchical clustering uses the euclidic distance showing the differences in expression levels between the analyzed measurements. Fig. 1 presents the results obtained during the clustering process.
The hierarchical clustering method facilitates grouping of the transcripts of the LEP receptor-coding gene with similar expression profiles, thus creating the above-mentioned groups, or clusters. A total of six arrays was used in the experiment; their symbols refer to the initials of the AN and the reference group patients. The dendogram shows the correlation between the expression profiles of the studied transcripts of the LEP receptors-coding gene. The length of the “arms” is proportional to the similarities between the profiles of transcript expression of the studied gene. Shorter arms indicate a closer resemblance. Hierarchical clustering resulted in three groups of separate clusters (Fig. 1). Patients from group I (cluster I: N.M. and T.S. with AN-R – Tab. 1) were in their early adulthood and had a low BMI and LEP concentration (Tab. 2). The reference group patients (cluster II: A.S. and K.W. with different psychic disorders not related to eating disorders – Tab. 1) were also in their young adulthood, had a normal BMI and very similar LEP concentrationls (Tab. 3). The patients from the last group (cluster III: N.P. with AN-BP and B.K. with the adaptive disorder – Tab. 1) were in their middle adolescence (14-17 years old) with their biological development completed; they differed significantly in their BMI and LEP concentration values (Tabs 2 and 3). Therefore, it seems that the transcript expression profile of the LEP receptor-coding gene differentiates between the two AN types: the restricting type (AN-R) and the binge-eating/purging type (AN-BP).
BMI could have an impact on the clustering result. The evidence for that is the fact that the patients with AN-R and a low BMI are grouped together, and the reference group subjects are in one cluster. The patient with AN-BP is in a separate group; her BMI is higher than those of the girls with AN-R, but she had a similar transcript expression profile of the LEP receptor-coding gene to the patient suffering from a development disorder. Both are in their adolescence (middle and late), and this could imply that age cannot have an influence on clustering. The relative ages of the AN patients and the reference group subjects was an independent determinant of the clustering. All the subjects (AN-R and AN-BP, and those in the reference group) had finished their biological development before the onset of their illness.
Further studies are required to answer whether the transcript expression profile of the leptin receptor-coding gene may prove to be a marker differentiating between the restricting type (AN-R) and the binge-eating/purging type (AN-BP)
of Anorexia nervosa.
REFERENCES
1. Rajewski, A. Eating disorders. In: Psychiatry of children and youth
(Namyslowska, I. Ed.), PZWL, Warszawa (2004) 247-266.
3. Pico, C., Oliver, P., Sanchez, J. and Palou, A. Gastric leptin: a putative role in the short-term regulation of food intake. Br. J. Nutr. 90 (2003) 735-741. 4. Widjaja, A., Kielstein, J.T., Horn, R., Mühlen, A., Kliem, V. and Brabant,
G. Free serum leptin but not bound leptin concentrations are elevated in patients with end-stage renal disease. Nephrol. Dial.Transplant. 15 (2000) 846-850.
5. Meier, A. and Gressner, A.M. Endocrine regulation of energy metabolism: review of pathobiochemical and clinical chemical aspects of leptin, ghrelin, adiponectin and resistin. Clin. Chem. 50 (2004) 1511-1525.
6. Quinton, N.D., Meechan, D.W., Brown, K., Eastwood, H., Blakemore, A.L. Single nucleotide polymorphisms in the leptin receptor gene: studies in
Anorexia nervosa. Psychiatr. Genet. 14 (2004) 191-194.
7. Tsiotra, P.C., Pappa, V., Raphis, S.A. and Tsigos, C. Expression of the long and short leptin receptor isoforms in peripheral blood mononuclear cells: implications for leptin’s actions. Metabolism 49 (2000) 1537-1541.
8. Burguera, B., Couce, M.E., Long, J., Lamsam, J., Laakso, K., Jensen, M.D., Parisi, J.E. and Lloyd, R.V. The long form of leptin receptor (Ob-Rb) is widely expressed in the human brain. Neuroendocrinology 71 (2000) 187-195.
9. ICD-10 classification of mental and behavioral disorders. Research diagnostic criteria. Medical University Publishing House “Vesalius”. The Institute of Psychiatry and Neurology. Kraków-Warszawa 1998, 106.
10.American Psychiatric Association, 1994. Diagnostic and Statistical Manual of Mental Disorders, 4th ed. (DSM-IV).
11.Chomczynski, P. and Sacchi, N. Single-step method of RNA isolation by acid guanidium thiocyanate-phenol-chloroform extraction. Anal. Biochem.
162 (1987) 156-159.
12.(http://www.affymetrix.com/index.affx).