Effective Hospital Pricing
Strategy
Setting Defensible Prices
Written by
William O. Cleverley, Ph.D.
Cleverley + Associates438 e wilson bridge road, suite 200 Worthington, oh 43085
888-779-5663
Price setting in the hospital industry has become increasingly important as a
management strategy to combat eroding margins resulting from cost increases and government payer payment inadequacies. This short paper will discuss three specific issues hospital executives must address in pricing strategy:
¾ Why is pricing important in a fixed-fee environment?
¾ At what level should prices be set?
¾ How should management decide where to place price increases?
Why Is Pricing Important?
To many hospital executives, pricing strategy would appear to be of little importance, given the present preponderance of fixed-fee payment. Medicare and Medicaid programs usually pay for both inpatient and outpatient care on a prospective basis. Most managed care programs pay for inpatient care on a DRG or per diem basis with outpatient care payment provisions based on fee schedules or discounted charges. Even self-pay patients, who do pay on a charge basis, may have very low recovery rates related to high bad debt or charity care write-offs.
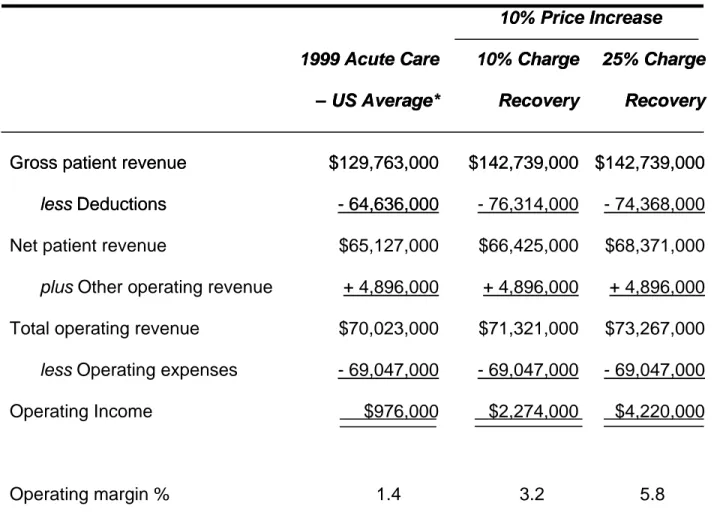
Given this backdrop, it would seem that pricing has a minimal effect on profitability. From the many pricing studies that our firm has completed, we find that the actual percentage of a hospital’s total business that is charge related usually runs somewhere between 10% and 25%. Table 1 presents a hypothetical illustration of a 10% rate increase for the two extreme levels of charge recovery – 10% to 25% – for the average acute care hospital in 1999. Even at the low recovery value of 10%, operating profits and margins more than double with the 10% rate increase. Pricing is clearly a very effective strategy to increase profits quickly and with almost perfect certainty. It may be helpful to further discuss the areas where prices become the basis for
payment. It has been our firm’s experience that hospital executives often overlook areas where prices drive payment. The major areas of price-related payment are:
¾ Self-pay patients
¾ Indemnity payers
¾ Managed care plans with outpatient percentage of charge payment provisions
¾ Specific drug and prosthesis carve-out arrangements
¾ Stop-loss thresholds
Most of the above areas are obvious and need no explanation, but several are not often identified as price related. For example, some contracts specify percent of charge payment for high-cost drugs and/or prostheses. Payment for these item codes would be related to their prices. Stop-loss thresholds are becoming increasingly important as charges rise above the threshold. In many contracts, payment for cases above the threshold is a percentage of charge arrangement. Finally, most people ignore the impact that charges can have on Medicare outpatient payment. While the final rule for device pass-throughs is not yet available, payment has been and will most likely be related to charges through the application of the facility ratio of cost to charges (RCC) to the device charge. Medicare outpatient outliers, whether on a claim or line item basis, are also related to charges through the RCC methodology. Higher charges will increase outlier payments. Finally, Medicare outpatient transitional corridor payments are based upon differences between payment and cost, where cost is the result of departmental RCCs times charges. When all of the above areas are added up, most US acute care hospitals will have charge recovery percentages equal to at least 10%, and many will be above this level.
At What Level Should Prices Be Set?
There are many factors which impact pricing decisions, especially in competitive markets. The key underlying economic principle is “price elasticity.” Simply stated, will demand drop if prices are increased and by how much? Because hospitals have a number of price-sensitive customers with varying degrees of price sensitivity, price elasticity is hard to evaluate. Many executives believe that outpatient procedures are more price elastic than are inpatient procedures because individual patients pay either all of the charge or a greater proportion of it. High prices can also drive managed care plans with payment provisions based upon charges to other providers, although the reaction is not so quick as that experienced with self-pay patients.
Recognizing the importance of price elasticity issues is important in pricing, but in many cases, hospitals have a great deal of pricing latitude. Raising prices may not materially impact short-term demand. If hospitals, both tax-exempt and taxable, were profit maximizers, hospital prices would be at much higher levels than they are. Hospitals must, however, set rates at levels sufficient to maintain their financial viability. But what is that level? We believe prices should be set to cover the following items:
¾ Average reasonable costs
¾ Losses from payers who pay less than cost
¾ Reasonable return on investment (ROI)
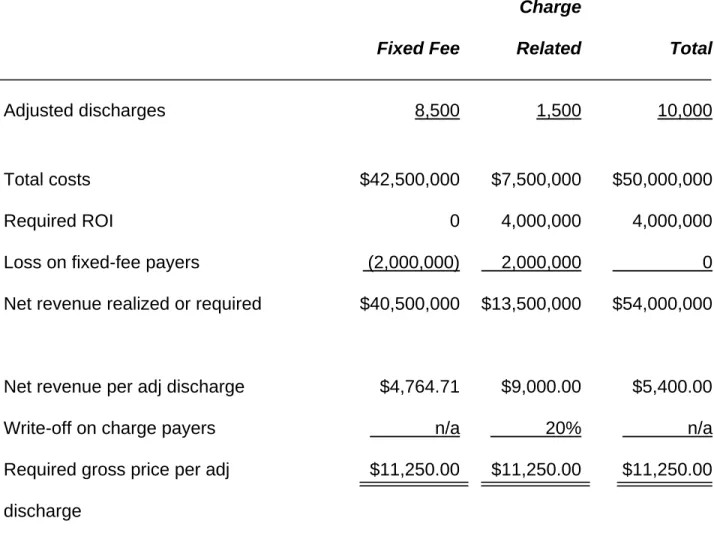
Table 2 provides an illustration of price determination for a hypothetical hospital
example. In this example, the hospital needs to realize $5,400 per adjusted discharge to cover its costs plus provide a $4,000,000 ROI. The fixed-fee payers, however, pay less than costs, which necessitates loading an additional $2,000,000 into the rate structure for charge-related payers. The hospital needs $5,400 per adjusted discharge but recovers only $4,764.71 from fixed-fee payers, requiring a $9,000 payment from the limited charge-related base. This figure is further inflated to $11,250 when the average write-off or discount to charge payers of 20% is recognized.
The results in this example are painfully obvious to every hospital executive. Hospitals who lose money on Medicare and managed care contracts must raise rates sharply to a limited charge-related payer base. Large write-offs or discounts to the charge-related payer base can and often do escalate prices to levels that bear little relationship to costs. This is the nature of the economic environment facing hospitals today. Wishing it were not so will not change the facts. Hospitals should not be embarrassed by high prices so long as two conditions exist:
¾ Their costs are reasonable
¾ Their ROI or level of profit is not excessive
The key factor in the above two conditions is ROI. We believe financially viable
hospitals should target a return on equity of at least 8.0%. Assuming reasonable costs and an ROE that is at least 8.0% permits hospitals to set required prices. We will now turn our attention to the methods for raising prices to realize reasonable profit goals.
How Should Prices Be Set?
Hospitals that initiate price changes usually adopt one of two strategies. The first approach is the so-called “across-the-board” increase. In this method, all item codes in the Charge Description Master (CDM) are increased at some constant percentage. The second approach is selective price increases or decreases for each item code to achieve some stated overall charge increase. The latter approach usually attempts to place price increases in areas where recovery opportunities are greater. For example, item codes with little or no charge-related payer volume would be poor candidates for price increases. Our experience in pricing studies suggests that selective price increase strategies are more effective, often generating 30% to 80% more profit from a given overall rate increase.
In the reminder of this paper, we will address the critical areas for effective pricing
studies. Understanding and managing these areas will enhance the effectiveness of any pricing study whether it is done internally or with outside consulting. To illustrate the major issues involved in pricing, we will use a case file from our firm (Table 3). Before starting a pricing study, three data sets must be available:
¾ Current CDM
¾ Three to nine months of claims with line item detail
¾ Payer contract information
CDM Review
In our case study hospital, their present CDM contained 10,641 item codes. Our review of three months of claims found that 3,410 line items, or 32%, were actually used. This is not an unusual finding; our average percentage of used item codes is approximately 34%, with a range from 20% to 60%.
The primary issue that hospitals must face is why so many item codes in their CDMs are used so infrequently. The inclusion of infrequently or non-used codes increases CDM complexity and makes CDM management more difficult.
Ideally, pricing studies follow CDM reviews but, even if a CDM review has just been completed, a limited desk review of the CDM and claims should be conducted to review the following areas:
¾ Deleted or invalid CPT®/HCPCS codes
¾ Duplicated line items
¾ Medicare non-covered items
¾ Item codes requiring CPT® code for Medicare payment
¾ Incorrect revenue code
¾ Pass-through codes
It has been our experience that most hospitals will have issues in all six areas, and a careful review may help to avoid lost reimbursement. Table 4 identifies the number of issues by category found in the case study hospital.
Line-Item Claims
The line-item claims provide the basis for determining recovery rates by item code. A recovery rate simply defines the percentage of any charge increase that will be recovered as increased profit. Recovery rates may range from 0% (no payers pay charges) to 100% (all payers pay 100% of charges).
Some pricing analysts will choose to use revenue and usage reports in lieu of line item claims. While these data are easier to obtain, we believe there are significant limitations associated with using revenue and usage data in a pricing study. Most of the problems revolve around defining actual payment provisions. For example, stop-loss thresholds could not be modeled from revenue and usage data. A variety of complex outpatient payment provisions could also be lost, which would impact the accuracy of estimated recovery rates.
Recovery rates are defined by relating payer frequencies by item code to payer payment terms. An item code that had only Medicare patient utilization would have a zero
recovery. The major issue in claims sampling is the period of time to review. We have found that a minimum three-month sample should be used with a maximum of nine to twelve months. Sample periods less than three months can lead to a bias in estimating payer frequencies by item code. In our case study hospital, 15,900 claims were
reviewed for the period August 1, 2001, to October 31, 2001. A larger sample over a longer time period should be used when seasonality could be a significant factor. For example, hospitals in Florida with high winter Medicare utilization may require nine months to a year sample period.
Aside from the extra effort of obtaining claims over longer time periods, there is one other potential problem. When CDM changes have taken place in the claims period, the claims data will not totally reflect the current CDM. Some re-mapping of claims data to
current CDM will, therefore, need to be done. The greater the number of changes, the more likely mistakes may be made.
Payer Contract Information
A review of all of the claims data will identify the relevant payers represented in the claims sample. For our case study hospital, we identified over 600 distinct payer contract categories. Each of those payer categories must be reviewed to appropriately define payment terms. This is perhaps the most critical part of any pricing study. If payment terms are not accurately modeled, the study’s conclusions will be flawed. Key areas that should be examined are:
¾ Presence of stop-loss provisions
¾ Presence of carve-outs for drugs or devices
¾ Non-grouped outpatient surgical categories
¾ Expected recovery on self-pay portions
¾ Presence of fee schedules for selected outpatient areas, such as lab and radiology
¾ Facility RCC used for Medicare outpatient
There are usually a large number of payers with no hospital contract, but they may account for a relatively small dollar volume. It is very important to validate specific recovery rates for these payers and not apply a universal factor that may not be
accurate. While dollar volumes for these payers may be relatively small, they represent a substantial percentage of the total recovery rate for many item codes.
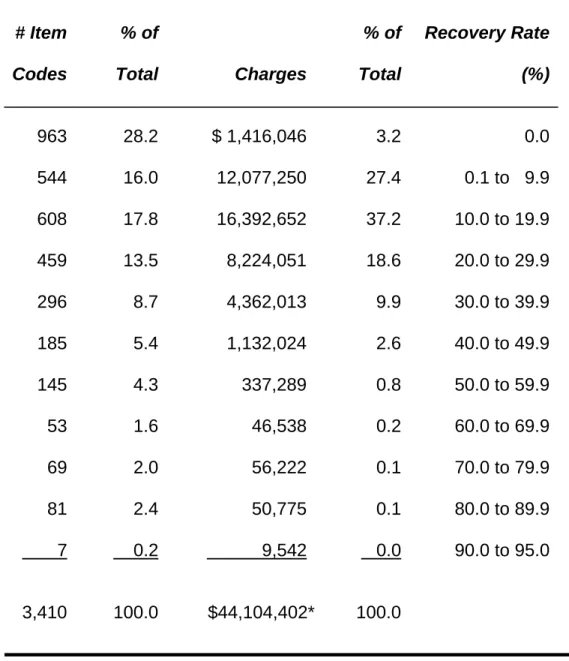
Table 5 presents a distribution of recovery rates for our case study hospital. This distribution is similar for most hospitals. Very few item codes and very little dollar volume will have recovery rates greater than 30% in most hospitals.
Model Constraints
Most pricing studies deal with three major model constraints:
¾ Absolute total charge increase
¾ Corridors for individual item codes
¾ Competitive price limits
In our case study hospital, a 10% total charge increase was planned, or $17,641,600 on an annualized basis. The larger this number is, the greater the potential for increased profit. Hospitals with either low current prices or strong market positions usually feel more comfortable with larger rate increases. Sometimes, pharmacy and medical supplies items may be excluded from the pricing study because these prices may be formula driven. If these items are excluded, the rate base is reduced by approximately 15% to 25%, depending upon the hospitals’ service profile.
Rate corridors limit individual item code price changes. In our case study hospital, individual item code prices could be increased to 20% or reduced by as much as 20%. A rule of thumb in pricing studies is to limit the corridors to no more than twice the absolute rate increase. For example, a 10% overall rate increase would limit rate corridors to +20% and –20%. Larger corridors permit hospitals to load more of the total rate increase into areas with higher recovery rates, thus maximizing rate-increase profitability.
There are, however, two major disadvantages to high rate corridors. First, large corridors may destroy present pricing relativity. For example, consider polycillin (250 mg) and polycillin (500 mg) priced at $25 and $27, respectively. With 20% rate corridors, it is possible that the 250-mg dosage could be re-priced to $30 and the 500-mg dosage re-priced to $21.60, which is not logical or defensible. Careful review of relative price differentials must be undertaken in any pricing study, but large rate corridors greatly increase the probability of undesired results. Second, large rate
corridors can also eventually kill the goose that laid the golden egg. Increasing prices to payers who pay charges may hurt their competitive position and eventually force them to exit the market, leaving low fixed-fee payers.
The inclusion of competitive price restraints can help reduce the negative effects of large rate corridors by ensuring that the hospital’s prices are close to those of market
competitors. Competitor prices are usually taken from large public-use file databases, specifically MedPAR and the Standard Analytical Outpatient File. Both databases are derived from Medicare claims and provide comparative prices for both room rates and procedures with a CPT® or HCPCS code. The major areas excluded would be pharmacy and medical supplies. Because pharmacy and medical supplies prices are often formula driven, the comparisons may not be so important.
Table 6 shows the effect of the competitive pricing constraint for our case study hospital. Notice that selective price changes with rate corridors produced $734,867 more in profit than an across-the-board 10% rate increase ($3,778,484 - $3,043,617). This result was obtained even with a competitive price constraint in force. If the hospital ignored the competitive price constraint, it could further increase profit by $1,450,976 to $5,229,460. The competitive price constraint dampened profit significantly because this is a high-price hospital, but that constraint also should help create more defensible pricing in its market. Competitive price constraints will reduce profitability in most cases, and
management must decide whether they want short-term profits or long-term competitive market positions.
Conclusions
Pricing is an effective strategy for increasing hospital profitability. Across-the-board price increases, while easy to implement, are not usually so effective as selective price increases. Selective price increases typically increase profit potential by 30% to 80% and may create stronger price competitiveness if combined with detailed competitive price constraints.
Table 1. Impact of Pricing
icing
10%
10%
Price
Price
Increase
Increase
1999 Acute Care
1999 Acute Care
10% Charge
10% Charge
25% Charge
25% Charge
– US Average*
– US Average*
Recovery
Recovery
Recovery
Recovery