VOLUME 15 VOLUME 1 (2017), 333 - 346
MODELLING WILLINGNESS TO PAY FOR IMPROVED PUBLIC TRANSPORT SERVICES: THE CHALLENGES OF NON-RESPONSE
TO STATED PREFERENCE HYPOTHETICAL QUESTIONS
Syahriah Bachok1, & Zakiah Ponrahono2
1Kulliyyah of Architecture & Environmental Design
INTERNATIONAL ISLAMIC UNIVERSITY MALAYSIA
2 Faculty of Environmental Studies
UNIVERSITI PUTRA MALAYSIA
Abstract
The paper focuses on the modelling attempt of willingness to pay for an improved bus service in selected cities and towns of Malaysia. Using responses from on-board intercept surveys, 1,130 samples of bus passengers have been analysed so as to arrive at a simplified model of how passengers trade off their money with possible upgrading of bus services elements. The willingness to pay among these bus riders was very low, despite the high expectation of improvements aspired by them. For service providers, fares are a function of travel time, travel distance and other operating costs. For passengers, the utility function is explained by costs, time, distance and various latent parameters. This paper highlights the significant results of chi-square analysis at various confidence levels. However, modelling the exact utility function of preferences for staggered increased in fares could not be carried out successfully at 95 percent confidence level, due to the relatively small number of respondents stating their and/or undecided response to willingness to pay for the additional fare rate. The issue of non-response to hypothetical survey questions is also raised, explaining the difficulties in modelling this choice behaviour.
Keyword: Public transport, bus, willingness to pay, frequency, increased fare.
Date Received: 30th April 2016
Hypothetical Questions
INTRODUCTION
Improvement of public transport services is essential in ensuring the maintenance of operation and sustenance of patronage. Among the less unattractive public transport provision is the bus service. Buses are more susceptible to congestion and incidents due to shared road spaces with other road users and vehicles, having no exclusive right of ways. For users, higher aspiration could be expected compared to rail and taxi services due to the lower comfort and convenience levels offered to bus passengers.
This paper elaborates on the passengers’ expectation of improved bus services in various aspects. The case study presented in this paper is eight towns and cities in four Malaysian states of Johor, Pahang, Perak and Penang. The aim of the research is to model the willingness to pay for an increased fare rate among passengers for specific bus improvement areas. The objectives of the research are: i) to identify the socio-demographics of bus passengers in Malaysia, ii) to determine the proportion of passengers willing to pay additional fare in return of improved bus services and iii) to develop simplified model explaining such willingness.
BUS FARES AND WILLINGNESS TO PAY
Contemporary literature has been focusing on improvement of buses in various aspects of the services. The focus of this paper, is however, limited to the determination and structuring of the fare system. Basic fare system which concentrated on time and distance costs has been discussed by Turvey and Mohring (1975), and Pedesson (2003). The utility function for fare structure, has been globally set to be consisting of travel time which include both in-vehicle time and waiting time, travel distance and seating capacity.
Other factors or parameters found to be significant in determining the fare amount and structure are fleet supply or vehicular interior configuration, as well as fuel type and utilisation rate. Among these studies, O’Garra et al., (2007), Ricci, Bellaby and Flynn (2008), and Saxe, Folkesson and Alvfors (2007) have discussed the effects of fleet and vehicular aspects such as chassis, fuel, route capacity and seating or standing capacities on fare structure change.
Time variability, confidence in schedules and consistency in operation time, headways and frequency have been found to be significant in determining fare structure as propagated by Phanikumar and Maitra (2007), Hensher and Stanley (2003), Li, Hensher and Rose (2010), and Dodgson and Katsoulacos (1988).
also deemed important in explaining the changes in fare structure and system (Espino, Roman & De Ortuzar, 2006).
Most researches have been contemporary yet were not conducted in South East Asian context, let alone, in the Malaysian scenarios. Hence, it is timely and essential that such similar study be undertaken in the Malaysian context so as to assist operators, regulators and authorities relevant to the public transport sectors to understand better the local or domestic bus fare and market structure.
METHODOLOGY
The research has deployed on-board intercept survey upon some 1,130 samples from four different states in Malaysia, namely Johor, Pahang, Perak and Penang. By 2014, National Key Results Areas of the Malaysian public transportation have been almost completely undertaken, with various initiatives and bus improvement schemes being implemented.
During the survey, passengers on board bus vehicles were approached with questionnaire survey set to be completed and returned within the respective duration of the bus trips. Questions were relating to socio-demographics, trip characteristics, perception of current or existing bus services, anticipation and aspiration of the future services and the hypothetical amount in fare increased given such anticipated improvement be implemented within stipulated time period.
Descriptive and inferential analyses have been conducted using SPSS version 23 software. The next section elaborates both analyses.
FINDINGS AND DISCUSSION
Socio Demographics
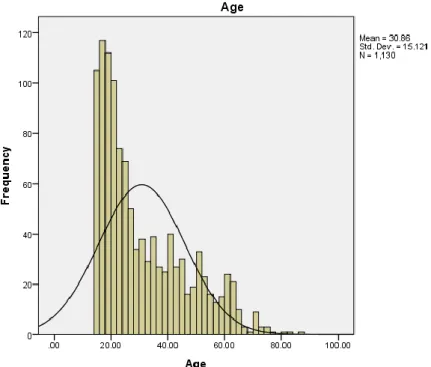
Hypothetical Questions
Figure 1 Respondents’ Age Range
Trip Characteristics
Rides for leisure (43 percent) and commuting (38 percent) purposes on the bus were in the majority. The answers relating to fare would be expected to be very elastic because of the leisurely nature of the trips made.
Table 1 Respondents’ Trip Purpose
Frequency Percent
Business 47 4.2
Educational 167 14.8
Leisure 490 43.4
Workplace 426 37.7
Total 1130 100.0
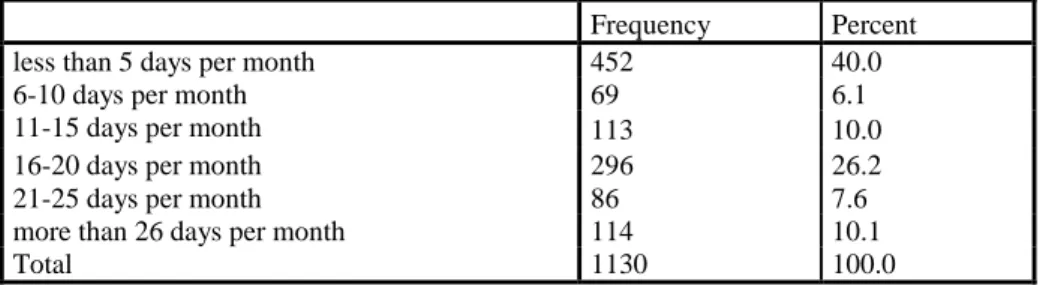
Table 2 Respondents’ Current Monthly Trip Frequency
Frequency Percent less than 5 days per month 452 40.0
6-10 days per month 69 6.1
11-15 days per month 113 10.0 16-20 days per month 296 26.2 21-25 days per month 86 7.6 more than 26 days per month 114 10.1
Total 1130 100.0
Bus Conditions and Improvements Aspired
In general, passengers surveyed were dissatisfied (60 percent) with the current bus services, reflecting the possibility of lower willingness to pay for increased rate of fare. These passengers had already had negative perception of the quality of services provided and would not be in favour of any price increase. This is further supported by the list of improvements aspired by the respondents. Most remarks (31 percent) were made on punctuality, frequency, departure and arrival time. Next, they would prefer clean and comfortable vehicles (17 percent) and new or modern vehicles (10 percent). It can be said that, expectation was high of the current quantity and quality of vehicle fleet. Waiting facilities were also of great concern (7 percent). Affordability (6 percent) however, received less than proportionate attention by the respondents. Information provision and safety or security issues were also ranked lower by respondents (4 percent, respectively). Some 19 percent users did not respond to this question. It is quite common that survey of this nature to receive non-preference feedback as discussed by various authors (Sanchez & Morchio, 1992; Duffy & Smith, 2005). Refer Table 3 and Table 4 below.
Table 3 Respondents’ Satisfactory Level with the Existing Bus Services Frequency Percent
Dissatisfied 682 60.4
Between Satisfied and Dissatisfied 242 21.4
Satisfied 206 18.2
Total 1130 100.0
Table 4 Respondents’ Aspiration of Aspect of Bus Services to be Improved Frequency Percent On-time service and more frequent 353 31.2 Reliable and accurate information 54 4.8 Comfort and clean vehicles 195 17.3 Safe and Secure service 47 4.2
Affordable service 70 6.2
Hypothetical Questions
No comment or positive comment for current service 216 19.1
Total 1130 100.0
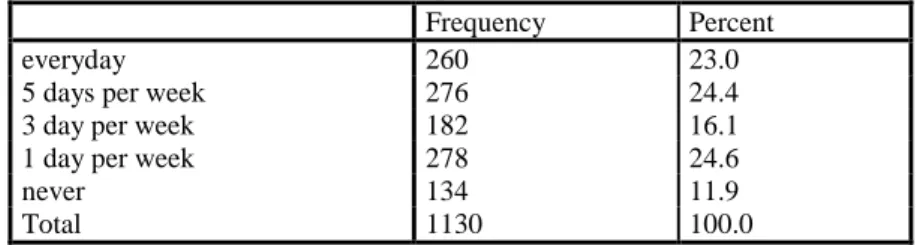
Respondents were also asked about other preferences. The stated preference for frequency of use can be seen almost equally distributed (between 16 percent and 25 percent). Lower responses (12 percent) were gained for “never” to ride the bus again. The majority (41 percent) would prefer buses to operate between 6am and 10pm, which was a fairly appropriate service duration for a typical bus service. However, a high majority (62 percent) would like to see a more frequent service in the future, with buses arriving or departing every 15 minutes. This reflected the invariability of bus frequency that the respondents were experiencing, disclosing the issue of punctuality and headways. The speed at which most respondents (37 percent) preferred was that bus operating at 70 km per hour. Refer Table 5, Table 6, Table 7 and Table 8 below.
Table 5 Respondents’ Stated Preference of Trip Frequency if Bus Services are Improved
Frequency Percent
everyday 260 23.0
5 days per week 276 24.4 3 day per week 182 16.1 1 day per week 278 24.6
never 134 11.9
Total 1130 100.0
Table 6 Respondents’ Stated Preference of Bus Service Duration Frequency Percent 9.00am to 6.00pm 243 21.5 6.00am to 9.00pm 134 11.9 6.00am to 10.00pm 458 40.5 8.00am to 11.00pm 210 18.6 7.00am to 9.00pm 85 7.5
Total 1130 100.0
Table 7 Respondents’ Stated Preference of Bus Frequency
Frequency Percent every 60 minutes 43 3.8 every 45 minutes 40 3.5 every 30 minutes 190 16.8 every 20 minutes 152 13.5 every 15 minutes 705 62.4
Table 8 Respondents’ Stated Preference of Bus Average Speed
Frequency Percent
90 km/h 132 11.7
80km/h 220 19.5
70km/h 423 37.4
60km/h 228 20.2
45km/h 127 11.2
Total 1130 100.0
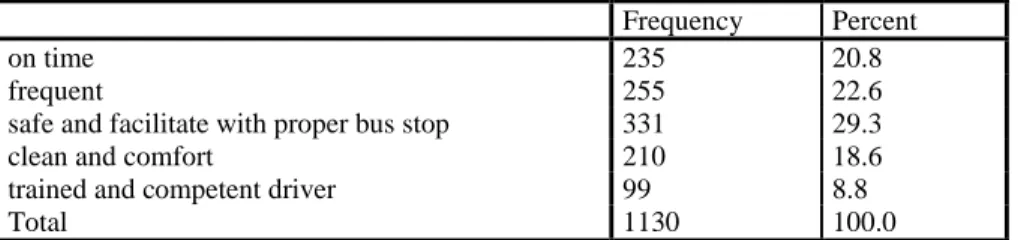
When posed with issues of priority improvements, respondents ranked high aspects related to safety and waiting facilities (29 percent). However, combined together (43 percent), issues relating to travel time, frequency and punctuality were deemed important too (Table 9).
Table 9 Respondents’ Stated Preference of Prioritised Area Public Transport Improvement
Frequency Percent
on time 235 20.8
frequent 255 22.6
safe and facilitate with proper bus stop 331 29.3
clean and comfort 210 18.6
trained and competent driver 99 8.8
Total 1130 100.0
A hypothetical scenario relating to fare increased in return for better and improved services was received with mixed responses. Table 10 below indicates passengers surveyed perceived that safety, comfort and cleanliness (30 percent) were the stronger aspects to be prioritised if fare was to be increased. This was followed by provision of wifi and television on board (25 percent), quality drivers (17 percent), fully seated vehicles and electronic fare system (14 percent respectively).
Table 10 Respondents’ Stated Preference of Bus Services Aspects, if They Have to Pay Increased Fare Rate
Frequency Percent trained and competent driver 188 16.6 safe, comfort and clean bus 337 29.8 provide wifi and tv 283 25.0 no standing passengers 162 14.3 electronic ticketing system 160 14.2
Hypothetical Questions
Figure 2 The Distribution of Ranges of Current Fare Paid Respondents
Current fare ranges paid by respondents was from RM0.00 to RM10.00 (Figure 2). Half of respondents (50 percent) paid between RM2.01 and RM3.00. Some 20 percent paid RM1 and less. This was followed by those who paid between RM3.01 and RM4.00 (17 percent). About 10 percent paid between RM4.01 and RM5.00. The remainder (3 percent) paid between RM5.01 and RM10.00.
Table 11 Respondents’ Stated Preference of Future Increased in Fare Frequency Percent Valid maintain current fare 1066 94.3
increase 10-20cent 40 3.5 increase 30-40cent 16 1.4 increase 50-60cent 8 .7
Total 1130 100.0
Willingness to Pay for Additional Fare
This section elaborates the stated preference for increased fare rate. It discusses the attempts at modelling this preferential behaviour.
Table 12 Fare Increased Preferred by Respondents Willing to Pay for Increased Fare Frequency Percent
Valid increase 10-20cent 40 62.5 increase 30-40cent 16 25.0 increase 50-60cent 8 12.5
Total 64 100.0
Table 12 above, indicates that only 64 users surveyed preferred fare increase at various levels to be paid for improvement of bus services. The majority (63 percent) were willing to spend some RM0.20 for this purpose. A quarter (25 percent) were willing to pay additional RM0.40 to see bus improvements in the near future. For the 6 percent respondents who were willing to pay additional fare in return for improved bus services, the followings are the aspects of bus improvements they would like to see in the near future (Table 13).
Table 13 Bus frequency Preferred by Respondents Willing to Pay for Increased Fare Frequency Percent
Valid every 60 minutes 2 3.1 every 30 minutes 9 14.1 every 20 minutes 7 10.9 every 15 minutes 46 71.9
Total 64 100.0
Hypothetical Questions
Table 14 Bus Improvement Priority Areas by Respondents Willing to Pay for Increased Fare
Frequency Percent Valid increase the safety 15 23.4
fix trip/schedule 6 9.4
on time trip 8 12.5
more frequent trip 8 12.5 waiting time less than 10-15 min 5 7.8 comfort (wifi, air-cond, etc.) 21 32.8 to remain the current fare 1 1.6
Total 64 100.0
Modelling
Inferential analysis for this study has been chi-square tests and a linear regression modelling for the willingness to pay additional fare. The following tables provide the analysis results.
Table 15 Chi-Square Cross Tabulation of Fare Choices (DV) * Reason to Increase Fare (IV)
Reason to increase fare collapse Total Comfort safety and latent
parameters
Travel time parameters increase 10-20cent
increase 30-40cent increase 50-60cent
21 19 40
9 7 16
7 1 8
Total 37 27 64
Chi-Square Tests
Value df
Asymptotic Significance (2-sided)
Pearson Chi-Square 3.370a 2 .185
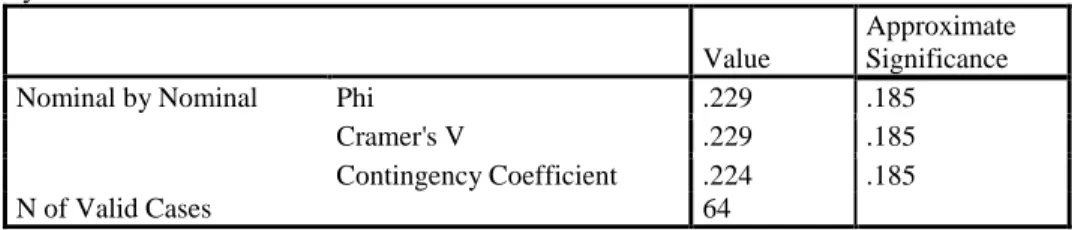
Symmetric Measures
Value
Approximate Significance Nominal by Nominal Phi .229 .185
Cramer's V .229 .185 Contingency Coefficient .224 .185
N of Valid Cases 64
From the three tables above, results have shown that willingness to pay for additional fare were not significantly different for those users who preferred improvements in latent variables (comfort and safety) compared to those preferring travel-time related variables. At 95% confidence level, p-value was 0.185 (higher than critical 0.05) and Phi and Cramer’s V values were small (0.229), indicating a failure to reject the null hypothesis.
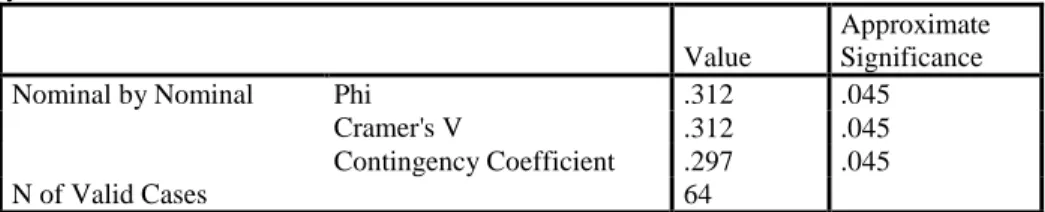
Another attempt at explaining the willingness to pay additional charge was upon the headways of bus in an hour. The three tables below, show that bus headways or frequency in an hour had been significant in explaining the difference in fare increased preferred by users surveyed. The results of p-value at 0.045 and slightly higher Phi and Cramer’s V value of 0.312, indicated a significant relationship between fare rate increase and bus frequency. In other words, passengers who were positive about additional fare would consider paying more for increased bus frequency or reduced headways.
Table 16 Chi-Square Cross Tabulation of Fare Choices (DV) * Preferred Bus Frequency (IV)
Preferred frequency
Total
1 4
Fare choices increase 10-20cent 4 36 40 increase 30-40cent 6 10 16 increase 50-60cent 1 7 8
Total 11 53 64
Chi-Square Tests
Value df
Asymptotic Significance (2-sided) Pearson Chi-Square 6.213a 2 .045
Hypothetical Questions
Symmetric Measures
Value
Approximate Significance Nominal by Nominal Phi .312 .045
Cramer's V .312 .045 Contingency Coefficient .297 .045
N of Valid Cases 64
Next, a simple linear regression was carried out to model the willingness to pay for increased fare, in the attempt at predicting the value for money of these respondents. The following four tables can be summarised to represent a significant model at 90 percent confidence level, with fare rate increased being positively determined by the increased in bus frequency or reduced headways (albeit lower R2 = 0.049 and p-value of 0.080). The derived utility function would be as follows: Fare increased = RM0.18 + 0.347 (hourly bus frequency)
Table 17 Regression Analysis for Variables Entered/Removed Model Variables Entered Variables Removed Method 1 Preferred frequencyb . Enter
a. Dependent Variable: Fare choices b. All requested variables entered.
Table 18 Model Summary
Model R R Square Adjusted R Square Std. Error of the Estimate 1 .221a .049 .033 14.014
a. Predictors: (Constant), preferred frequency
Table 19 ANOVAa
Model
Sum of
Squares df Mean Square F Sig. 1 Regression 623.827 1 623.827 3.176 .080b
Residual 12176.173 62 196.390 Total 12800.000 63
a. Dependent Variable: Fare choices
b. Predictors: (Constant), preferred frequency
Table 20 Coefficientsa
Model
Unstandardized Coefficients
Standardized
Coefficients t Sig. B Std. Error Beta
(Constant)
Preferred frequency
RECOMMENDATIONS AND CONCLUSION
This paper has discussed the perception of 1,130 bus passengers on the current bus services in four Malaysian states. From the analysis, the users surveyed had generally negative views on the existing service provision. They were highly aspired to see more improvements on buses services, especially in the following aspects: travel time, waiting time, punctuality and bus frequency. Also receiving attentions were issues of safety, comfort and vehicles quality. Hence, these are priority areas that bus operators, vehicle suppliers, transport regulators and monitoring authorities and respective agencies related to public transport must be focusing on, when initiating pilot improvement schemes or investing in the future public transport systems.
When hypothetically faced with increase fare rates, preferences were clearly skewed towards increased frequency or reduced headways compared to other latent variables. The paper has attempted at modelling and predicting the necessary improvements in bus services, especially with regards to frequency, when the inevitable price or fare increase is to be executed by public transport operators or regulators.
All three objectives of the papers, including determining the proportion of passengers willing to pay additional fare amount in return of improved bus services, and developing a model explaining such willingness have been achieved. It is therefore concluded that, public transport passengers were willing to pay for additional fare, provided that service frequency was to be increased. This paper confirms findings of previous research by Hensher and Rose (2010), and Phanikumar and Maitra (2007). The findings were also in congruent with previous on issues faced by hypothetical questionnaire types of data collection methodology, whereby high proportion of respondents were not willing to help in determining prices or monetary values even if they possessed the expertise and experiences to answer these questions types as propagated by Sanchez & Morchio (1992), Lietz and Petra (2008) and Duffy and Smith (2005).
REFERENCES
Dodgson, J. S. & Katsoulacos, Y. (1988). Quality competition in bus services: some welfare implications of bus deregulation. Journal of Transport Economics and Policy, 22(3), 263-281.
Duffy, B., & Smith, K. (2005). Comparative data from online and face-to-face surveys. International Journal of Market Research, 47(6), 615-639.
Espino, R., Roman, C., & De Ortuzar, J. D. (2006). Analysing demand for suburban trips: a mixed rp/sp model with latent variables and interaction effects. Transportation, 33(3), 241-261.
Gibbs Jr., R. W., & Bryant, G. A. (2008). Striving for optimal relevance when answering questions. Cognition, 106, 345-369.
Hypothetical Questions
Hess, D. B., Brown, J., & Shoup, D. (2004). Waiting for the bus. Public Transportation, 7(4), 67-84.
Li, Z., Hensher, D. A., & Rose, J.M. (2010). Willingness to pay for travel time reliability in passenger transport: A review and some new empirical evidence. Transportation Research Part E: Logistics and Transportation Review, 46(3), 384-403.
Lietz, P. (2008). Questionnaire design in attitude and opinion research: current state of an art (655 Working Paper), Jacobs University, Bremen.
Liu, Z., & Jansen, B. J. (2017). Identifying and Predicting the Desire to Help in Social Question and Answering. Information Processing and Management, 53, 490-504. Manisera, M., & Zuccolotto (2014). Modelling “Don’t Know” Responses in Rating
Scales. Pattern Recognition Letters, 45, 226-234.
Martinez-Espineira, R., & Lyssenko, N. (2012). An alternative approaches to dealing with respondent uncertainty in contingent valuation: a comparative analysis. Journal of Environmental Management, 93, 130-139.
O’Garra, T., Mourato, S., Garrity, L. et al. (2007) Is the public willing to pay for hydrogen buses: a comparative study of preference in four cities. Energy Policy, 35(7), 3630-3642.
Phanikumar, C. V., & Maitra, B. (2007). Willingness to pay and preference heterogeneity for rural bus attributes. Journal of Transportation Engineering, 133(1), 62-69. Pedesson, P. A. (2003). On the optimal fare policies in urban transportation.
Transportation Research Part B: Methodological, 37(5), 423-435.
Politis, I., Papaioannou, P., Basbas, S., & Dimitriadis, N. (2010). Evaluation of a bus passenger information system from the users’ point of view in the city of Thessaloniki, Greece. Research in Transportation Economics, 29(1), 249-255. Ricci, M., Bellaby, P., & Flynn, R. (2008). What do we know about public perceptions
and acceptance of hydrogen bus? A critical review and new case study evidence. International Journal Hydrogen Energy, 33(21), 5868-5880.
Sanchez, M. E., & Morchio, G. (1992). Probing “don’t know” answers effects on survey estimates and variables relationships. Public Opinion Quarterly, 56, 454-474. Saxe, M., Folkesson, A., & Alvfors, P. (2007). A follow up and conclusive report on the
attitude towards hydrogen fuel cells buses in the cute project – from passengers in Stockholm to bus operators in Europe. International Journal of Hydrogen Energy, 32(7), 4295-4305.