Fault Diagnostics of Centrifuge Pump Using Data Analysis in
Spectrometric Method
Mansour Esmaeilpour and Elnaz Nomigolzar
Engineering Dept., Islamic Azad University-Hamedan Branch, Hamedan, Iran E-mail: [email protected]
Mohamad Reza Feyzi Derakhshi
Engineering Dept., University of Tabriz, Tabriz, Iran
Zarina Shukur
Faculty of Information Science and Technology, National University of Malaysia, Malaysia E-mail: [email protected]
Keywords:vibration analysis, spectrometry, centrifuge pomp, kurtosis and fault diagnostics
Received:October 1, 2009
Vibrations analysis is one of the main surveying methods in maintenance and fault detection of machines in the industry. This method has unique advantages and disadvantages relating to surveying and fault detection of the machine. Objective of this research is to show the relationship between vibrations analysis and fault detection. The major problem of the vibration analysis is using the sensitive aural of the vibration sensors by human experts. On the other hand, human fault is time consuming which shows the position of the proposed method that by removing the human factor and increasing the speed and accuracy of the fault diagnosis course to increase the performance of the proposed method. Faults detection of the equipment is one of the most suitable ways of caring about the device when the equipment is on. Predictive repairing methods are new types of preventive repairs which use modern measurement and processing techniques for accurate fault finding and accessing technical conditions of the devices during exploitation and specification when maintenance and repairing operation are needed. In order to study the vibrations in pumps and to find its fault, different conditions of pump (sound and defective) were investigated. By putting sensors in a horizontal and vertical direction, the information was recorded and data vector activity was done for several times. Data gathering process was performed on the sample of centrifuge pump for its fault diagnostics through spectrometry. The results of analysis were able to distinguish between sound and defective data by studying on its acceleration range but there were analyzed and studied for ensuring data of different rounds which was selected randomly. This method is compared with Multilayer Perception Artificial Neural Network form terms of the processing time and accuracy that the result shows the superiority of the proposed method. Time data spectrum which had range 8000 N/mm and higher was sound and in interval between 1000 N/mm and 2000 N/mm, there was a need to repair and in interval 1000 N/mm and lower, it was defective.
Povzetek: Predstavljena je metoda diagnosticiranja črpalk na osnovi vibracij.
1
Introduction
Some of the phenomena which occur in the nature are
specified well with statistical means and for this reason; one should have statistical look at random changes in such signals [7]. For example, self-correlation function of random process in time domain and its Fourier Conversion which are called power density spectrum are of the applied tools for analyzing these signals. On the other hand, there is an important class of signals such as static random process which doesn’t have limited energy and as a result Fourier Conversion. Such signals have limited average power and are specified with power density spectrum.
2
Maintenance and repair methods
(MaR)
Since early 1970s, changes in the industry have led to important movements in MaR. Changes which led to industrial mutation can be classified into three fields [3].
1. The formation of new requirements 2. New research
3. New MaR techniques
Nowadays, one can show the applied changes by commissioning the following
2.1
Methods in plants
Among mentioned methods, only part 3 is discussed which is stronger in application. American Production and Inventory Control Society is kind of preventive repair and maintenance on the basis of definition which denies MaR activities [2]. This MaR uses unnecessary statistical analyses (and even destructive) and predicts the time which preventive MaR activities should be executed on devices and equipment.
Detection of faults of the equipment is one of the most suitable ways of caring about the device when the equipment is on. Predictive repair methods is new type of preventive repairs which use modern measurement and processing techniques for accurate fault finding and getting access to technical conditions of the devices during exploitation and specification when MaR operation is needed [6].
Predictive MaR techniques such as vibrations analysis, infrared heat images, X ray, ultrasound fault diagnostics and something like these have allowed predicting the conditions of the device and decision about necessary repairs [4].
One can specify the position of Fault diagnostics using vibrations analysis and other methods in terms of application in the plants in case of commissioning such systems with suitable efficiency.
After this stage, it is necessary to perform a data gathering phase for recording vibrations from the sample of the selected pumps. With regarding the applicability of the plan, the samples were selected with special criteria [5]. For this purpose, one sample of the pump out of the sound pumps, one sample of the pump out of the defective pumps and one sample of the pump out of the sound pumps with long term function which have been used due to lack of defects are selected.
In averaging method, we consider time pulse of a round (on the basis of the shortest time of a round) on the basis of the shortest time by using this frequency and the obtained signals for the rounds with the longest time are renovated on the basis of the shortest time.
In this way, the problem of the asynchrony of the signals is solved to some extent. Then time averaging is done on these signals [10]. In this method, accelerometer has been put on the pump and the outlet signal is recorded from it in a time interval equivalent
to time of a round of circulation of the pump. Another example in the next time interval is averaged. When this process was done with the use of frequency sampling, the effect of the parameters relating to tested pump such as strokes resulting from collision of the vane in average signal increased and the specifications relating to other pumps and other factors such as noise were excluded from the average.
For distinguishing between the intervals, a tachometer is used for the creation of the pulses or frequencies equivalent to reference shaft rotation frequency. Then, this pulse frequency is changed on the basis of ratio of the speed which is obtained according to the number of vanes of the engaged pump in such a manner that the limited length of the sampling is considered to be equivalently to a round of pump. The results are recorded as a diagram of average signals in which the number of signal equals to the number of rounds of the pump.
2.2
Data spectrometry
Analysis techniques in the area of frequency for the vibration of signals and their related processing as well as results related to spectrum analysis give us clear information about rotary sets fault detection [8].
Therefore, by using of this method, one can separate important faults from each other and identify them:
- Imbalance
- Failure of vans
- Failures of ball bearing resonance
Studying on the performed research shows that ball bearing clearance decreases the range of vibration in the frequency and will increase its harmony [7]. In this paper, peer to peer frequency results of pump signals are studied with the reference signals which have been used. Regarding the fact that it is possible to change the speed of the pump from revision to revision, in signal time field averaging method, peer to peer study will not be possible. As a result, for doing such direct comparison between signals, Fourier Conversion of the time field average signals is calculated. This method and other methods which are common in industry may detect only the fault and do not give enough information about the place and degree of fault [9]. More importantly, computer software's and systems for faultfinding the simple machines such as pumps; ball bearing and etc. have been designed more widely and used in industry but research continues on some more complex systems faultfinding such as pumps.
3
Machinery pump and a
possibility to provide data
gathering medium
two channels for tachometer and two channels for acceleration. Tachometer is also the type 0023 made of the same company. Totally 20 seconds were considered for each one of them and the analysis was done in terms of time. This was done by the cooperation of Idem Plant and University of Tabriz and Faculty of Mechanics by conclusion of a contract. Before data gathering, we need to signal synchronous by averaging. In Figure 1 we can see the Averaging process of two signals.
Figure 1: Averaging process of two signals.
Figure 2: The position of the sensor on output shaft of centrifuge pump (right side) and an indicator which is sensitive to a laser (left side).
Figure 3: Data gathering manner with the related software and pulse device
As shown in Figure 2, two sections of the photo have been shown with a white color and on the right side is an acceleration sensor and on the left side is a label sensitive to the laser light which indicates rotation of the tachometer. In Figure 3, pulse device, tachometer, a computer the laser tachometer and the manner in which b they are positioned are shown. The software which is recording data is completely specified.
In Figure 4, the position of tachometer (opposite to label sensitive to laser) is shown clearly.
Figure 4: Tachometer positioning manner for recording output shaft speed.
After performance of data gathering phase, it is necessary to take an action regarding the reduction of noise on it and data averaging is one of the methods which are used as follows:
3.1
Stages of doing research on samples
of machinery pump
1. Performance of a data gathering phase for samples of machinery pump
2. Studying data and if necessary the performance of noises reduction methods.
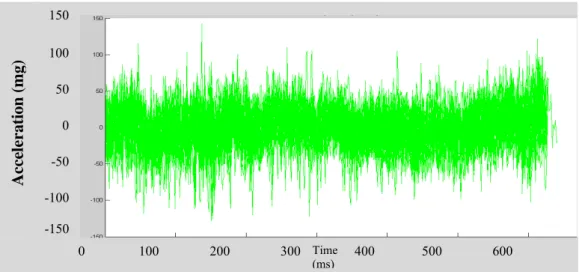
Figure 5: The representation of raw data relating to sound pump. Data relating to sound pump with a high function was
given of which 30 rounds have been shown in Figure
5, 6 we can see raw data relating to sound pump with one round of tachometer.
Figure 6: The representation of raw data relating to sound pump with one round of tachometer. By comparing this data with mean data and calculating
their kurtosis in figure 7, we find out a failure to perform noise reduction stage to some extent
.
Figure 7: The representation of mean data sound pump with one round of tachometer.
0 100 200 300 400 500 600 Time (ms)
150 100 50 0 -50 -100 -150
A
cc
el
er
a
ti
o
n
(
m
g
)
0 100 200 300 400 500 600 700 Time (ms)
150 100 50 0 -50 -100 -150
A
cc
el
er
a
ti
o
n
(
m
g
)
150 100
50
0
-50
-100 -150
A
cc
el
er
a
ti
o
n
(
m
g
)
4
Signals analysis
According to the procedures of pump fault diagnostics studies, a program was designed for its data analysis and also the spectrometry of pump data for its program in three selected samples with different rounds, one can archive desirable applications.
These results can be explained with the obtained figures.
Figure 8, shows 30 rounds of sound pumps raw data.
Figure 8: The representation of raw data relating to sound pump with 30 rounds of tachometer.
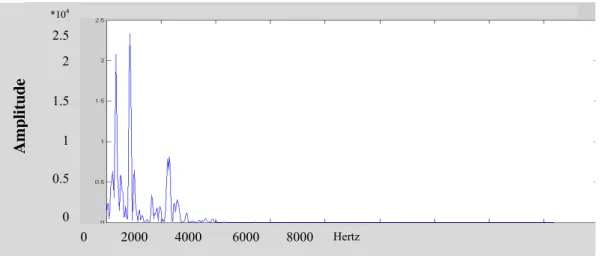
Figure 9 shows the result of spectrometry from the first round of this data (Sound) which frequency analysis includes
applied results by comparing its range and interval.
Figure 9: The representation of spectrometry of a round of pump By observing Figure 9, data spectrum frequency
interval up to 0-2000 Hz has a range of 2500 N/mm and in interval of 2000-4000Hz; it has a range of 8000 N/mm. This result shows its efficiency for sample of the pumps with different functions by studying the next rounds spectrometry (these results have been studied for different rounds in different intervals of which only some rounds are referred).
In Figure 10, 11 we can see the sound pump (with short term function) by data analysis for four different rounds.
0 2000 4000 6000 8000 12000 Time (ms) 100
80 60 40 20 0 -20 -40 -60 -80 -100
A
cc
el
er
a
ti
o
n
(
m
g
)
0 2000 4000 6000 8000 Hertz *104
2.5 2
1.5
1 0.5 0
A
m
p
li
tu
d
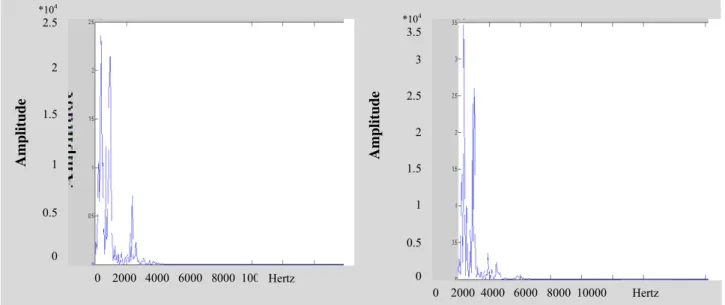
Figure 10: The representation of a sound pump round spectrometry #1, 2 (with a short term function).
Figure 11: The representation of a sound pump round spectrometry # 3, 4 (with a short term function). In Figure 12, 13 we can see the sound pump (with a long term function) by data analysis for four different rounds too.
Figure 12: The representation of a sound pump round spectrometry # 1, 2 (with a long term function) 0 2000 4000 6000 8000 10000 Hertz
*104 2.5 2 1.5 1 0.5 0 A m p li tu d
0 2000 4000 6000 8000 10000 Hertz *104 3 2.5 2 1.5 1 0.5 0 A m p li tu d e
0 2000 4000 6000 8000 10000 12000 14000 16000 Hertz 12000 10000 8000 6000 4000 2000 0 A m p li tu d e
0 2000 4000 6000 8000 10000 12000 14000 16000 Hertz 10000 9000 8000 7000 6000 5000 4000 3000 2000 1000 0 A m p li tu d e
0 2000 4000 6000 8000 10000 Hertz *104 2.5 2 1.5 1 0.5 0 A m p li tu d e
Figure 13: The representation of a sound pump round spectrometry #3, 4 (with a long term function)
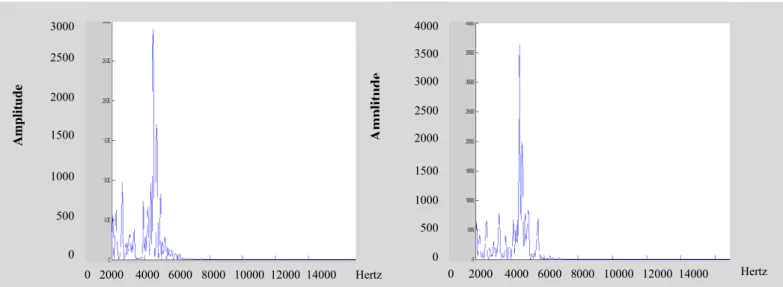
For comparing the sound and defective pumps, in this section (Figure 14, 15) we show the defective pump (with a long term function) by data analysis for four different rounds.
Figure 14: The representation of a defective pump round spectrometry #1, 2
Figure 15: The representation of a defective pump round spectrometry #3, 4 0 2000 4000 6000 8000 10000 12000 14000
A m p li tu d e
0 2000 4000 6000 8000 10000 12000 14000 Hertz
A m p li tu d e 3000 2500 2000 1500 1000 500 0 4000 3500 3000 2500 2000 1500 1000 500 0 Hertz
0 2000 4000 6000 8000 10000 12000 14000 16000 Hertz
A m p li tu d e
0 2000 4000 6000 8000 10000 12000 14000 16000 Hertz 10000 9000 8000 7000 6000 5000 4000 3000 2000 1000 0 A m p li tu d e 10000 9000 8000 7000 6000 5000 4000 3000 2000 1000 0
0 2000 4000 6000 8000 10000 12000 14000 16000 Hertz
A m p li tu d e
Considering the presented diagrams for the pumps including sound with low function, a sound with a long term function and defectiveness and their data analysis in different rounds, the following results are obtained:
1- In data analysis, if the interval of their acceleration frequency has a range 10000 N/mm and higher between 0 Hz and 2000Hz and 8000 N/mm and higher between 2000 Hz and 4000 Hz, the related pumps will be considered a sound and there will be no need to repair and study.
2- If their acceleration frequency between interval of 0 Hz and 2000 Hz has a range of 2000 N/mm and lower and between interval of 2000 Hz and 10000 Hz, it has the same range or lower and close to 0 N/mm, the related pump will be considered defective but they can continue operating (in case
that predictive MaR system has been
commissioned, such pump will be subject to revise).
3- In case that acceleration infrequency is wider and has a range of 1000 N/mm and lowers between interval of 0 Hz and 2000 Hz and the same range between intervals of 2000 Hz and 4000 Hz, the related pump will be considered defective and will not be able to work.
The obtained results have been studied on the applied basis and are used and we can see them in table 1.
It is necessary to note that there is no need to prepare of training by using of artificial neural networks and other techniques and Fault diagnostics due to clarity of the results obtained from data analysis in spectrometric method.
Table 1: Results obtained from data analysis
5
Compare the proposed method
with MLP artificial neural
network
This method is compared with MLP artificial neural network form terms of the processing time and accuracy that the result shows the superiority of the proposed method. The artificial neural network used in this paper is multilayer perception with 15 hidden layers that the result, compared by the proposed method is as bellow. In this paper we used the vibration analysis that can detect the sound and defective pumps in less time and high accuracy. The
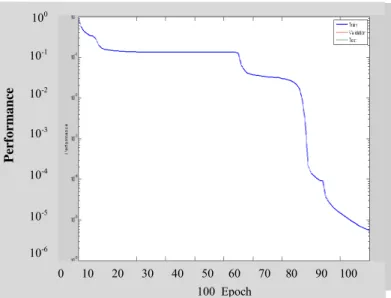
amplitude of the signals that obtained from the tachometer in the terms of the sound and defective pumps is very deferent, thus the proposed method can detect the sound and defective pumps in higher speed and accuracy that result show in figure 16 and Table 2.
Figure 16: The representation of MLP Neural Network and mean square of its error.
Time needed for detecting
by MLP Neural Network Time needed
for detecting by proposed
method Accuracy
in MLP Neural Network Accuracy
in proposed
method
582.8 sec 172.6 sec
94.583 100
Table2: The Results of the proposed method and MLPNN comparison.
6
Conclusion
By studying spectrometric data in different intervals, the following results were obtained from it:
- In case that the range of the acceleration obtained from analysis is about 8000 N/mm and higher, the pump will be considered sound.
- In case that the range of the acceleration obtained from analysis is between 1000 N/mm and 2000 N/mm, the pump will have no need for repair but it will work. - In case that the range of the acceleration obtained from
analysis is about 1000 N/mm and lower, the pump will be consider defective.
Reference
[1] Howard I., Jia S., Wang J., "The dynamic modeling of a spur gear in mesh including friction and a crack", mechanical systems and signal processing, 2001, vol. 15(5), pp.831-853. [2] Parker JR B. E., Ware H. A., Wipe D. P.,
Tompkins W. R., Clark B. R. and Larson E. C., "Fault diagnostics using statistical change detection in the bi-spectral domain", mechanical systems and signal processing, 2000, vol. 14(4), pp. 561-570.
Sample of Pumps
Intervals Hz
Acceleration domain
N/mm
Result
Pump #1 2000-40000-2000, 8000 and higher Sound
Pump #2 2000-100000-2000, between 1000 and 2000 Need to repair but it will work
Pump #3 2000-40000-2000, 1000 and lower The pump will be considered defective
0 10 20 30 40 50 60 70 80 90 100 100
10-1
10-2
10-3
10-4
10-5
10-6
P
er
fo
rm
a
n
ce
[3] Peng Z.K., Chu F.L., "The application of the wavelet transform in machine condition monitoring and fault diagnostics: a review with bibliography", Mechanical systems and signal processing, 2004, vol. 18, pp.199-221.
[4] Vafaei S., Rahnejat H., "Indicated repeatable run out with wavelet decomposition" (IRR-WD) for effective determination of bearing-induced vibration, Journal of sound and vibration, 2003, vol. 2260, pp. 67-82.
[5] Yang D.M., Stronach A.F., MacConnell P., Penman J., "Third-order spectral techniques for the diagnosis of motor bearing condition using artificial neural networks", Mechanical systems and signal processing, 2002, vol. 16(2-3), pp. 391-411.
[6] Yesilyurt I., "The application of the conditional moment’s analysis to gearbox fault detection-a comparative study using the spectrogram and scalogram", NDT&E International, 2004 vol. 37, pp. 309-320.
[7] Wuxing L., Tse Peter W., Guicai Z., Tielin S., "The classification of gear faults using cumulates and the radial basis function network", mechanical systems and signal processing, 2004, vol. 18, pp.381-389.
[8] Hashemi S.H., Farhadi S., Carra S., "Free vibration analysis of rotating thick plates", Journal of Sound and Vibration, 2009, vol. 323, pp. 366–384.
[9] Jarrar S.M., Hamdan M.N., "Nonlinear vibrations and buckling of a flexible rotating beam, a prescribed torque approach", Mechanism and Machine Theory, 2007, vol. 42, pp. 919–939. [10] G. Sofiane, Y. Said, S. Moussa, "Robust H