N
EW
B
ATTERY
M
ODEL
I
NTEGRATING THE
I
NTERNAL
R
ESISTANCE
A
S A
F
UNCTION OF
T
EMPERATURE
Zulhilmi Che Daud,*Muhammad Hafiz Alwi, Zainab Asus, Izhari Izmi Mazali
School of Mechanical Engineering, Faculty of Engineering, Universiti Teknologi Malaysia, 81310 UTM Johor Bahru, Johor, Malaysia
Article history
Received 1 June 2018 Received in revised form
11 June 2018 Accepted 19 November 2018
Published 28 November 2018
*Corresponding author [email protected]
G
RAPHICALA
BSTRACTK
EYWORDSLithium-ion Battery; Temperature Effect; Simulation.
I
NTRODUCTIONBattery is an important component used in hybrid Electric Vehicle (HEV). Lithium-ion battery is one of the most suitable choices for electric and hybrid vehicles as compared to lead-acid, nickel-cadmium, and nickel-metal hydride battery. This choice is based on the fact that it has superior properties such as high power rating, high energy density, and high cycle life [1, 2]. An effective method to predict the battery performance and health is using the battery model, which will be the main focus of this research.
Some existing battery models are able to predict the battery performance including the terminal voltage, current and state of charge (SOC) [3]. However, in an actual lithium ion battery, many other factors need to be considered, especially the thermal behavior of the battery. Thermal behavior can hugely impact the operation and capacity of the battery, not to mention most battery is heat sensitive and this can contribute largely to the battery safely.
This article presents a dynamic battery model constructed in Matlab/Simulink software. This model includes temperature effect, cycle number and storage time. The aim is to integrate the battery internal resistance dependent of temperature in the battery model. The result predicted by the model will be validated by comparing to experimental result.
L
ITHIUM-I
ONB
ATTERYM
ODELThe construction of basic battery model is done through series of equations taken from O. Erdinc et al [3]. Some modification is made to this basic model in order to simulate the temperature effect through battery internal resistance dependent of
A
BSTRACTtemperature. Parameters used in the model are as listed:
Vbat Battery output voltage [V]
Voc(soc) Battery open-circuit voltage [V]
ibat Battery current [A]
ΔE(T) Temperature correction of the potential [V]
R Internal resistance *Ω+ SOC State of charge [%] SOCinit Initial state of charge [%]
Cusable Usable battery capacity [Ah]
CCF Capacity correction factor Cinitial Initial battery capacity [Ah]
N Cycle number
k1, k2, k3 Coefficient
T Temperature [K] t Storage time [months]
Battery Output Voltage
The main formula of the output voltage is as follow:
Vbat= VOC(SOC)-ibat· R+ ∆E(T) [1]
In the basic model, the internal resistance is considered as a constant of 0.002 Ohm.
Battery Open Circuit Voltage
The battery open circuit voltage is measured as the difference of the electrical potential between positive and negative terminal without any external load [4]. It can be express as:
VOC(SOC)
=-1.031·exp(-35·SOC)+3.685+0.2156·SOC-0.01178·SOC2+0.321·SOC3 [2]
While the battery SOC is calculated by:
SOC=SOCinit-∫(ibat/Cusable )dt [3]
Effect of Capacity Fading
The condition of loss in battery usable capacity is known as capacity fading effect. This irreversible loss occurs due to time, temperature and cycle number. It can be distinguished into two component; calendar life loss due to occur whether the battery is inactive or stored and cycle life loss due to charge-discharge cycle number. Both variables can be expressed as the capacity correction factor as follow:
CCF=1-(Calendar life losses+Cycle life losses) [4]
The remaining battery capacity is calculated as follow:
Cusable=Cinital·CCF [5]
The calendar life loss is made up from storage loss if the battery is stored. It can be calculated using equation 6.
%capacity loss=1.544·107exp(-40498/8.3143T)t [6]
Cycle life loss is presented by the rate of change of negative electrode SOC as follow:
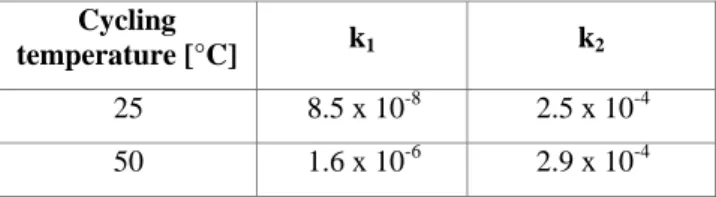
(dθn)/dN)=k1N+k2 [7]
Where the coefficient of k1 take into accounts
adverse condition such as cycling at high temperature by increased rapidly, while k2 take in
accounts usual condition of cycling. Changes of values k1 and k2 is obtain using the table 1 [3].
Table 1:Values of coefficient of k1 and k2 with variation to temperature
Cycling
temperature [°C] k1 k2
25 8.5 x 10⁻⁸ 2.5 x 10⁻⁴
50 1.6 x 10⁻⁶ 2.9 x 10⁻⁴
Temperature Correction of the Potential
Temperature correction, ΔE(T) is a representation of the variation of equilibrium potential caused by the temperature change. The formula for temperature correction will differ with temperature as proposed by L.Gaoet al. [5].
From temperature of -20°C to -10°C
ΔE(T)= 0.014·(T) - 4.0041 [8]
From temperature of -10°C to 0°C
ΔE(T)= 0.019·(T) - 5.3198 [9]
From temperature of 0°C to 23°C
ΔE(T)= 0.0057·(T) - 1.6739 [10]
From temperature of 23°C to 45°C
Internal Resistance in the Function of Temperature
In the battery model proposed by O. Erdinc[4], the battery internal resistance is considered as a constant of 2mΩ regardless of any temperature changes. However from recent studies [6], the internal resistance changes as the battery temperature changes. In this study, the equation for resistance as a function of temperature is extract from experimental study by CheDaudet al. [7]. The equation is as follow:
R=0.0009·(T2 )-0.0888·T+3.5625 [12]
Voltage Correction Factor
Voltage correction is introduced and added to the basic model to compensate the integration of resistance as a function of temperature. It is a unit less scalar factor that comes from the first degree polynomial equation. The proposed voltage correction equation is as follow:
Vbat=VOUT+[8.33x10⁻⁴(T)] [13]
R
ESULTSFigure 1 shows the Matlab / Simulink model for lithium-ion battery. This model is constructed based on equations stated in section 2.
Figure 1: Lithium-ion battery model in Matlab/Simulink software
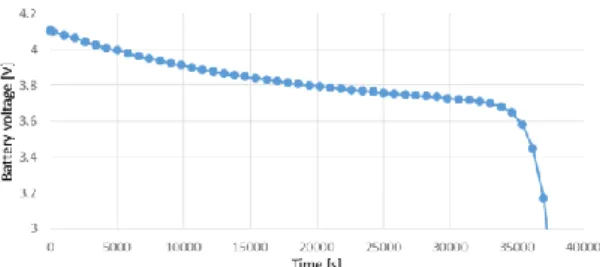
Model validation is conducted by comparing to the existing result found in literature at different temperature, cycling number and discharging condition. Figure 2(a) shows the result of simulation from the proposed battery model compared to the experimental result obtained by Chen et al [3] in figure 2(b), with the discharge of 80mA, battery capacity of 850mA at room temperature of 25°C. During the discharging process, the initial voltage is around 4.1V until it drops slowly to 3.7V and drastically drop to 3V.
Result shows that the model is capable to precisely predict the battery voltage.
Figure 2(a): Battery terminal voltage with 80mA charging for simulation
Figure 2(b): Battery terminal voltage with 80mA charging from Chen et al. [3]
Figure 3(a)-(b) show the voltage output of different cycle number at 25°C. Figure 3(a) shows the predicted voltage given by the proposed model, while Figure 3(b) show the result obtained from Chen et al. [3]. From the figure, with the increase in the battery cycle, the battery shows a decrease in the discharge capacity. From the Figure 3(a) also, it can be seen that the result obtains from simulation agreed with the result from literature [3].
Figure 3(a): Predicted battery output voltage at different cycle number (25°C)
Figure 4(a)-(b) show the effect of different cycle on the discharge rate at a constant temperature of 50°C. Figure 4(a) show the simulation result obtain from the proposed model, while Figure 4 (b) show the result obtained from Chen et al [3]. From the graph it can be seen that as the cycle increases, the discharge rate increases. With the voltage drop more exponentially when the cycle is 600 compare to 150.
Figure 4(a): Predicted battery output at different cycle number (50°C)
Figure 4(b): Battery output voltage at different cycle number from literature [3] (50°C)
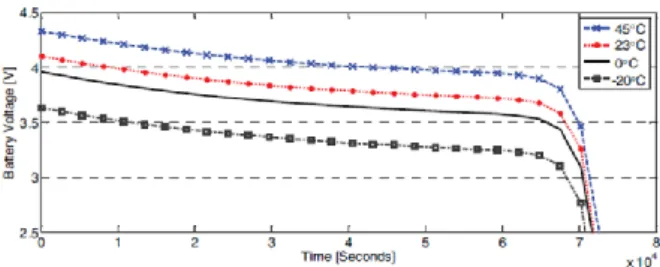
Figure 5(a)-(b) show the effect of different temperature on the discharge rate at a constant battery cycle. Figure 5(a) show the simulation result obtain from the proposed model, while Figure 5(b) show the result obtained from Chen et al [3]. From the graph it can be seen that as the temperature increases, the maximum voltage increases. However, the temperature change does not change the battery output voltage, with each condition runtime is almost the same.
Figure 5(a): Battery output voltage at different temperature from simulation
Figure 5(b): Battery output at different temperature from experiment
The model is tested using a variation of temperature increases over time as shown in Figure 6. The temperature in the Figure 6 is obtained by conduction the experiment on a li-ion battery at a constant discharge rate. The temperature increase and the battery voltage output is recorded. Figure 7 show the comparison of the battery output voltage from simulation and experiment. As observed, both results are very similar. The average error of the simulation graph is less than 5% for the whole graph, making the result as acceptable.
Figure 6: Change of temperature with respect to time at constant discharge rate
Figure 7: Voltage output from simulation compared to experiment
C
ONCLUSIONmodel with the new parameters is more accurate when compared to the experimental result. On top of that, the proposed model is able to predict the battery performance under various operating conditions, including different discharge rates, temperature and cycle number.
A
CKNOWLEDGEMENTSWe are grateful for continuous support from UTM especially through Potential Academic Staff (PAS: Q.J130000.2724.02K30) research grants.
R
EFERENCES[1]Guzzella, L. and Sciarretta, A. 2007. Vehicle Propulsion systems (Introduction to Modelling and Optimization). Springer, New York, second edition. [2]Chacko, S. and Chung, Y. M. 2012. Thermal modelling
of li-ion polymer battery for electric vehicle drive cycles. Journal of Power Sources. 213:296–303.
[3]Chen, M. and Mora, G. A. R. 2006. Accurate electrical battery model capable of predicting runtime and I-V
performance. IEEE Transactions on Energy
Conversion. 21:504-511.
[4]Erdinc,O., Vural, B. &Uzunoglu, M. 2009. A dynamic lithium-ion battery model considering the effects of temperature and capacity fading. IEEE Transactions on Components and Packaging Technologies. 384-386.
[5]Gao, L., Liu, S. and Dougal, R.A.2002. Dynamic Lithium-Ion Battery Model for System Simulation. IEEE Transactions on Components and Packaging Technologies. 25:495-505.
[6]CheDaud, Z. H., Chrenko, D., Dos Santos, F., Aglzim, E. -H., Keromnes, A., and Le Moyne, L. 2016. 3D
electro-thermal modelling and experimental
validation of lithium polymer-based batteries for automotive applications. International Journalof Energy Research. 40:1144–1154.