International Journal of Research in Engineering & Applied Sciences
Email:- [email protected], http://www.euroasiapub.org
7
Application of Genetic Algorithm to optimize cutting parameters for
minimizing surface roughness in end milling machining process
S.PRABHU *1
AssiatantProfessor,
Department of Mechanical Engineering, Excel College of Engineering and Technology,
Pallakapalayam, Komarapalayam - 637 303,Tamilnadu, India
K.VIJAYBABU *2
AssociateProfessor,
Department of Mechanical Engineering, Excel College of Engineering and Technology,
Pallakapalayam, Komarapalayam - 637 303,Tamilnadu, India
T.M.SAKTHIMURUGA*3
AssociateProfessor,
Department of Mechanical Engineering, Excel College of Engineering and Technology,
Pallakapalayam, Komarapalayam - 637 303,Tamilnadu, India
N.MAHESWARAN*4
PG Scholar,
Department of Aeronautical Engineering, Excel Engineering college,
Pallakapalayam, Komarapalayam - 637 303,Tamilnadu, India
K.VARUNYADAV*5,
UG Scholar,
Department of Mechanical Engineering, Excel College of Engineering and Technology,
Pallakapalayam, Komarapalayam - 637 303,Tamilnadu, India
S.T.THILLAIRAJA*6
UG Scholar,
Department of Mechanical Engineering, Excel Engineering college,
International Journal of Research in Engineering & Applied Sciences
Email:- [email protected], http://www.euroasiapub.org
8
Abstract
Milling is one of the progressive enhancements of miniaturized technologies which has wide range of application in industries and other related areas. Milling like any metal cutting operation is used with an objective of optimizing surface roughness at micro level and economic performance at macro level. In addition to surface finish, modern manufacturers do not want any compromise on the achievement of high quality, dimensional accuracy, high production rate, minimum wear on the cutting tools, cost saving and increase of the performance of the product with minimum environmental hazards. In order to optimize the surface finish, the empirical relationships between input and output variables should be established in order to predict the output. Optimization of these predictive models helps us to select appropriate input variables for achieving the best output performance. In this paper, four input variables are selected and surface roughness is taken as output variable, Genetic algorithm technique is used for finding the optimum set of values of input variables and the results are compared with
REGRESSION ANALYSIS in the literature.
1. INDRODUTION
CNC machining is a tool or a device that is critical to an industrial system. It is used to aid the design and the manufacturing of a product. These CNC machines are programmable to meet the specific requirements of users. They can run overnight and can continue to work without any intervention. SELECTION OF MATERIALS
For the machining operation here the following materials are chosen from the carbon steel group. They are
En 8 – medium carbon steel Mild steel –low carbon steel
CHAPTER 2
DESIGN OF EXPERIMENTSDesign of Experiments (DOE) is a statistical technique used to study multiple variables simultaneously. The conditions are created using a matrix, which allows each factor an equal number of test conditions. DOE begins with determining the objectives of an experiment and selecting the process factors for the study. An Experimental Design is the laying out of a detailed experimental plan in advance of doing the experiment.
CHAPTER 3
PURPOSE OF EXPERIMENTATION
International Journal of Research in Engineering & Applied Sciences
Email:- [email protected], http://www.euroasiapub.org
9
GOAL OF EXPERIMENTS:
Experiments help us in understanding the behavior of a (mechanical) system.
Data collected by systematic variation of influencing factors helps us to quantitatively describe the underlying phenomenon or phenomena
The goal of any experimental activity is to get the maximum information about a system with the minimum number of well designed experiments. An experimental program recognizes the major “factors” that affect the outcome of the experiment.
FACTORIAL DESIGN
There are many factorial models are available in design of experiments. Full factorial design
A full factorial design of experiments consists of the following: Vary one factor at a time
Perform experiments for all levels of all factors
Hence perform a large number of experiments that are needed 2K Factorial design
Consider a simple example of a 2k factorial design. Each of the k factors is assigned only two levels. The levels are usually High = 1 and Low = -1. Such a scheme is useful as a preliminary experimental program before a more ambitious study is undertaken. The outcome of the 2k factorial experiment will help identify the relative importance of factors and also will offer some knowledge about the interaction effects.
Fractional factorial design
Most of the time it is not possible to conduct that many experiments, that time can reduce the number of experiments and yet get an adequate representation of the relationship between the outcome of the experiment and the variation of the factors.
3.1 Response surface method
In Response surface method we can use various methods. And also particularly two methods only applied for the test the various parameters, central composite and Box – Behnken methods
3.2 Box – Behnken Method
Box – Behnken method mainly suitable for 3 factors 3 level in optimizing various parameters.factors that yield optimal business performance. Box – Behnken designs are a type of response surface method, which provides detailed information about the solution space allowing researchers to better understand the forces affecting the output of the model.
Advantages and limitations of the Box-Behnken design (BBD) for the optimization of analytical methods. It establishes also a comparison between this design and composite central, three-alevel full factorial and Doehlert designs.
A method for developing a mathematical model used to find combinations 3.3 REGRESSION ANALYSIS
In statistics, regression analysis includes any techniques for modeling and analyzing several variables, when the focus is on the relationship between a dependent variable and one or more independent variables.
International Journal of Research in Engineering & Applied Sciences
Email:- [email protected], http://www.euroasiapub.org
10
independent variables are related to the dependent variable, and to explore the forms of these relationships.
Linear regression
A statistical technique used to explain or predict the behavior of a dependent variable. Generally, a regression equation takes the form of Y=a+bx+c, where Y is the dependentvariable that the equation tries to predict, X is the independent variable that is being used to predict Y, a is the Y-intercept of the line, and c is a value called the regression residual. The values of a and b are selected so that the square of the regression residuals is minimized. In linear regression, the model specification is that the dependent variable, yi is a linear combination of the parameters. For example, in simple linear regression for modeling n data points there is one independent variable: xi, and two parameters, β0 and β1:
Linear Model
A linear model with two factors, X1 and X2, can be written as
Y = β0+ β1 X1+ β2 X2+ β12 X1 X2+ Experimental error (1)
Here, Y is the response for given levels of the main effects X1 and X2 and the X1X2 term is included to account for a possible interaction effect between X1 and X2. The constant β0 is the response of Y when both main effects are 0.
For a more complicated example, a linear model with three factors X1, X2, X3 and one response, Y, would look like (if all possible terms were included in the model) .
Y = β0+ β1 X1+ β2 X2+ β3 X3 +β12 X1 X2+ β13 X1 X3 + β23 X2 X3 + β123 X1 X2 X3 + Experimental error
The three terms with single "X's" are the main effects terms. There are k(k-1)/2 = 3*2/2 = 3 two-way interaction terms and 1 three-way interaction term (which is often omitted, for simplicity). en the experimental data are analyzed, all the unknown "β" parameters are estimated and the coefficients of the "X" terms are tested to see which ones are significantly different from 0.
Quadratic Model
A second-order (quadratic) model (typically used in response surface DOE's with suspected curvature) does not include the three-way interaction term but adds three more terms to the linear model, namely
β11 X12 + β22 X22 + β33 X32 Nonlinear regression
International Journal of Research in Engineering & Applied Sciences
Email:- [email protected], http://www.euroasiapub.org
11
CHAPTER 4
GRAPH RESULTS OF REGRESSION ANALYSIS NORMAL PLOT
In the normal probability plot of the effects, points that do not fall near the line usually signal important effects. Important effects are larger and generally further from the fitted line than unimportant effects. Unimportant effects tend to be smaller and centered on zero.
Fig. 4.1 Normal probability plot
If there is an error term, Minitab uses the corresponding p-values shown in the Session window to identify important effects. The normal probability plot uses α= 0.05, by default.
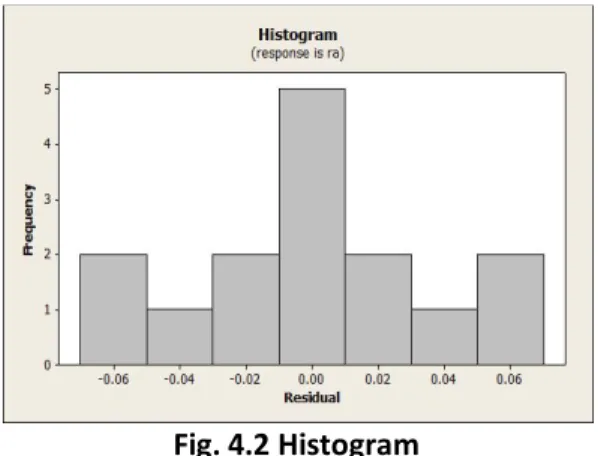
HISTOGRAM
A graph used to assess the shape and spread of continuous sample data. You might create a histogram prior to or in conjunction with an analysis to help confirm assumptions and guide further analysis
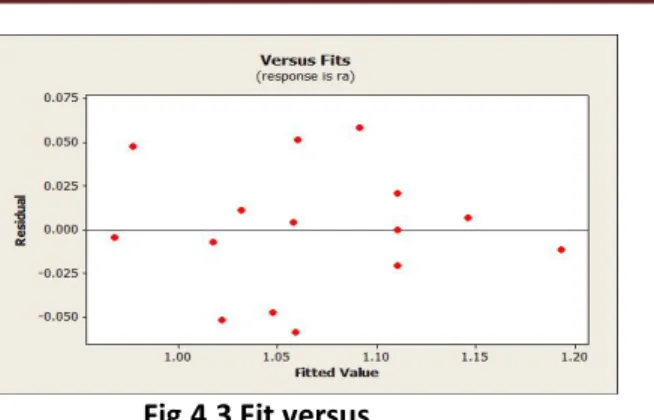
Fig. 4.2 Histogram Fit versus
This line is a graphical representation of the mathematical regression equation. It is plotted using the least squares method which minimizes the sum of the squared distances between the points and the fitted line.
International Journal of Research in Engineering & Applied Sciences
Email:- [email protected], http://www.euroasiapub.org
12
Fig.4.3 Fit versus Residual Line Plot
A visual inspection of the linear model on the left reveals that the data do not fit the line. The log transformed quadratic model on the right appears to provide a good fit to the Data.
Fig. 4.4 Residual Line Plot
CHAPTER 5
OPTIMIZATION USING GENETIC ALGORITHM
5.1 GENETIC ALGORITHM INTRODUCTION
Genetic algorithm imitates the principles of natural genetics and natural selection to constitute search and optimization procedures. Genetic algorithms are computerized search and optimization algorithms. It is based on ideas from Darwinian Evolution. It is used to solve a variety of problems that are not easy to solve using other techniques. Professor John Holland of university of Michigan, Ann Arbor envisaged the concept of these algorithms in the mid-sixties. It got popular in the late 1980’s
The genetic algorithm (GA) as a tool for process optimization is rapidly becoming an established approach. The GA combines the Darwinian principle of natural selection “survival of the fittest” strategy to eliminate unfit solutions and use random information exchange, with an exploitation of knowledge contained in old solutions, to result a search mechanism with surprising power and speed. GA using gene information and chromosome processing to optimize the given function, proved to be an efficient multi-objective optimization tool.
International Journal of Research in Engineering & Applied Sciences
Email:- [email protected], http://www.euroasiapub.org
13
A typical genetic algorithm consists of the following steps 1. Create the initial population.
2. Evaluate the fitness of each individual.
3. Select the best individuals and perform recombination. 4. Mutate the new generation.
5. If termination condition is not reached, go back to step2. 5.2GENETIC ALGORITHM – SOLVER
5.2.1 Population and generation
A population is an array of individuals. At each iteration, the genetic algorithm performs a series of computations on the current population to produce a new population. Each successive population is called a new generation.
5.2.2 Fitness
Fitness function is the objective function you want to minimize or maximized. This can specify the function as a function handle of the form @bowfin, where objfun.m is an M-file that returns a scalar. It is further required that the alternatives be coded in some specific finite length which consists symbols from some finite alphabet (0, 1). These strings are called chromosomes and the symbols that form the chromosomes are known as genes. Number of variables is the number of independent variables for the fitness function.
5.2.3 Constraints
The constraints are inputted in the form of linear inequalities and linear equalities. Bounds are lower and upper bounds on the variables.
5.2.4 Reproduction
Reproduction is the option to determine the genetic algorithm creates children at each new generation. It is applied on a population
5.2.5 Cross Over
Crossover fraction specifies the fraction of the next generation, other than elite individuals, that are produced by crossover. The remaining individuals, other than elite individuals, in the next generation are produced by mutation. Set Crossover fraction to be a fraction between 0 and 1,
5.2.6 Mutation
International Journal of Research in Engineering & Applied Sciences
Email:- [email protected], http://www.euroasiapub.org
14
5.3 Development of GA for surface roughness minimization
The developed second order regression based model for surface roughness was utilized to optimize the surface roughness. This consists of finding the combination of input variables; speed, feed, and depth of cut. The result in minimize the surface roughness. Hence, the multi objective welding optimization can be stated as follows.
Find optimal values of speed, feed, and depth of cut for minimize the surface roughness, Subject to constrains are 1000 rpm >speed >4000 rpm, 20mm/min >feed > 45mm/sec, and 0.5mm > depth of cut > 1mm
The inputted regression equation as the fitness function of the genetic algorithm tool in MAT Lab is
Fit = 0.821146+1.19E-05 X1 + 0.006796 X2 +0.475333 X3 – 6.7963E-09 X12 – 0.00031 X22 + 0.29267 X32 +1.8533E-06 X1 X2 – 9.5E-05 X1X3 +0.01 X2X3.
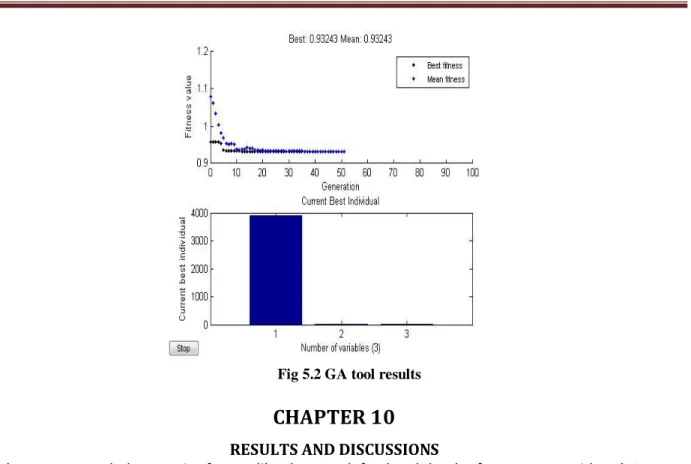
The genetic algorithm tool – user inter face result shown below
5.4 RESULTS OF GA TOOL
From the GA tool the optimized results are shown below.
Speed –3895.45 ≈ 4000 rpm Feed – 20 mm/min
Depth of cut - 1 mm
The best fitness value for the above factors = 0.932 µm
The best fitness value For a population is the smallest fitness value for any individual in the population.
International Journal of Research in Engineering & Applied Sciences
Email:- [email protected], http://www.euroasiapub.org
15
CHAPTER 10
RESULTS AND DISCUSSIONS
In the present work three major factors like the speed, feed and depth of cut were considered. Among the three factors depth of cut and feed are directly involving as a major factors, i.e. in interactions speed factor is the major factor. In linear terms the depth of cut factor playing a major role. The measured Ra values are tabled and error percentage was calculated.
The measured Ra values of each component are shown in the table and theoretical Ra values are also tabulated. The depth of cut, feed, and speed are directly involved in the surface roughness as respectively. When the depth of cut decreases the surface roughness is decreased and when the speed increases the surface roughness is decreases. From this the maximum speed and minimum depth of cut are better parameters for the selected material. The 3rd level of speed and the 1st level of feed and 3rd level of depth of cut are giving better results.
CHAPTER 11
CONCLUSION
In the CNC machining process the parameters are affecting the surface roughness of the
machined component were studied. An experiment was designed to obtain the surface roughness of the model. The optimum levels, which minimize the surface roughness, of factors influence the surface roughness were identified. The factors like speed, feed, and depth of cut has significant on the surface roughness.
The application of GA optimization for decrease the surface roughness in subtractive rapid prototyping of aluminum using regression models is presented in this project. Second order mathematical models for surface roughness based on regression equation were developed using experimental database as per full factorial design. Three process parameters such as speed, feed and depth of cut were considered for the model development. The minimization of surface roughness is carried out by GA using regression models.
International Journal of Research in Engineering & Applied Sciences
Email:- [email protected], http://www.euroasiapub.org
16
The optimization results also revealed that the requirement of depth of cut is low with the increase in speed and feed in order to minimize the surface roughness.
CHAPTER 12
REFERENCES
1. Babur Ozcelik., Mahmut Bayramoglu., 2006, The statistical modeling of surface roughness in high-speed flat end milling, International Journal of Machine Tools & Manufacture, Vol. 46, pp.1395– 1402.
2. Baskar, N., Asokan, P., Saravanan, R., Prabhaharan, G., 2005, Optimization Of Machining Parameters
For Milling Operations Using Non-Conventional Methods, international journal of advanced manufacturing technology, Vol. 25, pp.1078 – 1088
3. Hayajneh, M-T., Tahat, M-S., Bluhm , J., 2007, A Study of the Effects of Machining Parameters on the Surface Roughness in the End-Milling Process, Jordan Journal of Mechanical and Industrial Engineering, Vol. 1, No. 1, pp.1-5.
4. Jalili Saffar.R, Razfar.M.R, Salimi.A.H and Khani.M.M, 2009, Optimization of Machining Parameters to Minimize Tool Deflectionin the End Milling Operation Using Genetic Algorithm, World Applied Sciences Journal, Vol. 6 No:1, pp. 64-69.
5. Julie Z. Zhang., Joseph C. Chen., Daniel Kirby, sE., 2007, Surface roughness optimization in an end-milling operation using the Taguchi design method, Journal of Materials Processing Technology, Vol. 184, pp. 233–239.
6. Kadirgama, K., Noor, M.M., Rahman, M.M., Rejab, M.R.M., Haron, C.H.C., Abou-El-Hossein, K.A., 2009, Surface Roughness Prediction Model of 6061-T6 Aluminium Alloy Machining Using Statistical Method, European Journal of Scientific Research, Vol. 25, No. 2, pp. 250-256.
7. Palanisamy, P., Rajendran, I., Shanmugasundaram, S., 2007, Optimization Of Machining Parameters Using Genetic Algorithm And Experimental Validation For End-Milling Operations, International
Journal of Advanced Manufacturing Technology, Vol. 32, pp. 644–655.
8. Routara.B.C, Bandyopadhyay.A, Sahoo.P, 2009, Roughness modeling and optimization in CNC end
milling using response surface method: effect of workpiece material variation, International Journal of Advanced Manufacturing Technologies Vol. 40, pp. 1166–1180.
9. Shunmugam, M.S., Bhaskara Reddy, S.V., Narendran, T.T., 2000, Selection of optimal conditions in multi-pass face-milling using a genetic algorithm, International Journal of Machine Tools & Manufacture, Vol. 40, pp. 401–414.