A WEBQUEST IN TEACHING CIRCULATORY SYSTEM USING
GOOGLE SITE FOR GRADE VI PUPILS
Monera A. Salic-Hairulla*, Lea May L. Agad, Daryl Jean A. Pitonang, and Tyra Faye B. Terrado
College of Education, Mindanao State University -Iligan Institute of Technology, Iligan City, Philippines
*Email: [email protected]
(Received 23 September 2018; accepted 19 October 2019; published online 1 January 2020)
To cite this article: Salic-Hairulla, M. A., Agad, L., M., L., Pitonang, D., J., A., & Terrado, T., F., B. (2020). A WebQuest in teaching circulatory system using google site for grade VI pupils.
Malaysian Journal of Movement, Health & Exercise, 9(1), 31-44.
https://doi.org/10.15282/mohe.v9i1.313
Link to this article: https://doi.org/10.15282/mohe.v9i1.313
Abstract
This study aims to determine the performance of the respondents in using the developed WebQuest in Google Site. This study used the quasi-experimental design method making use of pretest-posttest design. The developed teaching instruction was implemented among 30 Grade 6 Elementary pupils, while 30 pupils experienced the traditional lecture method. The pupils were selected among public schools enrolled during SY 2016 - 2017. Furthermore, the result of the study showed that there was a significant improvement in the respondents’ conceptual understanding in the concept of the circulatory system. Moreover, the results also showed that there were differences between the post test scores of control group and experimental group. This strongly concludes that the WebQuest is really an effective tool in teaching the circulatory system. Respondents also revealed that the Google Site was enjoyable, entertaining, interactive and easy to learn.
Introduction
Social change has a strong impact on education. Society is changing and advancing. Education is also evolving. As teachers are the builders of the future, they must be competent and advanced in all aspects, and especially to the subject matter that they are handling, as they impart knowledge to their learners. Teachers must be equipped with skills and knowledge based on new concepts corresponding to the characteristic development of learners in the 21st century, enabling learners to have creativity and the ability to generate innovation.
With the rapid development of technology, the passion of the internet is boosting among learners. The World-Wide Web (WWW) is becoming the most important media for collecting, sharing and distributing information. Similarly, in the case of education, websites can be a mean of collecting relevant information about a subject. This important media can serve both teachers and learners in their teaching and learning activities.
The number of internet users in the Philippines increased by 13 million or 27 percent from January 2016 to January 2017, according to a report by social media agency We Are Social and social media management platform Hootsuite. That is four times the seven percent growth rate in the previous 12-month period. This implies that Philippine internet users have reached about 60 million as of January 2017, or about 60 percent of the population, based on Entrepreneur Philippines' calculations. In the report, Digital in 2017, We Are Social and Hootsuite also said that social media users in the Philippines grew by 12 million or 25 percent while the number of mobile social users increased by 13 million or 32 percent. These figures are still higher than the previous year (Subido, 2017).
Research findings support on bridging the gap between technology and education. Websites are a great tool to bring two sides together. They can be a mean of distributing information from teacher to student and from student to teacher. The lessons they learn will carry over into their other writing and thinking activities, which seems to explore concepts of critical thinking such as science lessons. Technology, when implemented well, has a positive impact on learning as well as students' overall engagement and enthusiasm. One of many ways is blending website to project-based learning. Children love projects, which bring learning to life in a way that traditional approaches can't. With this type of active and engaged learning, learners are inspired to obtain a deeper knowledge of the subjects they are studying.
Methodology
Target group
Methods of inquiry
This study used mixed quantitative and qualitative methods, making use of a pretest-posttest design. The descriptive methodology of research was utilized in which the researchers evaluated the pre-test and post-test scores of the experimental group where the respondents were exposed to the implementation of WebQuest as an instruction in teaching circulatory system, while in the control group the respondents were taught using traditional lecture method with the same subject matter.
Research Findings
The researcher’s developed a WebQuest as an instructional tool for teaching the circulatory system. The researchers used the following steps in developing WebQuest; a.) Selection of the topic (Circulatory System); b.) The formulated objective of WebQuest based on the K to 12 Science Learning Competencies 2016 for teaching circulatory system; and c.) Making the storyboard. The WebQuest was rated by the ICT Experts, In-Service teachers, and Pre-Service Teachers.
Demographic Profile of Respondents in Experimental Group
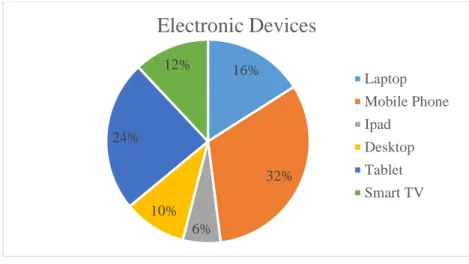
Figure 1: Profile of respondents in terms of electronic devices
Figure 1 shows the profile of the respondents who used electronic devices. 32% of the respondents use mobile phones, followed by tablets at 24%. On the other hand, only 6% use an iPad. This means that the biggest slice of the pie includes mobile phone as the means to connect on the internet. 10 out of 30 respondents in Sgt. Miguel Canoy Memorial Central School used mobile phones, while 2 respondents used iPads. Watson (2010) states that mobile phones are a popular form of communication in today's society, and respondents of all ages own cell phones. Thus, mobile phones or any electronic devices are useful for learners.
16%
32%
6% 10% 24%
12%
Electronic Devices
Laptop
Mobile Phone
Ipad
Desktop
Tablet
Figure 2: Profile of respondents in terms of usage of gadgets
Figure 2 shows how often the respondents use their gadgets. 45% of the respondents prefer to use their gadgets sometimes, while 21% prefer to use them always. This means that 14 of the respondents sometimes used their gadgets and 10 of them used them very often. However, 6 of the respondents used gadgets always. Jagadesh (2017) states that every gadget has its own positive as well as negative effects depending on one’s exposure to these devices and gadgets. Thus, there has to be positive or negative effects of electronic gadgets among respondents depending on usage.
Figure 3: Profile of respondents in terms of source of internet connection
Figure 3 shows the source of internet connection of the respondents. 50% of the pie belongs to DSL, followed by 31% with pocket Wi-Fi and 19% with mobile data. 15 out of 30 respondents used DSL to connect to the internet and 9 respondents used pocket Wi-Fi___33.
21%
34% 45%
Usage of gadgets
Always Very Often Sometimes
50%
31% 19%
Source of Internet Connection
6 used mobile data as a source of internet connection. Wright (2017) states that widespread use of the Internet has opened up a substantial amount of knowledge to a much broader range of people than ever before. Teachers can make use of the Internet by giving respondents extra resources and material from the Internet, such as interactive lessons and educational games.
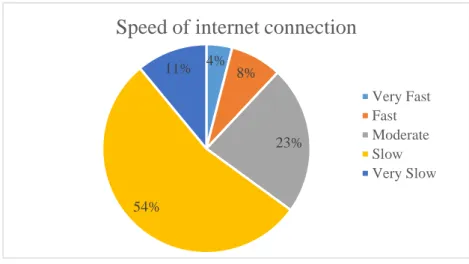
Figure 4: Profile of respondents in terms of speed of internet connection
Figure 4 shows the speed of internet connections of the respondents. 54% of the respondents find their internet connection to be moderate in speed while 4% said that their internet connection is very slow. Only 8% of the respondents find their internet to be very fast. This means that 16 out of 30 respondents have a moderate internet connection. This could be due to the location, which is Buru-un, Iligan City. Internet speed heavily depends on network equipment, such as the router or cable. According to Barreiro Jr. (2017), Philippines has the slowest average internet speed in Asia Pacific. Belo (2012) on the other hand, found suggestive evidence that the way schools allow respondents to use the Internet affects respondent performance.
4% 8%
23%
54% 11%
Speed of internet connection
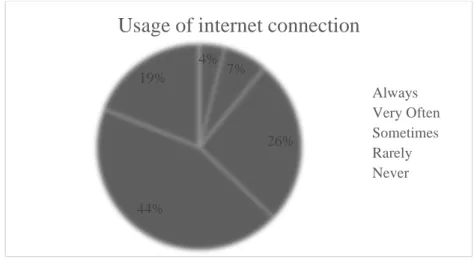
Figure 5: Profile of respondents in terms of usage of internet connection
Figure 5 shows how often respondents use their internet connections. 44% of the respondents use internet sometimes, followed by very often at 26%. The smallest part of the pie or 4% belongs to those respondents who claim that they never use the internet. This means that 13 out of 30 respondents use their internet connection sometimes and 8 of them use it very often. However, 1 respondent claimed that he/she never uses an internet connection. Sharma (2016) states that Internet applications respond to respondents and other people questions in real time. Respondents are seeing Google as a new Teacher and the Internet as a school.
Figure 6: Readability of WebQuest in the Google Site
Figure 6 shows that the WebQuest has a low percentage of passive sentences. The total number of words is 673. The total number of unique words is 307, or 46% of the total text. Total number of repeat words is 366 which is 54% of the total text. Average number of words per sentence is 10. The total number of characters is 3,136 and average number of characters per words is 4.7. The average number of syllables per word is 1 and total number of syllables is 984. Readability formulas are used widely in education and has demonstrated moderate to strong predictive correlations with reading comprehension (Humphreys& Humphreys, 2013). This means that the WebQuest is easy to read and understand. Figure 6 has a result of 72.6 of Flesch Reading Ease which means that the developed WebQuest uses shorter sentences and is easy to understand. Figure 6 further showed that the WebQuest has a Grade Level of 5.7 which indicates that it is expected to be understood by an average student in the 6th grade.
4% 7%
26%
44% 19%
Usage of internet connection
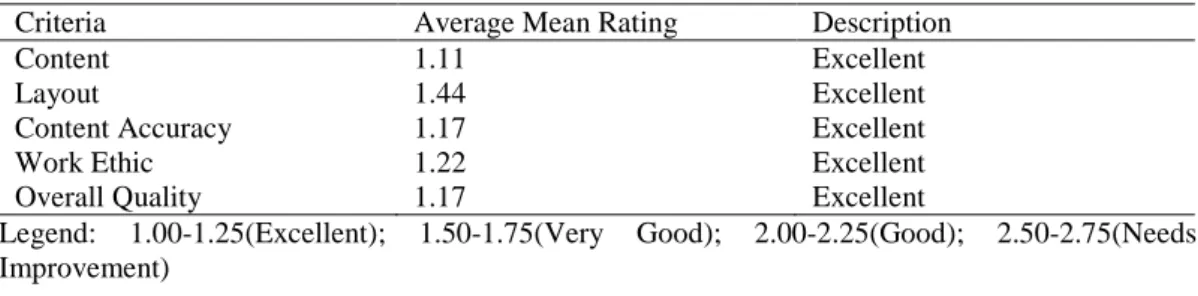
Table 1: Summary of Ratings of the ICT experts, in-service teachers, and preservice teachers on the WebQuest through Google Forms
Criteria Average Mean Rating Description
Content 1.11 Excellent
Layout 1.44 Excellent
Content Accuracy 1.17 Excellent Work Ethic 1.22 Excellent Overall Quality 1.17 Excellent
Legend: 1.00-1.25(Excellent); 1.50-1.75(Very Good); 2.00-2.25(Good); 2.50-2.75(Needs Improvement)
Table 1 shows that the ICT Experts, In-service Teachers and Pre-service Teachers got an excellent rating in the developed WebQuest. In content, 88.9% rated the site as having a well-stated clear purpose and theme that is carried out throughout the site. This indicates that 16 out of 18 evaluators rated the site excellent. In terms of layout, 55.6% rated the site as having an attractive and usable layout. It indicates that 10 out of 18 evaluators rated excellent. It is easy to locate all important elements. In content accuracy 15 out of 18, 83.3% rated all information provided by the researchers on the site are accurate and all of the requirements of the assignment have been met. In work ethic 14 out of 18, 77.8% stated that researchers always use classroom project time well. For overall quality 15 out of 18, 83.3% rated that the site as high quality. Natividad (2016) states that teachers have access to more sophisticated tools that can break the monotony of everyday lectures and facilitate the learning experience in different ways. In the modern age, teaching is no longer limited to the physical classroom. Any experienced teacher can tell you that no two people learn the same way. There are visual learners, auditory learners, read-write learners, and kinesthetic learners. Because all these types of learners are mixed in one classroom, teachers need to be able to find ways to accommodate these disparities. Thus, WebQuest can be a tool in helping learners.
To further evaluate the developed WebQuest, the researchers asked for comments and suggestions from the ICT Experts, In-service Teachers and Pre-service Teachers. The following are the comments and suggestions.
Table 2: Comments and suggestions of the ICT experts, in-service teachers, and pre-service teachers
Evaluator Comments/Suggestions ICT1 Well done!
ICT2 comment lng naq naa xa typo error ako nakita.. under sa WebQuest na tab den sa Process dayon..
Two (3) Engineer den ang three (2) constructors pod..ecorrect lng ang number..nice kau ang site..
IT1 LAYOUT: I think it is more appropriate if the layout of the entire site and WebQuest is parallel to the topic presented. TIME ELEMENT: Kindly check the feasibility of the timeframe of your activity.
ICT3 The site is easy to understand and explain well about the circulatory system IT2 Nice!
PT1 Keep it up! The site is very good.
IT2
It's a very good tool for respondents and educators. I will surely visit this website and use this as reference in the future. Kudos to the people behind this. Amazing!
PT3
The website was done perfectly. Every layout and design is eye-catching. Moreover, respondents will be able to manipulate every information since all pages are working.
PT4 The site is of high quality, well designed and user friendly. Excellent! PT5 I really like your webquest. It will surely help in my future career. <3
IT5
Maybe add some pictures to support the instructions and ideas although the site is very well made.
PT7
Very good! The learners can easily understand the information stated plus the layout is so attractive and pleasing to the eyes. :)
PT8 Exemplary
PT9 Some instructions given are difficult to understand by the respondents. PT 10 Well done.
Table 2 shows the comments and suggestions of the ICT Experts, In-service teachers and Pre-service teachers. The researchers used the comments and suggestions of the ICT Experts, In-service teachers and pre-service teachers to improve and revise the presentations, layout, graphics and organization of themes, pages of the WebQuest so that it will be an effective instructional tool in teaching circulatory system. Manik, Qasim, and Shareef (2014) found that lecturers’ awareness of 21st century skills, especially the knowledge and skills in the integration of ICT, is a constraint in the training process and therefore, requires special attention especially among per-service teachers. WebQuest is a good tool for this.
Validation of the WebQuest by the ICT Experts, In-service teachers, and Pre-Service teachers
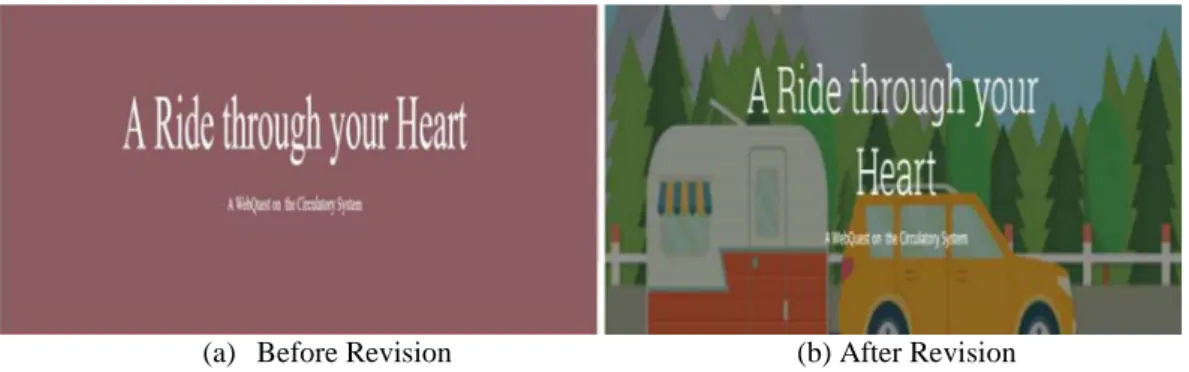
(a) Before Revision (b) After Revision
Figure 7: Photograph of Sample Page from the WebQuest before and After Revision
Figure 7 shows the sample of page before and after revision of the developed WebQuest. The researchers asked the ICT Experts, In-service teachers and Pre-service teachers to evaluate and validate the WebQuest. Upon the evaluation and validation of the developed WebQuest by the experts, there are some comments, suggestions and recommendations have been made. The researchers revised the developed WebQuest based on the comments, suggestions and recommendations of the experts. According to Factoran (2009), two of the purposes of in-service teachers are to keep the professional abreast of new knowledge and to release creative activities.
Table 3: Performance of the respondents in pretest and posttest
Performance Level Advance
(28 and above)
Proficient (26-27)
Approaching Proficiency
(24-25)
Developing (23)
Beginning (22 and below)
Mean Standard Deviation
Control Pretest F 0 0 0 0 30 6.53 2.08
% 0 0 0 0 100
Posttest F 0 0 1 0 29 11.07 5.45
% 0 0 3 0 97
Experimental Pretest F 0 1 0 0 29 14.43 3.91
% 0 3 0 0 97
Posttest F 0 3 6 2 19 21.13 3.58
% 0 10 20 7 63
Table 3 shows the performance and frequency distribution of the 60 respondents in the pretest and posttest (Appendix N). The table shows that in the pretest, all respondents got a failing score in the control group. This low performance level attained by the respondents indicates that they had little knowledge about the topic. However, in the experimental group, 20% showed approaching proficiency and 10% of respondents got proficient. This result implies that the respondents learned better through the use of the WebQuest in teaching the circulatory system.
Table 4: Descriptive statistics of test scores for control and experimental group
Group Variable Mean Standard Deviation Minimum Maximum Sum Control Pretest 6.53 2.08 3 11 196
Table 4 shows the descriptive statistics of test scores for the control and experimental group. The pre-test scores of Cabaro Elementary School averaged 6.53. The total score was 196 with 3 as the lowest and 11 as the highest. The standard deviation of 2.08 suggests that the scores of 30 respondents were close to the average score. This means that the aforementioned values got a lot better in the post-test results of the said school. The average score of the 30 respondents was 11.07 with a sum of 332. The lowest score is still 3 but the highest score is 25. However, the standard deviation of 5.45 indicates that the test scores were spread from the mean. For Sgt. Miguel Canoy Memorial Central School, their pre-test scores had an average of 14.43 with minimum score of 7 and maximum of 26. The total score of 30 respondents was 433. The standard deviation is 3.91 which means that the scores are dispersed from the mean. For the post test, scores are way better than the pre-test scores. The average score is 21.13 and the total score is 634. The minimum score is 13 while the maximum is 27. The standard deviation of 3.58 is also good because it indicates that scores are closer to the mean. This shows that the experimental group performed well during the discussion in association with the implementation of WebQuest.
One possible reason for the results may lie in the topic itself. The study of circulatory systems includes pictures to vividly depict the system, the organs and the body. The WebQuest is composed of interesting photographs, creating more understanding among the respondents. Modeling is most effective in preparing teachers to integrate technology into their classroom especially in 21st century.
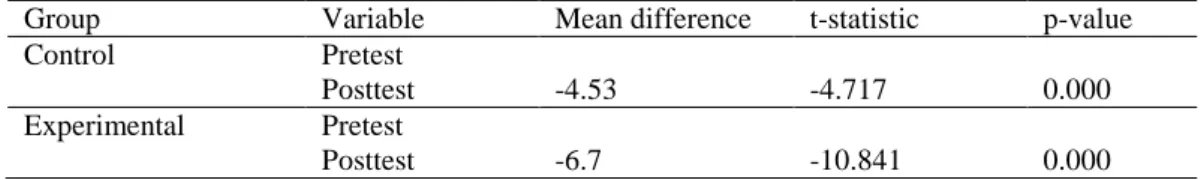
Table 5: Paired t-test results of the control and experimental group
Group Variable Mean difference t-statistic p-value Control Pretest
Posttest -4.53 -4.717 0.000 Experimental Pretest
Posttest -6.7 -10.841 0.000
Table 5 shows the paired t-test results for control and experimental group. There is a difference between the pre-test and post test scores of the control group, Cabaro Elementary School. This is contrary to the null hypothesis that there would be no significant difference between the two test scores. Likewise, it is congruent to the alternative hypothesis that there would be a significant difference between the two test scores. The researcher set the level of significance to be 0.05. The statistical test used is paired t-test since the data are results of before-and-after situation. Based on the results above, the difference between the means of the test scores is -4.53 and the p-value is 0.000. This leads to the rejection of the null hypothesis and the conclusion that there is a significant difference between the test scores.
the test scores is -6.7 and the p-value is 0.000. Hence, the null hypothesis is rejected and the researchers conclude that there is a significant difference between the test scores.
Another possible reason for the results of this study may be related to student motivation to learn. Teachers should allow students to work autonomously, enjoy learning relationships with peers, and let them feel that they are competent to reach their goals which is applicable to WebQuest as an instruction. Allowing students to work autonomously and with others, developing their sense of competence, results in increased student motivation.
Table 6: Two-sample t-test for the post tests of the control and experimental group
Variable Mean t-statistic p-value Posttest Control 11.07 -8.462 0.000 Posttest Experimental 21.13
Table 6 shows the two sample t-test for the post-test of the control and experimental group. The researcher would like to know if there is a difference between the post test scores of Cabaro Elementary School and Sgt. Miguel Canoy Memorial Central School. The researcher set the level of significance to be 0.05. The statistical test used is independent sample t-test, since the data came from two independent samples.
Based on the results above, the test statistic is -8.462 and the p-value is 0.000. Hence, the null hypothesis that there is no significant difference between the post test scores of the two schools is rejected and conclude that there is a significant difference between the post test scores of the two schools.
Learners’ perception
The researcher asked the respondents to complete the questionnaire to know their perception on the introduced WebQuest. The findings are given below. Coping with questioning the strong and weak points of using the WebQuest in teaching resulting from the answers given by the respondents. This study has several possible implications and suggestions. The present findings of the study revealed major challenges as feeling of disheartening among the respondents regarding different statements of the WebQuest.
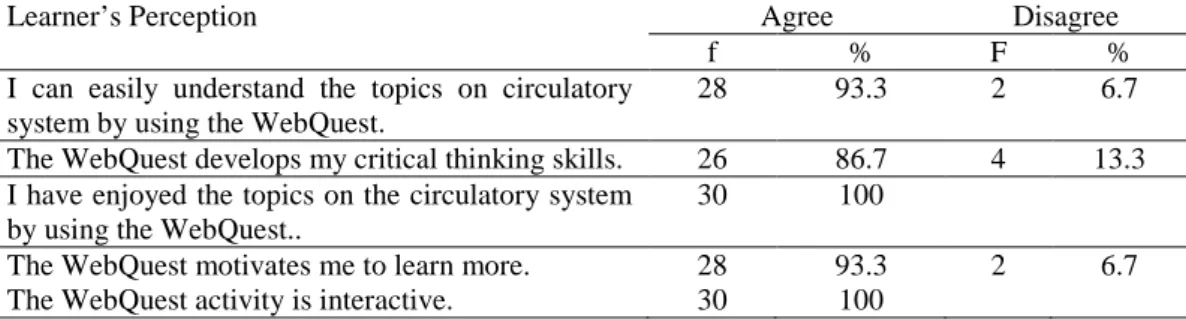
Table 7: Percentile distributions of learners’ perception on the WebQuest
Learner’s Perception Agree Disagree
f % F %
I can easily understand the topics on circulatory system by using the WebQuest.
28 93.3 2 6.7
The WebQuest develops my critical thinking skills. 26 86.7 4 13.3 I have enjoyed the topics on the circulatory system
by using the WebQuest..
30 100
Table 7 shows the distributions and percentage of learners’ perception on the developed WebQuest as an instructional material for teaching the circulatory system.
All of the respondents agreed that they enjoyed the topics of the circulatory system by using the WebQuest and the WebQuest activity is interactive. This means that the WebQuest introduced can be enjoyed in an interactive way.
93.30% of the respondents agreed that they could easily understand the topic of the circulatory system by using the WebQuest and it motivates them to learn more, and 6.70% of them disagreed to the statements. This means that the introduced WebQuest is simple and instructional.
86.7% of the respondents agreed that the WebQuest develops their critical thinking skills and 13.3% of them disagreed. This means that the WebQuest aims to develop the Higher Order Thinking Skills (HOTS) of the learners.
80% of the respondents agreed that the WebQuest can be easily manipulated without the supervision of the teacher and 20% of them disagreed. This means that without the aid of the teacher the learners can learn through their own.
Overall, the table indicates that the learners have learned from and enjoyed using WebQuest. From the student’s perception questionnaire, the respondents found that the WebQuest was enjoyable, motivational, entertaining, interactive, easy to learn, and helped them develop their critical thinking skills.
Conclusions
References
Bagherzadeh, Z., Hamidi, F., Salimi, L., & Shahmir, S. (2010). Role of ICT in the curriculum educational system. ScienceDirect. Retrieved December 21, 2017, from https://www.sciencedirect.com/science/article/pii/S1877050910004795
Barreiro, V. (2017, June 1). PH has slowest average internet speed in Asia pacific – Rappler. Retrieved December 21, 2017, report. https://www.rappler.com/business/188588-dict-bcda-facebook-high-speed-broadband-luzon-bypass-infrastructure
Belo, R. (2012, August). Broadband in schools: effects on student performance and spillovers for household internet adoption (Doctoral dissertation). Retrieved December 21, 2017, from
http://repository.cmu.edu/cgi/viewcontent.cgi?article=1112&context=dissertations
Gomez, R. G. (2013). A Project-Based Approach to Enhance Skills in Science Investigatory Projects among Secondary School Students in Northern Mindanao. The Mindanao Forum, 26 (1). Retrieved July 19, 2017, from http://ejournals.ph/form/cite.php?id=7123
Hare, W. (2001). Open-minded inquiry. Retrieved December 21, 2017, from https://www.criticalthinking.org/resources/articles/Open-minded-inquiry.shtml
Humphreys, A. H., & Humphreys, J. T. (2013). Reading difficulty levels of selected articles in the journal of research in music education and journal of historical research in music education. Music Education Research International, Volume 6. Retrieved August 14, 2017 from http://www.arts.usf.edu/content/articlefiles/3985-MERI06pp15-25HumphreysHumphreys.pdf
Manik, M. M., Qasim M., & Shareef, A. F. (2014). Embedding 21st century skills in pre- service teacher training: a case study from the Maldives. Teaching and learning in the 21st Century: Challenges for Lecturers and Teachers. Retrieved December 21, 2017, from http://repository.ut.ac.id/5104/1/Embedding%2021st%20Century%20Skills%20in %20Pre-service%20Teacher%20Training.pdf
Nations, D. (2016, November 25). What is Google Sites and why use it?. Lifewire. Retrieved December 21, 2017, from https://www.lifewire.com/what-is-google-sites-and-why-use-it-3486337
Natividad, N. (2016, September 9). Technology and teaching: how the internet opened opportunities for education. Rappler. Retrieved December 21, 2017, from https://www.rappler.com/brandrap/tech-and-innovation/145677-technology-teaching-virtual-classroom
Sharma, V. (2016, February 16). Importance of Internet in education at schools. Klient Solutech Pvt. Ltd. Retrieved December 21, 2017, from h ttp://www.klientsolutech.com/importance-of-internet-in-education-at-schools/
Timothy, A. (2015, October 11). 8 reasons why storyboarding is important before jumping off to development. Elearning Industry in French. Retrieved December 21, 2017, from https://elearningindustry.com/in-house-learning-management-system-building-pros-cons