A Neural Network Classifier Model for Forecasting Safety Behavior at
Workplaces
Fakhradin Ghasemi
1, Omid Kalatpour
1, Abbas Moghimbeigi
2, Iraj Mohammadfam*
11) Center of Excellence for Occupational Health, Research Center for Health science, School of Public Health, Hamadan University of Medical Sciences, Hamadan, Iran.
2)Department of Biostatistics and Epidemiology, School of Public Health and Modeling of Non communicable Diseases Research Center, Hamadan University of Medical Sciences, Hamadan, Iran.
* Author for Correspondence: [email protected]
Received: 04 Jan. 2017, Revised: 10 March. 2017, Accepted: 11 May 2017
ABSTRACT
The construction industry is notorious for having an unacceptable rate of fatal accidents. Unsafe behavior has been recognized as the main cause of most accidents occurring at workplaces, particularly construction sites. Having a predictive model of safety behavior can be helpful in preventing construction accidents. The aim of the present study was to build a predictive model of unsafe behavior using the Artificial Neural Network approach.
A brief literature review was conducted on factors affecting safe behavior at workplaces and nine factors were selected to be included in the study. Data were gathered using a validated questionnaire from several construction sites. Multilayer perceptron approach was utilized for constructing the desired neural network. Several models with various architectures were tested to find the best one. Sensitivity analysis was conducted to find the most influential factors.
The model with one hidden layer containing fourteen hidden neurons demonstrated the best performance (Sum of Squared Errors=6.73). The error rate of the model was approximately 21 percent. The results of sensitivity analysis showed that safety attitude, safety knowledge, supportive environment, and management commitment had the highest effects on safety behavior, while the effects from resource allocation and perceived work pressure were identified to be lower than those of others.
The complex nature of human behavior at workplaces and the presence of many influential factors make it difficult to achieve a model with perfect performance.
Key words:
Safety Behavior, Multilayer Perceptron, Artificial Neural Network, Predictive Model, Safety Attitude, Safety Knowledge.INTRODUCTION
The construction industry is notorious for having an unacceptable rate of fatal accidents [1]. Apparently, there are many organizational and site-level factors determining the level of safety at construction sites and ignoring each of them can lead to an accident [2]. Organization, equipment, materials, workers, and work teams all are the factors that can to some extent contribute to accidents occurring at construction sites [3]. However, nowadays, it is well accepted that unsafe behavior plays the most important role in most accidents occurred at workplaces, particularly in the construction industry. This fact has been stressed by almost all studies which have been conducted to address root causes of occupational accidents [3, 4]. However, it should be emphasized that we cannot put the blame only on employees for their unsafe behavior which has led to an accident. In fact, unsafe
behavior is the last chain connecting organizational deficiencies to an accident.
Therefore, if we wish to prevent accidents from occurring, there is an urgent need to improve safety behavior of employees, and if we wish to improve safety behavior, we should find, analyze, and modify factors making people willing to take an unsafe behavior. Identifying determinants of employees' safety behavior has been the subject of many studies so far. These studies have a range from qualitative surveys to quantitative researches in which various approaches have been utilized to model and analyze safety behavior. Some of these studies have tried to introduce new concepts, while some others have tried to build new models based on factors introduced by other studies.
psychological/personal factors. Organizational factors may have not a direct effect on safety behavior, but they directly affect psychological/ personal factors and these psychological factors directly determine the type of behavior engaged in by employees at workplaces. Management commitment, leadership style, safety management system and procedures, and incentive systems are examples of indirect organizational factors. Safety knowledge, personal attitude toward safety, motivation, and perceived work pressure also is some of the most important direct psychological factors shaping employees' behavior at workplaces [5-8].
In managing safety behavior of employees, having an explanatory/predictive model is of vital importance. Using such a model, we would be able to find out which factors have the highest effect on safety behavior and which factors are of a lower importance and how to manage the available resources. According to the aforementioned issues, having a model to predict safety behavior of employees is very helpful in managing safety issues and preventing occupational accidents.
Artificial Neural Network (ANN) has been recognized as a strong tool for developing predictive models, particularly for such a complex context as human behavior modeling and prediction, in which the interrelationships among variables are of high complexity and somewhat unknown. The approach has been shown to be strong, flexible, and easy to apply, and is better than conventional statistical methods in several ways. Contrary to conventional statistical methods, such as regression, ANN is adaptive, which means they can learn and adapt themselves with new data and become more intelligent in explaining and predicting the desired phenomenon [9]. Another important advantage of ANN over conventional statistical methods is that ANN do not need an underlying distribution to be specified, while most of statistical tests are performed on the basis of an underlying probability distribution (in most cases Gaussian distribution) [9]. The approach is able to model nonlinear relationships and its predictive performance is much better than that of conventional multiple regression approach [10, 11]. Given the capabilities of ANN, it has been extensively used in the field of occupational safety and health for predicting various outcomes, e. g. safety climate [12] and accident severity [13]. Accordingly, the aim of the present study is to develop an ANN model for forecasting safe behavior at workplaces and determine the most important factors affecting such a behavior.
MATERIALS AND METHODS
Participants and data acquisition
The present study was carried out in several power plant construction sites containing a total number of 1150 employees. All participants were men aged in a range from 18 to 50 years old.
A validated questionnaire containing 45 questions was used for measuring nine factors supposed to influence safety behavior of employees in a direct or indirect way. The factors were as follows; management commitment, supportive environment, safety management system and procedures, resource allocation, personal safety knowledge, personal safety attitude, participation, motivation, and perceived work pressure. It should be noted that these factors were selected based on the literature review that we made on previous studies and authors' experiences. In the following paragraph, we provided a brief description about these constructs.
respectively. Information about the validity and reliability of the questionnaire is presented in our previous study (please see Mohammadfam et al. [16]).
Using confirmatory factor analysis (CFA) of the construct validity and factor loading of each indicator on related construct were determined [17]. The weighted sum score was used to calculate the final score of each variable. For measuring safety behavior, we used a self-reported approach, in which a question about safety-related behaviors of employees during a working day with three possible answers (seldom, sometimes, often) was asked. The answer of this question demonstrated how often an individual considers safety issues in their daily behavior at his workplace. For more information about the data and the questionnaire used in the present study, please see Mohammadfam et al. [16].
Developing the ANN model
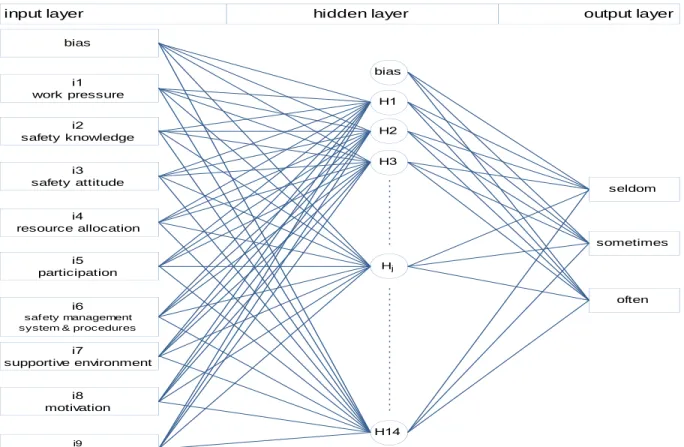
In the present study, a multilayer perceptron (MLP)-ANN approach was utilized to build a model for predicting the type of behavior engaged in by employees when they face situations with safety considerations. An MLP is defined as a feed forward model connecting input and output data through one or several hidden layers of neurons. Utilizing a "differentiable" nonlinear activation function, MLP is especially applicable to linearly non-separable data [18]. From the network point of view, an MLP is composed of several layers; an input, an output, and at least one hidden layer which performs a feature selection function. In this model, the network is trained using a back propagation approach, as a supervised learning method (18). MLP can be used for accomplishing various purposes; pattern classification, function estimation, and prediction has been introduced as the main objectives which can be achieved using a MLP model [19]. It should be noted that we used the SPSS software package (version 20) developed by IBM Cooperation to build our model. Using SPSS to develop a MLP-ANN model, there are three training methods to choose from; batch, online, and mini-batch training. In the present study, the online training method was used because the number of input variables was relatively high and, moreover, safety behavior, determinants are normally correlated to each other (20). Furthermore, it has been recommended to utilize on-line training approach for solving complex pattern-classification problems [18, 20].
As there is no well-accepted rule to find the best network [21], we tried various models with various architectures and activation function for both the hidden layer and output layer to find the best one. Networks with one and two hidden layers were checked, but networks with more than two hidden
layers were not investigated, because it has been explained by several studies that the use of more than two hidden layers in an ANN will not improve the model performance [21]. The next important issue to be taken into account in developing an ANN is the number of neurons in each hidden layer. It should be noted that a too high number of hidden neurons may cause the network to become over-fitted and plunge generalization ability of the model, in contrast, a too low number of hidden neurons would also diminish the ability of the model to learn from data [21]. There have been recommended several general rules that limit the number of hidden neurons needed to be tried to find the best network architecture. In the present study, we used the rule recommended by Lippmann [22], according to which, if we have n number of input variables, the number of neurons in the hidden layer of an ANN should be lower than 2n+1.
Moreover, there are several indices using which the performance of an ANN can be evaluated, including the mean absolute deviation (MAD), the sum of squared error (SSE), the mean squared error (MSE), the root mean squared error (RMSE), and the mean absolute percentage error (MAPE) are some of these indices using which we can evaluate the performance of the model [21]. In this study, we utilized SSE as the main error function to evaluate various models and select the best among them. This index is easy to calculate, easy to understand, and easy to interpret.
Evaluating the performance of the model
In the present study, the hold-out approach was applied to evaluate the performance and generalization ability of the model. According to the approach, sixty additional completed questionnaires which were not used for training or testing the model, were utilized for evaluating the performance of the model.
Sensitivity analysis
Sensitivity analysis demonstrates how a change in the value of a predictor can influence the output variable. In the other worlds, how much sensitive the target variable is to the changes of input variables. Therefore, at the end of the study, sensitivity analysis was applied to rank factors by their magnitude of influence on safety behavior.
RESULTS
Information about reliability of the questionnaire is summarized in Table 1, demonstrating an acceptable level of reliability.
Table 1: reliability of the questionnaire based on Cronbach’s alpha coefficient
Factor Cronbach’s alpha
Management commitment 0.831
Motivation 0.8
Supportive environment 0.751
Safety management system and
procedures 0.719
Participation 0.611
Resource allocation 0.65 Personal safety attitude 0.768
Safety knowledge 0.875
Perceived work pressure 0.756
Various MLP models with different architectures were constructed to find the best one. Fifty percent of dataset was assigned for testing each model. The best model was the one with the lowest value of SSE. It should be mentioned that we tried all possible combinations of activation functions for hidden and output layers, but the best outcomes were observed for models that had the hyperbolic tangent function in their both hidden and output layers.
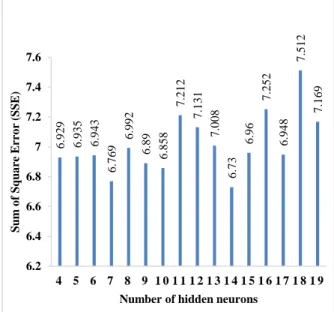
Moreover, networks with two hidden layers did not have a better performance than those with one hidden layer, so we do not bring them here. Fig. 1 represents the performance of models with one hidden layer containing different numbers of hidden neurons in terms of MSE index. According to this figure, the network with 14 hidden neurons had the best
performance, so we selected this model for further investigations. The schematic view of the model configuration is shown in Fig. 2.
Fig. 1: the MSE of various models based on their hidden neurons
Synaptic weights between input variables and hidden layers are presented in Table 2, and synaptic weights between hidden neurons and output variables are also presented in Table 3. The output of the model for each case can be obtained by using these synaptic weights and the hyperbolic tangent function.
Table 2: Synaptic weights between inputs and hidden neurons
6
.9
2
9
6
.9
3
5
6
.9
4
3
6
.7
6
9
6
.9
9
2
6
.8
9
6
.8
5
8
7
.2
1
2
7
.1
3
1
7
.0
0
8
6
.7
3
6
.9
6
7
.2
5
2
6
.9
4
8
7
.5
1
2
7
.1
6
9
6.2 6.4 6.6 6.8 7 7.2 7.4 7.6
4 5 6 7 8 9 1 0 1 1 1 2 1 3 1 4 1 5 1 6 1 7 1 8 1 9
S
u
m
o
f
S
q
u
a
re
E
rr
o
r
(S
S
E
)
Number of hidden neurons
Inputs H(1) H(2) H(3) H(4) H(5) H(6) H(7) H(8) H(9) H(10) H(11) H(12) H(13) H(14)
(Bias) -0.105 -0.028 -0.259 0.389 -0.191 0.135 -0.159 0.155 -0.342 -0.227 0.16 -0.67 -0.484 -0.126
i1 -0.138 -0.384 -0.291 0.098 -0.465 0.081 0.181 0.334 -0.074 -0.127 0.054 -0.188 0.408 -0.219
i2 -0.318 -0.299 0.147 -0.11 -0.492 0.176 0.113 -0.28 0.405 -0.254 -0.25 -0.382 -0.298 -0.357
i3 0.167 0.251 0.164 -0.167 0.049 -0.08 0.57 -0.644 0.467 0.011 -0.247 -0.26 0.276 -0.243
i4 -0.255 0.422 -0.012 -0.386 0.122 0.108 0.447 0.327 0.02 -0.049 0.363 0.355 0.294 0.027
i5 -0.319 0.273 -0.158 0.327 -0.404 0.017 0.35 -0.374 -0.263 -0.278 -0.121 -0.047 0.44 0.26
i6 0.127 -0.32 -0.252 -0.131 -0.452 0.325 -0.386 -0.099 0.083 -0.035 0.054 0.33 0.202 0.412
i7 0.264 -0.302 0.374 0.454 -0.319 -0.312 0.131 0.315 -0.199 -0.093 0.008 -0.231 0.254 0.305
i8 -0.495 0.374 0.126 -0.199 0.154 0.305 -0.071 -0.158 0.557 0.091 0.311 0.224 -0.42 0.187
i9 -0.53 0.397 -0.419 -0.068 -0.234 -0.089 -0.176 -0.136 -0.428 0.266 -0.486 -0.187 -0.31 0.182
Fig. 2: Shematic of the ANN with 14 hidden neurons
Table 3: Synaptic weights between hidden neurons and output variables
Hidden neurons seldom sometimes often
bias 0.541 0.39 0.179
H(1) -0.132 -0.059 0.321
H(2) 0.182 -0.211 0.346
H(3) -0.285 0.163 -0.249
H(4) 0.289 -0.011 0.103
H(5) 0.108 0.076 0.102
H(6) 0.092 0.333 0.164
H(7) -0.382 0.18 0.041
H(8) 0.665 -0.24 0.162
H(9) -0.345 -0.196 0.491
H(10) -0.268 0.442 0.082
H(11) 0.245 -0.21 -0.232
H(12) -0.434 0.156 -0.204
H(13) -0.319 0.168 0.204
H(14) -0.096 -0.044 0.121
For evaluating the generalization ability of the model, we tested the model on 60 separate cases which were
not used during the model training step. This approach has been known as the hold-out method for validating predictive models. The results of this test are presented in Table 4 in the form of a confusion matrix. As evident in this table, the present model had a high ability in predicting cases with an output of "seldom", the performance of the model in terms of predicting cases with an output of "often" was also acceptable. However, the model was not satisfactory when applied for cases with an output of "sometimes". Moreover, the total error rate of the model is 21.7 percent. Considering the complex and unpredictable nature of human behavior, this level of error can be acceptable. In fact, previous studies intending to construct a predictive model of safety behavior have obtained a comparable level of accuracy [7, 23].
Table 4: Confusion matrix of the model based on the holdout data
Actual output
Predicted outcome
Error rate (%) Total error rate seldom sometimes often
seldom 32 0 2 5.8
21.67
sometimes 5 5 2 58.3
often 2 2 10 28.6
The receiving operating characteristics (ROC) curve is a powerful tool using which the performance of a model can be investigated in a more detailed manner.
The curve relates the sensitivity (the ability of a model to predict positive cases correctly) to the one minus specificity (the ability of a model to predict
i work pressure
i
safety knowledge
i safety attitude
i
resource allocation
i participation
i
saf ety management system & procedures
i
supportive environment
i motivation
bias
i
management commitment
H
H bias
H
Hj H
seldom
often sometimes
negative cases correctly) of a model, and is applicable to any classifier system intending to classify a binary variable [24, 25]. It is worth mentioning that the target variable in the present study, safe behavior, was not binary but rather it had three states. The output variable was automatically transformed by SPSS in three separate binary variables to become applicable in an ANN. As a result, we had three output variables and, therefore, three ROC curves.
The ROC curves of the present model are presented in Fig. 3. Three curves are presented in this figure, each of them illustrates the ability of the model in predicting one of the output variables. One of the most important features of such a tool to be taken into account is the area under the curves (AUC); the higher the area under the curve, the more powerful the model is in forecasting the related output variable. AUC of the present model is shown in Table 5. Based on the guidelines described by Swets [26], the model is "highly accurate" in predicting cases with outputs of "seldom" and "often", and "moderately accurate" in predicting cases with an output of "sometimes". Furthermore, the results of testing the model on the hold-out data and ROC curves are matched together.
Table 5: The area under ROC curves of the model
Output AUC
Seldom 0.899
Sometimes 0.717
Often 0.914
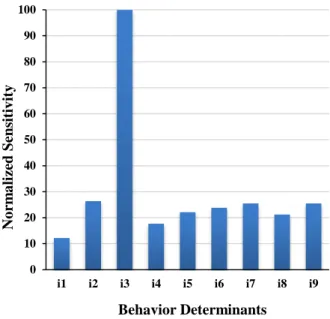
The results of sensitivity analysis are presented in Fig. 4. According to this figure, safety attitude is by far the most important factor affecting safety behavior, followed by safety knowledge, management commitment, and supportive environment. In contrast, resource allocation is determined as the factor with the least effect on safety behavior.
Fig. 3: ROC curve of the model
Fig. 4: The results of sensitivity analysis
(i1= work pressure , i2= safety knowledge, i3= safety attitude, i4= resource allocation, i5= participation, i6= safety management system, i7= supportive environment, i8= motivation, i9= management commitment)
DISCUSSION
Having a predictive model is of vital importance in managing unsafe behavior at workplaces, and in recent years many attempts have been made to construct such a model [7, 27-29]. The ANN model constructed and validated by the present study had an acceptable level of accuracy.
The model was able to predict the correct type of safe behavior in almost 79 percent of cases. Considering the complex nature of safety behavior, this level of accuracy is acceptable. It should be noted that because there are many factors affecting human behavior, controlling these factors or including all of them in a single model is not feasible, so it may be not possible to create a model of a perfect performance. However, the accuracy was lower than that of Bayesian network model we introduced in our previous study [16], suggesting that a Bayesian network is a more powerful classifier than ANN is. Furthermore, nine factors were used as predictors in the model. These factors were selected based on the literature review and experience of the authors. Using sensitivity analysis, we ranked these factors based on the magnitude of their effects on safety behavior. Accordingly, it was revealed that the effect of personal safety attitude on safety behavior is by far higher than those of others. This finding is in line with the Theory of Planned Behavior (TPB), in which attitude, alongside subjective norms and perceived behavioral control, is the most important determinants of human behavior. Attitude is mainly shaped by the outcome being expected from taking a
0 10 20 30 40 50 60 70 80 90 100
i1 i2 i3 i4 i5 i6 i7 i8 i9
No
rm
a
lized
Sens
it
iv
it
y
specific behavior [30]. Therefore, it would be helpful to inform employees about the consequences of an accident that may happen following an unsafe behavior [31]. In this regard, an interesting study has been carried out by Tam et al. [32]. They investigated the effectiveness of a legal reinforcement program, which was designed based on the reinforcement theory, in changing attitude and behavior of those working in the construction industry. They explained that when employees keep hearing about the legal punishments they may incur for their unsafe behavior, Their attitude would begin to change positively.
Safety knowledge was the second important factor affecting the type of behavior an employee may engage in. The relation between safety knowledge and safety behavior has been explored in many studies. For instance, it has been demonstrated by Haapala and Probart [33] that the knowledge of individuals about food borne diseases significantly affected their behavior toward handling foods suspicious to be infected. Similarly, several studies have indicated that the knowledge of individuals about the hazards presented in their workplaces and the effectiveness of PPEs in preventing occupational diseases and accidents would encourage them to use PPEs. In this regard, Levesque et al. [34] reported that farmers with a higher safety knowledge tended to use PPEs protecting them against adverse health effect of pesticides more than those with a lower level of safety knowledge did. Likewise, Beseler and Stallones [35] found a significant correlation between safety knowledge and the use of PPEs among a sample of farmers.
Moreover, safety knowledge is a key factor mediating the effect of various safety management practices (management commitment, safety training, employees' participation, safety communication, safety rules and procedure, and safety promotion policies) and safety climate on safety performance [5, 36]. In the other words, a positive safety climate or a strong commitment from management to safety will not lead to a safe work behavior, unless employees are provided with required safety knowledge. The main tool utilized by organizations to improve the safety knowledge of employees, especially new ones, is the provision of safety training courses. However, an ill-designed safety training program cannot equip employees with the necessary safety knowledge. A systematic and comprehensive program is required to find training needs and such a program should be continuous in terms of retraining employees in regular time intervals [37]. More importantly, a strong support from management and a positive safety climate are essential for employees to employ the acquired knowledge in their daily practices.
Based on sensitivity analysis, supportive environment was another important factor affecting the type of behavior taken by employees at workplaces. This factor reflects how coworkers and supervisors deal with a safe or unsafe behavior taken by an employee and is one the most important determinants of safe behavior. In a poor supportive environment, following safe work practices and using PPEs would be regarded as a sign of weakness or cowardice, so employees do not tend to behave safely. Accordingly, employees would have a natural desire to introduce themselves as a "tough guy" or brave man by means of violating safe work practices or not using PPEs [38, 39]. Another characteristic of a poor supportive environment is the unwillingness of supervisors to inform their subordinates about the hazards posed by the working environment or a negative reaction to subordinates' safe work behavior which may cause the work to progress slowly. Supportive environment from both supervisors and colleagues has been recognized as a major dimension of safety climate [40] and its effect on safe work behavior has been stressed by many studies, as well [38-40].
Lastly, management commitment was another factor with a huge effect on safe work behavior. This factor has been recognized as the main dimension of positive safety climate [41] and also is the most important determinant of safety behavior because it is essential for any safety intervention programs to be successful. Planning and holding effective safety training courses for improving safety knowledge of employees, creating a supportive environment, and designing measures for changing employees' attitude toward safety all need a deep commitment from the management to safety.
CONCLUSION
The model constructed and validated by the present study had an acceptable level of accuracy in predicting safety behavior of employees. The results of sensitivity analysis demonstrate that in order to improve safety behavior, companies should concentrate on such factors as safety attitude, safety knowledge, supportive environment, and management commitment.
ETHICAL ISSUES
The Hamadan University of medical sciences ethics committee approved the study protocol.
CONFLICT OF INTERESTS
There are no conflicts of interest.
AUTHORS’ CONTRIBUTIONS
FUNDING/ SUPPORTING
The project was financially supported by Hamadan University of medical sciences.
ACKNOWLEDGEMENTS
the authors would like to thank Hamadan university of medical sciences for financial supports.
REFERENCES
[1] Mehrdad R, Seifmanesh S, Chavoshi F, Aminian O, Izadi N. Epidemiology of occupational accidents in Iran based on social security organization database. Iranian Red Crescent Medical Journal. 2014;16(1):1-5.
[2] Mahmoudi S, Ghasemi F, Mohammadfam I, Soleimani E. Framework for Continuous Assessment and Improvement of Occupational Health and Safety Issues in Construction Companies. Safety and Health at Work.5(3):125-30.
[3] Haslam RA, Hide SA, Gibb AGF, Gyi DE, Pavitt T, Atkinson S, et al. Contributing factors in construction accidents. Applied Ergonomics. 2005;36(4):401-15.
[4] Heinrich HW. Industrial Accident Prevention. A Scientific Approach. Industrial Accident Prevention A Scientific Approach. 1941(Second Edition),
McGraw-Hill, Torento, Canada, pp. 300-20 .
[5] Vinodkumar MN, Bhasi M. Safety management practices and safety behaviour: Assessing the mediating role of safety knowledge and motivation. Accident Analysis & Prevention. 2010;42(6):2082-93.
[6] Guo BHW, Yiu TW, González VA. Predicting safety behavior in the construction industry: Development and test of an integrative model. Safety Science. 2016;84(1):1-11.
[7] Jitwasinkul B, Hadikusumo BHW, Memon AQ. A Bayesian Belief Network model of organizational factors for improving safe work behaviors in Thai construction industry. Safety Science. 2016;82(1):264-73.
[8] Ghasemi F, Mohammadfam I, Soltanian AR, Mahmoudi S, Zarei E. Surprising Incentive: An Instrument for Promoting Safety Performance of Construction Employees. Safety and Health at Work. 2015;6(3):227-32.
[9] Detienne KB, Detienne DH, Joshi SA. Neural Networks as Statistical Tools for Business Researchers. Organizational Research Methods. 2003;6(2):236-65.
[10] Hornik K, Stinchcombe M, White H. Multilayer feedforward networks are universal approximators. Neural Networks. 1989;2(5):359-66.
[11] Lek S, Delacoste M, Baran P, Dimopoulos I, Lauga J, Aulagnier S. Application of neural networks
to modelling nonlinear relationships in ecology. Ecological Modelling. 1996;90(1):39-52.
[12] Patel D, Jha K. Neural network approach for safety climate prediction. Journal of Management in Engineering. 2014;31(6):05014027-6.
[13] Goh YM, Chua D. Neural network analysis of construction safety management systems: a case study in Singapore. Construction Management and Economics. 2013;31(5):460-70.
[14] Lawshe CH. A quantitative approach to content validity. Personnel psychology. 1975;28(4):563-75. [15] Cronbach LJ. Coefficient alpha and the internal structure of tests. psychometrika. 1951;16(3):297-334.
[16] Mohammadfam I, Ghasemi F, Kalatpour O, Moghimbeigi A. Constructing a Bayesian network model for improving safety behavior of employees at workplaces. Applied Ergonomics. 2017;58(1):35-47. [17] Raykov T, Marcoulides GA. A first course in structural equation modeling: Routledge, Psychology Press; 2012, USA, pp. 20-150.
[18] Haykin SS, Haykin SS, Haykin SS, Haykin SS. Neural networks and learning machines: Pearson Upper Saddle River, NJ, USA:; 2009,pp.122-00. [19] Gardner MW, Dorling SR. Artificial neural networks (the multilayer perceptron)—a review of applications in the atmospheric sciences. Atmospheric Environment. 1998;32(14–15):2627-36. [20] IBM Corporation. IBM SPSS Neural Networks 20. Chicago, IL, US, 2011, 8-20.
[21] Zhang G, Eddy Patuwo B, Y. Hu M. Forecasting with artificial neural networks:: The state of the art. International Journal of Forecasting. 1998;14(1):35-62.
[22] Lippmann R. An introduction to computing with neural nets. IEEE ASSP Magazine. 1987;4(2):4-22. [23] Zhou Q, Fang D, Wang X. A method to identify strategies for the improvement of human safety behavior by considering safety climate and personal experience. Safety Science. 2008;46(10):1406-19. [24] Greiner M, Pfeiffer D, Smith RD. Principles and practical application of the receiver-operating characteristic analysis for diagnostic tests. Preventive Veterinary Medicine. 2000;45(1–2):23-41.
[25] Zou KH, O’Malley AJ, Mauri L. Receiver-Operating Characteristic Analysis for Evaluating Diagnostic Tests and Predictive Models. Circulation. 2007;115(5):654-57.
[26] Swets JA. Measuring the accuracy of diagnostic systems. Science. 1988;240(4857):1285-93.
[28] Patel D, Jha K. Neural network model for the prediction of safe work behavior in construction projects. Journal of Construction Engineering and Management. 2014;141(1):04014066-6.
[29] Zarei E, Mohammadfam I, Aliabadi MM, Jamshidi A, Ghasemi F. Efficiency prediction of control room operators based on human reliability analysis and dynamic decision-making style in the process industry. Process Safety Progress. 2016;35(2):192-9.
[30] Eagly AH, Chaiken S. The psychology of attitudes: Harcourt Brace Jovanovich College Publishers; 1993, USA, pp.120-80.
[31] Shin M, Lee H-S, Park M, Moon M, Han S. A system dynamics approach for modeling construction workers’ safety attitudes and behaviors. Accident Analysis & Prevention. 2014;68(1):95-105.
[32] Tam CM, Fung IWH, Chan APC. Study of attitude changes in people after the implementation of a new safety management system: the supervision plan. Construction Management and Economics. 2001;19(4):393-403.
[33] Haapala I, Probart C. Food Safety Knowledge, Perceptions, and Behaviors among Middle School Students. Journal of Nutrition Education and Behavior. 2004;36(2):71-76.
[34] Levesque DL, Arif AA, Shen J. Effectiveness of Pesticide Safety Training and Knowledge About Pesticide Exposure Among Hispanic Farmworkers. Journal of Occupational and Environmental Medicine. 2012;54(12):1550-56.
[35] Beseler CL, Stallones L. Safety knowledge, safety behaviors, depression, and injuries in Colorado farm residents. American Journal of Industrial Medicine. 2010;53(1):47-54.
[36] Griffin MA, Neal A. Perceptions of safety at work: A framework for linking safety climate to safety performance, knowledge, and motivation. Journal of Occupational Health Psychology. 2000;5(3):347-58.
[37] Vredenburgh AG. Organizational safety: Which management practices are most effective in reducing employee injury rates? Journal of Safety Research. 2002;33(2):259-76.
[38] Choudhry RM, Fang D. Why operatives engage in unsafe work behavior: Investigating factors on construction sites. Safety Science. 2008;46(4):566-84.
[39] Mullen J. Investigating factors that influence individual safety behavior at work. Journal of Safety Research. 2004;35(3):275-85.
[40] Mohamed S. Safety climate in construction site environments. Journal of construction engineering and management. 2002;128(5):375-84.