19
Water Flooding Performance Evaluation Using
Percolation Theory
S. Sadeghnejad & M. Masihi*
Department of Chemical and Petroleum Eng., Sharif University of Technology, Azadi Ave., Tehran, I.R. Iran [email protected]
Abstract
Water flooding is a wellknown secondary mechanism for improving oil recovery. Conventional approach to evaluate the performance of a water flooding process (e.g. breakthrough and post break through behavior) is to establish a reliable geological reservoir model, upscale it, and then perform flow simulations. To evaluate the uncertainty in the breakthrough time or post breakthrough behav ior, this procedure has to be repeated for many realizations of the geological model, which takes many hours of CPU time. Moreover, during the early stage of reservoir life, when data is scare, breakthrough and post breakthrough time behavior prediction are usually based on analogues or rules of thumb. Alternative statistical approach is to use percolation theory to predict breakthrough and post breakthrough bahavior. The main contribution is to evaluate the applicability of the exist-ing scaling laws of the breakthrough time by the numerical flow simulation results using the Burgan formation dataset of Norouz offshore oilfield in the south of Iran. Moreover, we extend the scaling to the post breakthrough behavior. There is good agreement between the predictions from the per-colation based expressions and the numerical simulation results. Moreover, the prediction from the scaling law took a fraction of a second of CPU times (as it only needs some algebraic calculations) compared with many hours required for the conventional numerical simulations.
Key words:
Percolation, Breakthrough time, Post breakthrough behavior, Validation, Case study.Introduction
The breakthrough time, tbr , accounts for the first pas sage time (i.e. transport) between the injector and the producer. The knowledge of this time has many impor-tant applications. Consider water flooding as a second ary recovery method. Once the injected fluid (i.e. water) breaks through in the production wells, the fraction of extracted fluid (i.e. oil) will be reduced. It is important to know when the injected fluid will breakthrough and what the rate of decline in oil production will be for the economic evaluation of an upstream project.
The conventional approach to predict the breakthrough time or post breakthrough behavior is to build a detailed geological model, upscale it, and then perform flow sim ulations. To estimate the uncertainty in such a system, this has to be repeated for various realizations of the geo-logical model. The problem with this approach is that it is computationally very expensive and time consuming. Although there has been some progress to reduce the
cal-culation time [1, 2], there is a great incentive to produce much simpler physically based techniques to predict these reservoir performance parameters very quickly, particularly for engineering purposes.
its (deltaic systems representing the permeable media). Percolation concepts can be used to find the prob ability distribution of the breakthrough time between an injector and a producer. Dokholyan et al. [5] did the pre-elementary study of the breakthrough time. They presented a scaling ansatz for the distribution function of the shortest paths connecting any two points on a percolating cluster. Traveling time and traveling length for tracer dispersion in two dimensional bond percola-tion systems have been studied by Lee et al. [6]. King et al. [7] used percolation theory to predict the distribution of the shortest path between well pairs and presentd a scaling hypothesis for this distribution, which has been confirmed by the numerical simulation. Andrade et al. [4] concentrated on the flow of fluid between two sites on the percolation cluster. They modelled the medium by using bond percolation on a lattice, while the flow front was modeled by tracer particles driven by a pressure dif-ference between two fixed sites representing the injec tion and productions wells. They investigated the dis-tribution function of the shortest path connecting these two wells and proposed a scaling ansatz, which was con-firmed by extensive simulations. Moreover, Andrade et al. [8] investigated the dynamics of viscous penetration in two dimensional percolation networks at criticality for the case in which the ratio between the viscosities of displaced and injected fluids is very large. They reported extensive numerical simulations showing that the scaling exponents for the breakthrough time distribution was the same as the previously reported values computed for the case of unit viscosity ratio. Araujo et al. [9] analyzed the distributions of traveling length and minimal traveling time through two dimensional percolation porous media characterized by relatively long range spatial correla-tions. They found that the probability distribution func-tions follow the same scaling ansatz originally proposed for the uncorrelated case, but with quite different scal-ing exponents. Usscal-ing Monte Carlo simulations, Paul et al. [10] determined the scaling form for the probability distribution of the shortest path between two lines rep-resenting the wells in a three dimensional percolation system at criticality, where the two wells could have ar-bitrary positions, orientations, and lengths. Comparing the result of the proposed scaling laws from percolation theory with the time for a fluid injected into an oilfield to breakthrough into a production well was studied by King et al. [11]. Lopez et al. [12] numerically simulated the traveling time of a tracer in convective flow between two wells in a percolation porous media. They analyzed the traveling time probability density function for two values of the fraction of connecting bonds, namely the homo-geneous case and the inhomohomo-geneous critical threshold case. Soares et al. [13] investigated the distribution of shortest paths in percolation systems at the percolation threshold from one injector well to multiple producer wells. Lopez et al. [14] studied the behavior of the op-timal path between two sites on a d-dimensional lattice with weight assigned to each site. They calculated the
probability distribution of the optimal path length. Li et al. [15] applied percolation method to estimate interwell connectivity of thin intervals for non-communicating stratigraphic intervals in an oilfield.
The aim of this study is to characterize the break-through time and post breakbreak-through behavior between an injector and a producer by using the scaling law prop-soed by Andrade et al. [4] against the detailed reservoir simulation results. For validation, we use the Burgan res-ervoir dataset of Norouz offshore oilfield in the south of Iran. Furthermore, we developed a scaling law for the prediction of post breakthrough behavior based on the probability distribution of breakthrough time. For this purpose, we focus on the time to reach the water cut of 50% in the production well and introduce a new prob-ability distribution function for this.
Breakthrough time
Preliminary studies of breakthrough time behavior [4, 5, 6, 9, and 11] indicate that the percolation model gives useful predictions. It has been shown that the distribution of breakthrough time conditioned to the formation size, L, and net to gross ratio, p, has the scaling [4]:
(1) Where
is the breakthrough time for a given realization, r is the Euclidean distance between the injector and a producer, and is the typical size of reservoir sandbodies. The nu-merical values of the other exponents were determined through rigorous simulation studies (table 1).
Table 1. Numerical values of the exponent in Eq. 1[4] Exponent Value Exponent Value
c
Φ
a ψ
b π 2 : 1
3 : 1 D D
Fixed pressure boundary conditions were considered at the two wells. For each possible configuration of the sys tem, there are many possible streamlines from the injec-tor to the producer well where the injected fluid is pas sively convected along these streamlines. Breakthrough time corresponds to the time when the first tracer reaches the production well for a given reservoir realization. The probability function given by Eq. 1 can be encoded in a spreadsheet from which, using some primary data, the probability distribution of the breakthrough time is determined very quickly. The motivation behind devel-oping Eq. 1 is that in a disordered medium, the stream-lines are like self avoiding random walks with the prob-ability distribution of stretched Gaussian like function, f1. Accounting for finite size effects, large excursions of the streamlines are not permitted by finite boundaries so there will be an upper cut-off given by function f2. In ad-dition, to account for the size of finite size clusters away from the threshold, the truncation of the excursion of the streamlines given by function f3 must be considered.
Appl
i
c
at
i
on
t
o
r
e
al
fie
l
d
To validate the approach, we have used the Burgan for-mation dataset of Norouz offshore oilfield in the south of Iran. Core and palynological data indicated that the Burgan consists of a series of incision fill sequences oc curring in an estuarine/coastal plain/deltaic environment. Consequently, the Burgan formation consists of a thick stack of excellent quality sands incising into each other with a few remaining shalier sediments locally separat-ing these sequences. The excellent formation sands of the Burgan consist mainly of valley fill deposition sedi ments, where freshwater fluvial, coarse grained sediment (highly permeable zones) accumulated in the upper and middle reaches of the incised valley system, while tid-ally influenced sediments accumulated in the marine in fluenced middle and lower reaches. As a result of these aggradations, less fluvial derived sediment reached the lower reaches of the valley system, which resulted in the clean, well sorted shoreline material being reworked and deposited in the tidal channels in this area [16]. Because of this process, the valley fill deposition sediments can be considered as high permeable flow units in a back ground that is essentially impermeable, which makes the Burgan reservoir ready to be modeled with the per-coaltion approach.
Validation of the breakthrough scaling law
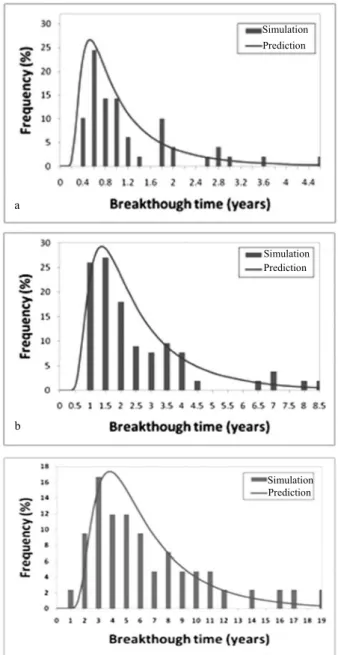
To have different realizations, various points for the well locations in the entire Burgan reservior were randomly selected. Nearly 300 flow simulations were run on these wells at the full scale of the the Burgan reservoir forma-tion. To include well spacing effect, three distinct well spacings are considered as 500m, 750m, and 1000m. Afterward, from the simulation results, the probability distributions of the breakthrough time for each of these well spacings were determined. The comparison of the result of the scaling law of the breakthrough time, Eq. 1,
(dashed curves) with the results obtained from the con-ventional numerical simulations (the bar chart) for three well spacing is shown in Fig. 1.
Figure 1. Comparison of prediction of the breakthrough time using the scaling laws of Eq. 1 (curve) with results
from the numerical simulations (bar chart) for well spacing of a) 500m, b) 750m, c) 1000 m.
As it can be seen in Fig. 2, there is reasonable agreement between the prediction from the scaling law, given by Eq. 1, and the direct numerical simulation results. More-over, the prediction from the scaling law took a fraction of a second of CPU times (as it only needs some alge-braic calculations) compared with hours required for the conventional numerical simulations.
Post breakthrough behavior
The main question in evaluating the post breakthrough behavior is that if the probability distribution of the breakthrough time is available, how this reduces the un-certainty in the post breakthrough behavior.
c
Simulation Prediction
a
Simulation Prediction
b
Figure 2. Illustration of time to reach the water cut of 50% in produc-tion wells versus breakthrough time for different well spacing as
a) 500m, b) 750m, c) 1000 m.
Figure 3. Illustration of the time to reach the water cut of 50% in production wells versus breakthrough time
The general relation between the two times t1/2 and tbr or the Burgan reservoir is as follows:
(2) Therefore, for estimation of the probability distribution of the post breakthrough time (defined by the water cut of 50%), one can use the probability distribution of the breakthrough time from Eq.1 and scale it by using Eq. 2 (Fig. 4a). Figure 4b compares the simulation results of the post breakthrough behavior with the proposed scal-ing law.
Specifically, we want to check if there is a correlation between the breakthrough time results and the time tak-en for the oil production to fall by for example 50%, so called t1/2 , (or water cut to increase to 50%). To get these statistics, we continue the conventional flow simulations to reach this water cut value. Then, we plot t1/2 versus tbron a log-log scale. Fig. 2 shows the results of these cross plots at different well spacings values.
As it can be seen, there is a correlation between the breakthrough time and the time to reach the water cut of 50% in the production well. By plotting the result of all simulation results from different well spacing (Fig. 3), one can check the generality of the relationship between these two times.
Figure 4. a) Scaling anstaz for the probability distribution of the post breakthrough behavior in comparison with the probability of break-through time b) Comparison of prediction of the time to reach the
wa-ter cut of 50% using the scaling laws of post breakthrough behavior (curve) with results from the numerical simulations (bar chart) a
b
c
Tbr (Year)
Tbr (Year)
Tbr (Year)
Tbr (Year)
a Time (Year)
b Time (Year)
Conclusion and Recommendations
Percolation theory is a powerful theory, which can be used for prediction of field scale properties of reservoirs. We set out to estimate the breakthrough time and post breakthrough behavior between two injection and pro-duction wells in terms of percolation concepts. In par-ticular, we have checked that percolation approach could be used to help produce results of interest for engineers without having to perform a large number of numeri-cal simulations for each new geologinumeri-cal media even at the early stage of reservoir life when the availability of certain data is questionable. In particular, the proposed scaling law of the breakthrough time has been compared with the results obtained from the conventional numeri-cal simulations on the Burgan formation dataset of No-rouz offshore oilfield in the south of Iran. In addition, we set out to find a scaling law for the post breakthrough behavior using the probability distribution of the break-through time. There was good agreement between the predictions from the percolation based expression and the numerical simulation results. Moreover, the predic-tion from the scaling law took a fracpredic-tion of a second of CPU times (as it only needs some algebraic calculations) compared with many hours required for the conventional numerical simulations.
Acknowledgements
The authors would like to thank the National Iranian Oil Company for permitting the use of their dataset.
References
[1] Donato D., G. & Blunt M.J., Streamline based dual
porosity simulation of reactive transport and flow in
fractured reservoirs, Water Resour, Res. 40, W04203.1-12, 2004.
[2] Huang W., D. Donato G. & Blunt M.J., “Comparison of streamline based and grid based dual porosity
simula-tion”, J. Pet. Sci. Eng. 43, pp. 129-137, 2004.
[3] Stauffer D. & Aharony A., Introduction to Percola-tion theory, second Ed., Taylor and Francis, London, 1994.
[4] Andrade J.S., Jr., Buldyrev S.V., Dokholyan N.V., Havlin S., King P.R., Lee Y., Paul G. & Stanley H.E., “Flow between two sites on a percolation cluster”, Phys. Rev. E 62 pp. 8270-8281, 2000.
[5] Dokholyan N.V., Buldyrev S.V., Havlin S., King P.R.,
Lee Y. & Stanley H.E., “Distribution of shortest paths in percolation”, Phys. Rev. A 266, pp. 5561, 1999. [6] Lee Y., J.S. Andrade Jr., Buldyrev S.V. , Dokholy-an N.V. , Havlin S., King P.R. , Paul G., StDokholy-anley H E., “Traveling time and traveling length in critical percola-tion clusters”, Phys. Rev. E 60, pp. 32453248, 1999. [7] King P.R., J.S. Andrade Jr., Buldyrev S.V., Dokho-lyan N., Lee Y., Havlin S., Stanley H.E., Predicting oil recovery using percolation, Phys. Rev. A 266 107-114, 1999.
[8] Andrade J.S. Jr., Araujo A.D., Buldyrev S.V. , Havlin S., Stanley H.E., Dynamics of viscous penetration in per-colation porous media, Phys. Rev. E 63, 051403, 2001. [9] Araujo D., Moreira A.A., Makse H.A., Stanley H.E., & Andrade J.S. Jr., Traveling length and minimal
traveling time for flow through percolation networks
with long-range spatial correlations, Phys. Rev. E 66, 046304, 2002.
[10] Paul G., Havlin S. & Stanley H.E., Fractal behavior of the shortest path between two lines in percolation sys-tems, Phys. Rev. E 65, 066105, 2002.
[11] King P.R., Buldyrev S.V., Dokholyan N.V., Havlin S., Lopez E., Paul G. , Stanley H.E., “Uncertainty in oil
production predicted by percolation theory”, Phys. Rev. A 306, pp. 376-380, 2002.
[12] Lopez E., Buldyrev S.V., Dokholyan N.V., Gold-makher L., Havlin S., King P.R. & Stanley H.E.,
Post-breakthrough behavior in flow through porous media, Phys. Rev. E 67, 056314, 2003.
[13] Soares R.F., Corso G., Lucen L.S., Freitas J.E., da Silva L.R., Paul G. & Stanley H.E., “Distributionof shortest paths at percolation threshold: application to
oil recovery with multiple wells”, Phys. A 343, pp. 739-747, 2004.
[14] López E., Buldyrev S.V., Braunstein L.A., Havlin S. & Stanley H.E., Possible connection between the
op-timal path and flow in percolation clusters, Phys. Rev. E 72, 056131, 2005.
[15] Li W., Jensen J.L., Ayers W.B., Hubbard S.M. & Heidari M.R., “Comparison of interwell connectivity
predictions using percolation, geometrical, and Monte
![Table 1. Numerical values of the exponent in Eq. 1[4]](https://thumb-us.123doks.com/thumbv2/123dok_us/8036255.2127913/2.892.462.798.746.992/table-numerical-values-exponent-eq.webp)