VOLUME 17 ISSUE 2 (2019), Page 249 – 258
THE ANALYSIS OF VULNERABILITY FACED BY GAHAI AGROPOLITAN PARTICIPANTS
Mohd Khairi Ismail1, Chamhuri Siwar2, Rospidah Ghazali3,
Nor Zuriati Amani Ab Rani4, & Basri Abdul Talib5
1,2,3,4,5Institute for Environment and Development (LESTARI)
UNIVERSITI KEBANGSAAN MALAYSIA
Abstract
Vulnerability is always related to the poor group. Vulnerability can be defined as being vulnerable to damage or ill effects because of changes in the society and the environment, and the inability to adapt to changes. In-depth understanding is important to probe what action should be taken to achieve the sustainability of the community and its environment. In Malaysia, the government has implemented various eradication programmes on rural poverty, and sustainable livelihoods, such as the agropolitan projects. Agropolitan projects are capable of achieving the objective to eradicate poverty, and the vulnerability faced by project participants which will affect their lives. Therefore, the purpose of this study was to identify the vulnerability of agropolitan participants in Malaysia by utilising the Gahai Agropolitan, Lipis, Pahang project as a case study. This study used simple random sampling and it involved 45 participants of Gahai Agropolitan Project. Data were analysed using the Descriptive Analysis and Exploratory Factor Analysis (EFA). The findings showed that Gahai Agropolitan Project Participants faced multi-dimensional vulnerability in terms of economic, social, and physical and environmental aspects. Therefore, the Ministry of Rural Development (KKLW) and the Rubber Industry Smallholders Development Authority (RISDA) need to pay more attention to reduce the vulnerability to participants of the agropolitan project, and help them to increase their income and improve their lives.
INTRODUCTION
Poverty in rural areas has shown a higher rate than in urban areas (Economic Planning Unit, 2015). This situation usually occurs among rural people who are involved in agricultural activities. Poverty is also related to vulnerability. Vulnerability is a very important aspect to consider in creating the basic policy or programme development for sustainable livelihoods. Many of the plans, policies and development programmes implemented do not achieve optimal results and fail because they do not include the context of vulnerability. According to Idrus, Lim and Hadi (2004), a deep understanding of these vulnerabilities is important to understand any action taken to achieve sustainability of the community and its environment.
In Malaysia, the government has implemented various poverty alleviation programmes in rural areas and sustainable livelihoods. In 2007, the government implemented the agropolitan project to continue the programmes of eradicating poverty and increase the sustainable livelihood of poor people in rural areas. The implementation of the agropolitan project was successful when the report showed that the income of the participants was increasing (Economic Planning Unit, 2015). However, the participants are still facing vulnerability. Therefore, the purpose of this study is to identify the vulnerability of participants in agropolitan projects in Malaysia, focusing on Gahai Agropolitan Project, Lipis, Pahang.
LITERATURE REVIEW
Vulnerability is defined as a situation of facing unexpected risks. Based on the basic theory of economics, vulnerability is the exposure to risks and uncertainties about the future that adversely affects the well-being of individuals (Chaudhuri, 2003). Vulnerability is the pressure on the path towards achieving sustainable development. Every development effort, especially in a country that is rushing to develop its economy and community, will face various barriers to sustain the venture. This is partly due to the members of the community itself, and some from various external causes, especially the country's stability to guide development (Hadi, Idrus, Mohamed, & Harman Shah,2006).
trends refer to demographics, the environment, the economy, and technology trends.
According to Christiaensen and Boisvert (2000), there is a difference between poverty and vulnerability. Poverty describes a situation of inadequacy at one time, while vulnerability refers to the probability of experiencing scarce in the future. In other words, vulnerability is a risk that can affect the future of an individual. For example, if individuals have minimal income nowadays, they are considered indigent and susceptible to vulnerabilities, such as loss of jobs that can affect their income.
Ibrahim and Siwar (2017) state that lower-income groups and vulnerable groups face natural disasters. The effects of natural disasters can affect their income and life. Changes in climate and flood can cause heat rise, the occurrence of diseases and growing crop pests, and these affect vulnerability.
METHODOLOGY
This study was conducted in the Gahai Agropolitan Project, Lipis, Pahang. The development of the Gahai Agropolitan Project started in 2007 and expired in 2012. The Gahai Agropolitan Project, Lipis, covered an area of 238.76 hectares involving 50 participants (KKLW, 2012). The selection of Gahai Agropolitan Project, Lipis for this study was based on the criteria that (i) Gahai Agropolitan Project has exceeded development for more than five years, and enabled impact studies to be conducted; (ii) Gahai Agropolitan Project is located in Pahang State, which is one of the states with high poverty rates (Economic Planning Unit, 2015), and is in line with the objectives of the study in assessing the impact of agropolitan projects in eradicating poverty, and (iii) the selection of the Gahai Agropolitan Project was a recommendation from the Ministry of Rural and Regional Development (KKLW) as it is an early agropolitan project of its establishment and shows good performance.
The population of this study was 50 participants of Gahai Agropolitan Project and 45 participants were used as sample. This study used simple random sampling. The determination of the number of sample for this study was based on the suggestion by Krejcie and Morgan (1970).
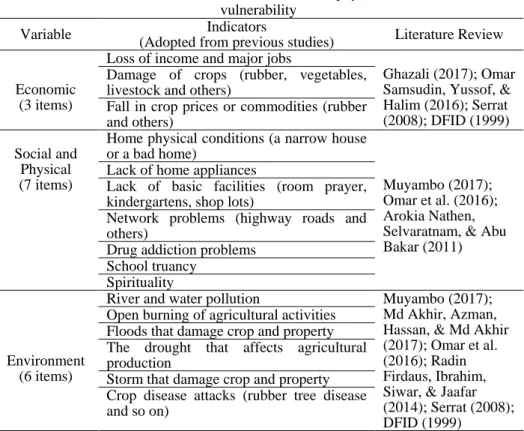
Table 1 List of variable in economic, social/physical and environmental vulnerability
Variable Indicators
(Adopted from previous studies) Literature Review
Economic (3 items)
Loss of income and major jobs
Ghazali (2017); Omar Samsudin, Yussof, & Halim (2016); Serrat (2008); DFID (1999) Damage of crops (rubber, vegetables,
livestock and others)
Fall in crop prices or commodities (rubber and others)
Social and Physical (7 items)
Home physical conditions (a narrow house or a bad home)
Muyambo (2017); Omar et al. (2016); Arokia Nathen, Selvaratnam, & Abu Bakar (2011) Lack of home appliances
Lack of basic facilities (room prayer, kindergartens, shop lots)
Network problems (highway roads and others)
Drug addiction problems School truancy
Spirituality
Environment (6 items)
River and water pollution Muyambo (2017);
Md Akhir, Azman, Hassan, & Md Akhir (2017); Omar et al. (2016); Radin Firdaus, Ibrahim, Siwar, & Jaafar (2014); Serrat (2008); DFID (1999)
Open burning of agricultural activities Floods that damage crop and property The drought that affects agricultural production
Storm that damage crop and property Crop disease attacks (rubber tree disease and so on)
This study used two methods to investigate vulnerability analysis, namely the Descriptive Analysis and Exploratory Factor Analysis (EFA). The descriptive analysis was used to show the type and percentage of respondents who faced vulnerability. The Exploratory Factor Analysis (EFA) was analysed using SmartPLS 3.0 software. SmartPLS 3.0 combines the factor analysis and regression analysis, and it meets the minimum assumptions in achieving variance explanation, which is a high coefficient of determination (R2) value. Using SmartPLS 3.0 software was suitable for Gahai Agropolitan Project due to the small sample size of 45 respondents.
RESULT
Respondents Profile
and 41 to 45 years, both groups at 22.2%. Respondents aged 35 and below were the lowest in number, at only 2.2%.
Analysis of education level indicates that the majority of respondents have completed secondary education (SPM) at 51.1%, lower secondary school (PMR/SRP) at 17.8%, and primary school education 26.7%. The results also indicate that for most respondents, their number of household members (AIR) exceeds four persons. Only 26.7% of respondents have household members between 3 to 4 person, and 11.1% have household members between 1 to 2 person.
Table 2 Respondents profile No of respondent, n = 45
Item Percentage
(%)
Item Percentage
(%)
Gender Education
Male 82.2 Primary school/ UPSR 26.7
Female 17.8 Lower Secondary school/ PMR/
SRP
17.8
Age Secondary school/ SPM 51.1
Below 35 years old 2.2 Higher secondary: STPM/
certificate
2.2
36 – 40 years old 22.2 Number of household members
41 – 45 years old 22.2 1 – 2 people 11.1
46 – 50 years old 28.9 3 – 4 people 26.7
51 – 55 years old 11.1 5 – 6 people 44.4
56 years old and above
13.3 7 – 8 people 13.3
More than 9 people 4.4
Source: Field of Study, 2017
Descriptive Analysis
Economic Vulnerability
Table 3 Economic vulnerability
Types of Vulnerability n = 45
Percentage (%)
Loss of income and major jobs 60.0
Damage of crops (rubber, vegetables, livestock and others) 53.3
Fall in crop prices or commodities (rubber and others) 93.3
Source: Field of Study, 2017
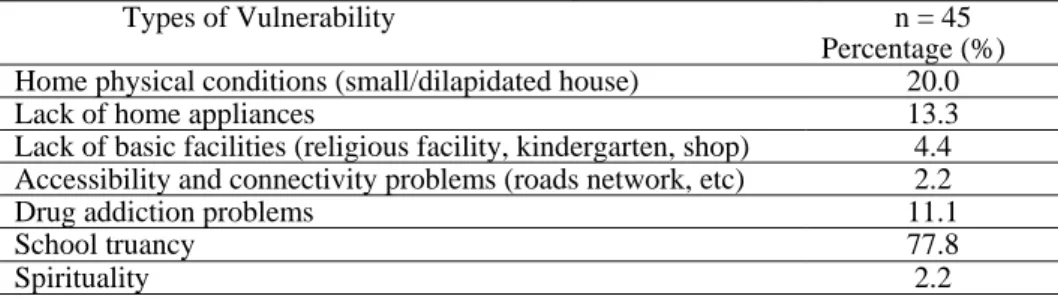
Social and Physical Vulnerability
Based on Table 4, vulnerability of social and physical aspects such as the physical condition of home (small or dilapidated house), lack of home appliances, lack of basic facilities (religious facilities, kindergarten, and shops), accessibility and connectivity problems (road network, etc.), drug addiction problems, school truancy, and spiritual problems were experienced by participants of the Gahai Agropolitan Project. School truancy was the highest vulnerability of social and physical aspects at 77.8%. This is followed by home physical condition at 20.0%, lack of home appliances (13.3%), drug addiction problems (11.1%), lack of basic facilities (4.4%) and accessibility and connectivity problems (2.2 %).
Table 4 Social and physical vulnerability
Types of Vulnerability n = 45
Percentage (%)
Home physical conditions (small/dilapidated house) 20.0
Lack of home appliances 13.3
Lack of basic facilities (religious facility, kindergarten, shop) 4.4
Accessibility and connectivity problems (roads network, etc) 2.2
Drug addiction problems 11.1
School truancy 77.8
Spirituality 2.2
Source: Field of Study, 2017
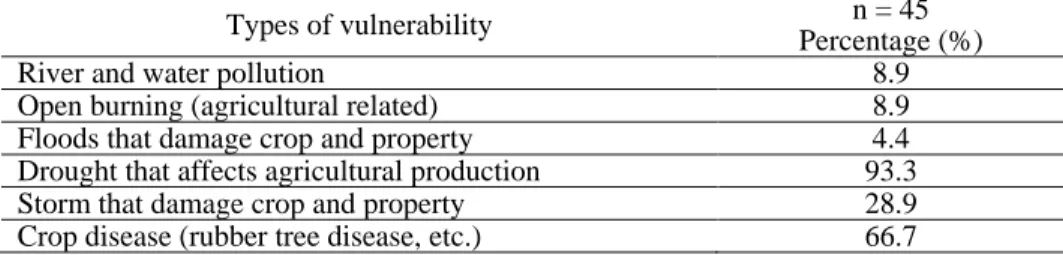
Environmental Vulnerability
Table 5 Environment Vulnerability
Types of vulnerability n = 45
Percentage (%)
River and water pollution 8.9
Open burning (agricultural related) 8.9
Floods that damage crop and property 4.4
Drought that affects agricultural production 93.3
Storm that damage crop and property 28.9
Crop disease (rubber tree disease, etc.) 66.7
Source: Field of Study, 2017
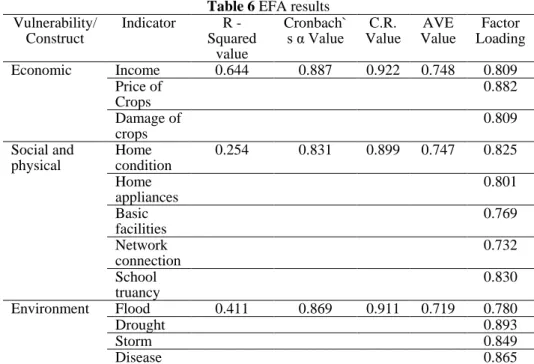
Exploratory Factor Analysis (EFA)
Exploratory Factor Analysis (EFA) was analysed using SmartPLS 3.0 (Table 6). The result of this analysis identifies three constructs representing the vulnerability faced by participants of the Gahai Agropolitan Project, namely the economic, social and physical, and environmental vulnerability. The results of the analysis show that only twelve from 16 indicators were accepted as the vulnerability of Gahai Agropolitan Project Participants. The economic vulnerability includes three indicators such as loss of income or major job (0.809), damage of crops (rubber, vegetables, livestock and others) (0.882) and falls in crop prices or commodity (rubber and others) (0.809). While social and physical vulnerability involves five indicators which include the physical condition of the house (small/dilapidated house) (0.825), lack of home appliances (0.801), lack of basic facilities (room prayer, kindergartens, and shop lots) (0.769), communication network problems (0.732) and school truancy problems (0.803). Whereas, the environmental vulnerability includes floods that damage crops and property (0.780), the drought that affects agricultural production (0.893), storm that damages crops and property (0.849), and plant disease (0.865).
To confirm the EFA analysis results, some basic criteria were evaluated to ensure that constructs and indicators obtained were statistically acceptable. There are three evaluation criteria to determine acceptability of EFA results, which are (i) reliability, (ii) internal consistency (Convergent validity), and (iii) discriminant validity. Construct reliability can be evaluated for Composite Reliabilities (CR) and Cronbach Alpha (CA) values. Based on Table 6, all CR and CA values exceed 0.6 as proposed by Hulland (1999). The CR value was between 0.899 and 0.922, and the CA value was 0.831 to 0.887, therefore constructs and indicators had the reliability.
Table 6 EFA results Vulnerability/
Construct
Indicator R
-Squared value
Cronbach`
s α Value Value C.R.
AVE Value
Factor Loading
Economic Income 0.644 0.887 0.922 0.748 0.809
Price of Crops
0.882
Damage of crops
0.809
Social and physical
Home condition
0.254 0.831 0.899 0.747 0.825
Home appliances
0.801
Basic facilities
0.769
Network connection
0.732
School truancy
0.830
Environment Flood 0.411 0.869 0.911 0.719 0.780
Drought 0.893
Storm 0.849
Disease 0.865
Note: Income: Losing the main source of income/main occupation; Price of crop: Damage of crops (rubber, vegetables, livestock and others); Damage of crops: Damage of crop (rubber, vegetables, livestock and others); Home condition: The home’s physical condition (narrow or shabby home); Home appliances: Lack of home appliances; Basic facilities: Lack of basic facilities (religious facility, kindergarten, shop); Network connection: Accesibility problems (road network, etc.); School truancy: School truancy problem Flood: Floods that damage crops and properties; Drought: Drought affects agricultural productions; Storm: Storms that damage crops and property; Disease: Crop diseases.
Furthermore, in assessing discriminant validity, the AVE construct must be greater than the shared variance between the construct and other construct models (Chin, 1998). Table 7 shows the correlation of the matrix with the correlation value between the constructs representing the type of vulnerability and the Square Root of AVE in the diagonal region. Based on Table 7, elements outside diagonal are larger than elements inside diagonal based on rows and columns. Thus, there is a discriminant validity.
Table 7 Correlation between construct and shared variance
Construct Environment Economic Social and Physical
Environment 0.782
Economic 0.641 0.848
CONCLUSION
In conclusion, Gahai Agropolitan Project Participants face multi-dimensional vulnerability in terms of economic, social and physical, and environmental aspects. Only twelve indicators from 16 indicators are accepted as factors of vulnerability in the Gahai Agropolitan Project. All variables of economic vulnerability were accepted such as loss of income or major job, damage of crops (rubber, vegetables, livestock and others) and falls in crop prices or commodity (rubber and others). Meanwhile, for social and physical vulnerability, only five variables were accepted as factors in Gahai Agropolitan Project which are the physical condition of the house (narrow or shabby home), lack of home appliances, lack of basic facilities (religious facility, kindergarten, and shops), communication network problems and school truancy problems. There are four indicators on the vulnerability of the environment, consisting of floods that damage crops and property, the drought that affects agricultural production, storm that damages crops and properties, and plant diseases. The CR value was between 0.899 and 0.922, and the CA value was 0.831 to 0.887, indicating constructs and indicators reliability. The value of AVE, ranging from 0.719 to 0.748, shows that all the items in the three constructs have internal consistency. Based on this study, the vulnerability can be defined as a difficult situation faced by Gahai Agropolitan Project participants that are affecting their lives. Therefore, the Ministry of Rural Development (KKLW) and the Rubber Industry Smallholders Development Authority (RISDA) need to pay more attention to reduce the vulnerability to the participants of the agropolitan project, and help them to increase their income and improve their lives.
ACKNOWLEDGEMENTS
The authors would like to thank the Universiti Kebangsaan Malaysia Mainstream Research Grant (UKM-AP-2014-17) and the Universiti Kebangsaan Malaysia Research University Grant (UKM-GUP-2015-050) for funding the fieldwork and other research activity related to this project.
REFERENCES
Arokia Nathen, A., Selvaratnam, D. P., & Abu Bakar, N. (2011). Hubungan tingkat
pendapatan dan kehidupan lestari: Kerangka konseptual. Persidangan
Kebangsaan Ekonomi Malaysia ke VI (PERKEM VI), Ekonomi Berpendapatan Tinggi: Transformasi ke Arah Peningkatan Inovasi, Produktiviti dan Kualiti Hidup, June 5-7, 2011, Melaka, Malaysia.
Chaudhuri, S. (2003). Assessing vulnerability to poverty: Concepts, empirical methods
and illustrative examples. Retrieved from
https://pdfs.semanticscholar.org/4461/840126dab19ab38692628d35de9516e6d cc0.pdf.
Chin, W. W. (1998). The partial least squares approach to structural equation
Christiaensen, L. J., & Boisvert, R. N. (2000). On measuring household food vulnerability: Case evidence from Northern Mali. Ithaca, NY: Department of Agricultural, Resource, and Managerial Economics, Cornell University.
DFID (1999). Sustainable Livelihoods and Poverty Elimination. UK: Department for
International Development.
Economic Planning Unit. (2015). Rancangan Malaysia Kesebelas 2015-2020. Kuala
Lumpur: Jabatan Percetakan Negara.
Ghazali, R. (2017). Keterangkuman dan masyarakat saksama: Multidimensi kemudahterancaman isi rumah B40. In Institut Tadbiran Awam Negara (Ed.).
Memperkasa sosioekonomi kelompok B40: Mendepani arus perdana (pp. 49-64). Kuala Lumpur: Author.
Hadi, A. S., Idrus, S., Mohamed, A. F., & Harman Shah, A. H. (2006). Perubahan
persekitaran dan kemudahterancaman lembangan Langat. Bangi: Penerbit
UKM.
Henninger, N. (1998). Mapping and geographic analysis of poverty and human welfare:
Review and assessment. Report prepared for the UNEP-CGIAR Consortium for
Spatial Information. Washington, DC: World Resources Institute.
Ibrahim, A. Z., & Siwar, C. (2017). Kelestarian penghidupan petani luar bandar. Sintok:
Universiti Utara Malaysia
Idrus, S., Lim C. S., & Hadi, A. S. (2004). Kemudahterancaman (vulnerability) penduduk
terhadap perubahan guna tanah di Selangor. Malaysian Journal of
Environmental Management, 5: 79-98.
Kementerian Luar Bandar dan Wilayah [KKLW] (2012). Garis panduan pengurusan
ladang sejahtera projek agropolitan di bawah program lonjakan mega luar
bandar (PLMLB). Putrajaya: Auhtor.
Krejcie, R. V., & Morgan, D. W. (1970). Determining sample size for research
activities. Educational and psychological measurement, 30(3), 607-610.
Md Akhir, N., Azman, A., Hassan, N., & Md Akhir, N. H. ( 2017). Kajian penelitian
masalah mangsa bencana banjir disember 2014 di Kelantan. Journal of Social
Sciences and Humanities, Special Issue 3, 007.
Muyambo, F., Jordaan, A.J. & Bahta, Y.T., (2017). Assessing social vulnerability to
drought in South Africa: Policy implication for drought risk reduction. Jàmbá:
Journal of Disaster Risk Studies, 9(1), a326.
Omar, M., Samsudin, M., Yussof, I., & Halim, S. A. (2012). Kemudahterancaman dan kelestarian hidup komuniti luar bandar: Satu penelitian dari sudut kerangka
kelestarian hidup. Journal of Tropical Marine Ecosystem,2, 71-82.
Radin Firdaus, R. B., Ibrahim, A. Z., Siwar, C., & Jaafar, A. H. (2014). Penghidupan petani padi dalam mendepani cabaran perubahan iklim: Peranan intervensi
kerajaan menerusi Skim Subsidi Harga Padi (SSHP). Kajian Malaysia, 32(2),
73-92.
Serrat, O, (2008). The sustainable livelihoods approach. Knowledge Solutions, November
2008, 1-4